proportion of about 35%, learners' contribution (tuition, fees) accounts for about 55%, community contribution accounts for about 10% if the proportion of students trained through the non-public education system is 30% - 40%. However, with the current situation of NNLDL trained through the public education system, the author estimates the cost sharing ratio between the state - learners - community to be 40% - 50% - 10%.
Table 2.15. Domestic investment capital demand for tourism of tourism training institutions under the Ministry of Culture, Sports and Tourism in the period 2006-2013
Unit: Million VND
TT
Year Capital | 2006 | 2007 | 2008 | 2009 | 2010 | 2011 | 2012 | 2013 | 2006- 2012 | |
1 | From the State budget | 64,374 | 70,125 | 77,278 | 85,198 | 99,579 | 118,741 | 139,064 | 146,095 | 800.454 |
2 | From the people (tuition) | 80,467 | 87,656 | 96,598 | 106,497 | 124,474 | 148,426 | 173,830 | 182,619 | 1,000,568 |
3 | From the community | 16,093 | 17,531 | 19,320 | 21,299 | 24,895 | 29,685 | 34,766 | 36,524 | 200,114 |
4 | Total | 160,935 | 175,313 | 193.195 | 212,995 | 248,947 | 296,853 | 347,661 | 365,237 | 2,001,135 |
Maybe you are interested!
-

 Demand, Capability and Perspectives on Mobilizing Investment Capital for Developing Human Resources for Vietnam Tourism in International Economic Integration to 2020
 -
 Cronbach's Alpha Reliability Coefficient of Components of the Scale of Factors Affecting Investment Capital Attraction for Tourism in Ba Ria Vung Tau Province
 -
 Current Status of Attracting Investment Capital into Tourism in
 -
 Domestic Research on Project Investment Management Using State Budget Capital.
 -
 Call for Encouraging Capital Investment in Zen Tourism
(Source: Author's calculation)
According to calculations, the annual tuition fee for a university-trained worker is about 700 USD - 800 USD for the period 2006-2013. The USD/VND exchange rate in 2006, 2007 was 16,000 VND, in 2008 it was 16,500 VND,
In 2009 it was 17,000 VND, in 2010 it was 18,500 VND, in 2011 it was 20,600 VND, in 2012 it was 20,800 VND, in 2013 it was 21,800 VND, the coefficient for calculating tuition fees between college, intermediate and primary training systems compared to university is 0.8 - 0.7 - 0.3 respectively, then the capital demand from people's contributions through the tuition fee per student of the training institutions under the Ministry of Culture, Sports and Tourism in the period of 2006-2013 is determined according to Appendix 14
Figure 2.6. Domestic investment capital demand for tourism development of tourism training institutions under the Ministry of Culture, Sports and Tourism in the period 2006-2013
200,000
150,000
100,000
50,000
From the State budget
-
From the people (tuition)
From the community
(Source: Author's calculation)
- Foreign investment capital needs
In the context of international economic integration, in addition to many other goals, attracting foreign investment capital is one of the important goals. The demand for foreign investment capital in this period accounts for about 20% of the total investment capital, meaning that if domestic investment capital is 2,001,135 million VND, the demand for foreign investment capital is 500,284 million VND. In this period, foreign investment capital is mainly mobilized through the form of ODA.
Level of capital investment guarantee for NNLDL development in the period 2006 - 2013
The level of capital investment for NNLDL development in the period 2006-2013 is determined by comparing the actual capital mobilized and the capital investment demand.
Compared to the demand, the actual mobilized investment capital only meets 62.3%, of which domestic investment capital meets 59.8%, and foreign mobilized capital meets 72.3%. Thus, if public training institutions can mobilize an additional 942,750 million VND, they will meet the demand for investment capital for the development of human resources for the period 2006 - 2013.
Table 2.16. Level of capital investment guarantee for tourism development of tourism training institutions under the Ministry of Culture, Sports and Tourism in the period 2006-2013
TT
Investment capital | Investment capital needs (million dong) | Actual capital mobilized (million dong) | Actual vs. Demand Difference (million dong) | Investment capital requirement guarantee level | |
1 | Domestic investment capital | 2,001,135 | 1,197,169 | -803.966 | 59.8% |
2 | Foreign investment capital | 500,284 | 361,500 | -138,784 | 72.3% |
3 | Total | 2,501,419 | 1,558,669 | -942.750 | 62.3% |
(Source: Author's calculation)
Table 2.17. Level of ensuring domestic investment capital demand for tourism development of tourism training institutions under the Ministry of Culture, Sports and Tourism in the period 2006-2013
TT
Year of Capital | 2006 | 2007 | 2008 | 2009 | 2010 | 2011 | 2012 | 2013 | 2006-2013 | |
1 | State budget | |||||||||
-Demand (million dong) | 64,374 | 70,125 | 77,278 | 85,198 | 99,579 | 118,741 | 139,064 | 146,095 | 800.454 | |
-Actual (million VND) | 73,521 | 73,595 | 81,772 | 82,598 | 85,153 | 94,614 | 95,570 | 96,526 | 683,350 | |
-Demand assurance level (%) | 114.2% | 104.9% | 105.8% | 96.9% | 85.5% | 79.7% | 68.7% | 66.1% | 85.4% | |
2 | From the people (tuition) | |||||||||
-Demand (million dong) | 80,467 | 87,656 | 96,598 | 106,497 | 124,474 | 148,426 | 173,830 | 182,619 | 1,000,568 | |
-Actual (million VND) | 25,813 | 27,591 | 29,736 | 32,017 | 34,117 | 74,739 | 92,163 | 102,630 | 418,806 | |
-Demand assurance level (%) | 32.1% | 31.5% | 30.8% | 30.1% | 27.4% | 50.4% | 53.0% | 56.2% | 41.9% | |
3 | From the community | |||||||||
-Demand (million dong) | 16,093 | 17,531 | 19,320 | 21,299 | 24,895 | 29,685 | 34,766 | 36,524 | 200,114 | |
-Actual (million VND) | 9,034 | 9.105 | 9,070 | 11,526 | 11,941 | 13,135 | 14,711 | 16,491 | 95,013 | |
-Demand assurance level (%) | 56.1% | 51.9% | 46.9% | 54.1% | 48.0% | 44.2% | 42.3% | 45.2% | 47.5% | |
4 | Total | |||||||||
-Demand (million dong) | 160,935 | 175,313 | 193.195 | 212,995 | 248,947 | 296,853 | 347,661 | 365,237 | 2,001,135 | |
-Actual (million VND) | 108,369 | 110,291 | 120,578 | 126,141 | 131,211 | 182,489 | 202,444 | 215,647 | 1,197,169 | |
-Demand assurance level (%) | 67.3% | 62.9% | 62.4% | 59.2% | 52.7% | 61.5% | 58.2% | 59.0% | 59.8% |
(Source: Author's calculation)
With the data on domestic investment capital demand determined in Table 2.15 and the actual mobilized investment capital in Table 2.9, the level of ensuring domestic investment capital demand is determined according to Chart 2.7 and Table 2.17. Chart 2.7. Level of ensuring domestic investment capital demand for development
NNLDL of tourism training institutions under the Ministry of Culture, Sports and Tourism in the period 2006-2013
Capital requirements
Actual capital mobilized
1,000,568
800,454
683,350
418,806
200,114
95,013
State budget
Capital mobilized from people Capital mobilized from the community
people (tuition) dong
(Source: Author's calculation)
The level of domestic investment capital mobilized in the period of 2006-2013 only ensured nearly 60% of the investment capital demand. State budget capital ensured more than 85% of the demand, in which the level of capital demand assurance has gradually decreased in recent years. However, with the trend of reducing the burden on the state, the state budget has gradually decreased, the level of capital demand assurance from people's contributions (tuition fees) has gradually increased in recent years. The capital from people's contributions through tuition fees in the period of 2006-2013 ensured nearly 42% of the demand. If since 2006, the capital from tuition fees only met 32% of the demand, since 2011 it has increased to over 50%. In addition to the above two capital sources, although capital mobilized from the community accounts for a small proportion of the total capital source, with the current trend of socialization in human resource development, this capital source has met about 48%.
Thus, domestic investment capital needs have not met the demand of 40.2%, of which state budget capital, capital from people through tuition fees, and capital from the community are 14.6%, 58.1%, and 52.5%, respectively.
2.2.2.2. For non-public training institutions
Chart 2.8. Investment capital guarantee level for NNLDL
of non-public tourism training establishments in 2013
≤ 20%
0%
>20%-40%
9%
>40%-60%
37%
>60%-80%
43%
>80%-100%
11%
> 100%
0%
0%
10%
20%
30%
40%
50%
(Source: Author's survey results in 2013)
Through the survey, the results showed that 43% of units said that the actual investment capital can meet from 60% to 80% of the investment capital demand, 37% said that it can only meet from 40% to 60%, 11% said that it can meet from 80% and 9% said that it can only meet from 20% to 40%. Thus, no training facility can meet the investment capital demand, most of them are only at the level of 40% to 80%.
2.2.2.3. For tourism businesses
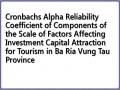
Compared with the capital investment demand for NNLDL development in tourism enterprises, most of the actual capital meets from 10% to 30% of the capital demand (63%), the remaining 20% of enterprises meet from 30% to 50%.
6% of businesses meet 10% or less of capital needs and 11% of businesses meet over 50% of capital needs.
Chart 2.9. Investment capital guarantee level for tourism enterprises in 2013
( Source: Author's survey results in 2013)
2.2.3. Investment rate for 1 tourism worker in the period 2006 - 2013
2.2.3.1. For public training institutions
Table 2.18: Investment rate from domestic capital sources for 1 tourism human resource at the tourism training center under the Ministry of Culture, Sports and Tourism in the period 2006-2013
TT
Year Target | 2006 | 2007 | 2008 | 2009 | 2010 | 2011 | 2012 | 2013 | 2006-2013 | |
1 | Number of tourism employees (People) | 21,285 | 22,452 | 23,575 | 24,803 | 26,185 | 29,315 | 30,985 | 30,487 | 209,086 |
2 | Total investment (million dong) | 108,369 | 110,291 | 120,578 | 126,141 | 131,211 | 182,489 | 202,444 | 215,647 | 1,197,169 |
3 | Investment rate for 1 tourism worker (2/1) ( Million VND/person) | 5.1 | 4.9 | 5.1 | 5.1 | 5.0 | 6.2 | 6.5 | 7.1 | 5.7 |
% compared to last year | -3.5% | 4.1% | -0.6% | -1.5% | 24.2% | 5.0% | 8.3% | 5.1% |
(Source: Author's calculation based on data from the Department of Training - Department of Financial Planning - Ministry of Culture, Sports and Tourism)
In the period 2006-2013, the total domestic and foreign capital was 1,558,669 million VND invested in 209,086 employees, on average, each employee received 7.5 million VND investment per year, of which domestic capital was 5.7 million VND and foreign capital was 1.8 million VND.
To train a human resource with tourism expertise, the domestic investment capital in 2013 was 7.1 million VND, an increase of nearly 1.4 times compared to 2006. In particular, in 2011 compared to 2010, the domestic investment rate increased by more than 24% due to the increase in contributions from learners. On average, during the 2006-2013 period, the investment rate from domestic capital for 1 tourism human resource was 5.7 million VND/person, increasing by about 5% each year.
2.2.3.2. For non-public training institutions
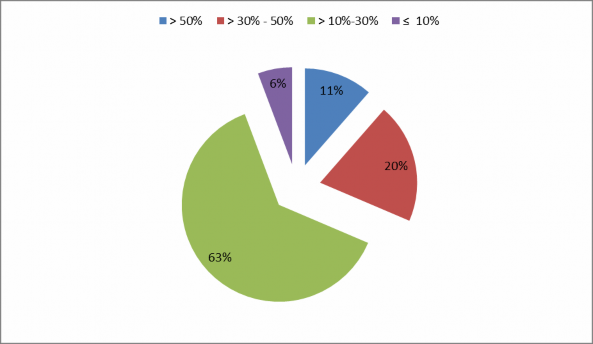
Chart 2.10. Investment rate per tourism worker in non-public tourism training institutions in 2013
(Source: Author's survey results in 2013)
The investment rate per tourism worker in non-public tourism training institutions is very different due to the dependence on tuition fees and investment in technical facilities of each institution. The investment rate per tourism worker in 2013 ranged from over 5 million VND to 25 million VND/year, of which the most common (51%) was from over 10 million VND to 15 million VND/year, 26% was under 10 million VND/year and then over 15 million VND/year.
2.2.3.3. For tourism businesses
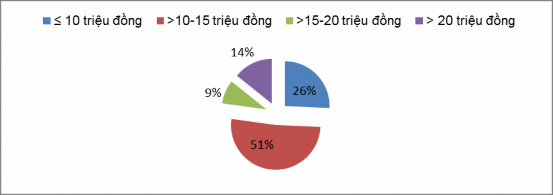
Among tourism enterprises, 40% do not carry out activities to develop human resources, 60% of enterprises carrying out activities to develop human resources are mostly enterprises with large investment capital and number of employees. 26% of enterprises with activities to foster and train human resources on-site have spent an average of 1 to 3 million VND, 20% have spent from 3 to 5 million VND for a tourism employee. The remaining enterprises only spend less than 1 million VND or more than 5 million VND for developing human resources.
Chart 2.11. Investment rate per tourism employee in tourism businesses in 2013
(Source: Author's survey results in 2013)
2.2.4. Investment capital coefficient for tourism human resource development on tourism income in the period 2006 - 2013
For public tourism infrastructure, in the period 2006-2013, on average, for every 1 VND of tourism revenue generated, 0.105 VND of investment capital had to be spent on human resources, of which domestic investment capital was 0.08 VND and foreign investment capital was 0.025 VND. This coefficient has tended to decrease in recent years, showing that investment efficiency has been improved.
As for the ratio of domestic investment capital to tourism income, the average for the whole period decreased by 6.8%. This decrease means that labor productivity