b. Effect of temperature
To evaluate the effect of temperature, we conducted hydrothermal treatment of precursor solution (with Ti and Fe concentrations of 2.46 g/L and 0.57 g/L, respectively), solution pH was 5, GNP content used was 20 mg, at different temperatures including 100 o C, 120 o C, 150 o C, 180 o C and 200 o for 8 hours. The product after hydrothermal treatment (TFG20) was analyzed by XRD spectrum to determine crystallinity, particle size and photocatalytic activity of Cr(VI) conversion.
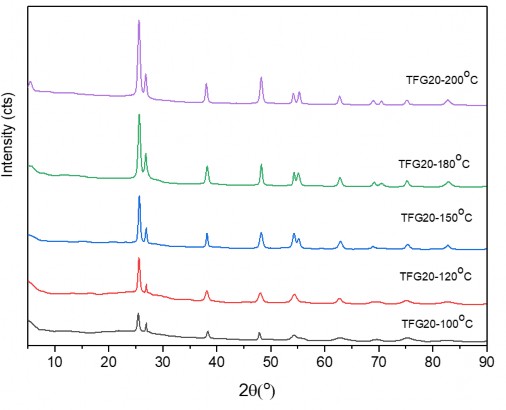
Figure 3.21. XRD patterns of hydrothermal TFG20 samples at different temperatures
Table 3.5. Effect of hydrothermal temperature on grain size
STT
Model name | The characteristic pic position has highest intensity ( o ) | FWHM ( o ) | Medium size average (nm) | |
1 | TFG20-100 | 25.55 | 0.54 | 14.9 |
2 | TFG20-120 | 25.67 | 0.53 | 15.2 |
3 | TFG20-150 | 25.63 | 0.51 | 15.8 |
Maybe you are interested!
-
 Xrd Diagrams Of Samples A) Balla-Tx And B) Balfe-Tx Prepared At Temperature
 -
 Illustration of Linkage Forms of Textile and Garment Enterprises in Textile and Garment Industry in China
 -
 Measurement and Remote Control – Electrical Engineering Industry - 8
 -
 Solutions for Developing Supporting Industries in the Electronics Industry
 -
 Business Results of Quang Binh Tourism Industry in the Period 2014 - 2019
4
TFG20-180 | 25.65 | 0.42 | 19.2 | |
5 | TFG20-200 | 25.55 | 0.38 | 21.2 |
The results in Figure 3.21 and Table 3.2 show that during the same hydrothermal time, when the hydrothermal temperature increases, the crystallinity of the particles also increases, as shown by the gradual increase in the intensity of the characteristic peak for the anatase phase, but the particle size of the product also increases (this can be observed visually by the increase in the half-width of the characteristic peak). The change in particle size of the hydrothermal product samples as above can be explained by the effect of temperature on the crystal nucleation process. Specifically, at low temperatures, the nucleation process of 2-oxide crystals on the GNP base occurs more smoothly, so the particles grow slowly and thus the average size of the particles is smaller. When hydrothermal treatment is performed at high temperatures, the nucleation process and the growth of the nuclei occur faster, causing the particles to tend to aggregate, making the particles larger in size.
At 100 o C, the hydrothermal product also formed the anatase phase, but the characteristic peaks were not yet clearly visible. When the hydrothermal temperature increased to 150 o C, the peaks appeared clearly. From 100 o C to 150 o C, we saw that the change in grain size was almost negligible, which can be explained by the fact that the crystal grains had reached the size limit. When the hydrothermal temperature was above 150 o C, the grain size of the material became larger and there was a stronger increase in size.
Thus, the temperature greatly affects the size and crystallinity of the TiO 2 - Fe 2 O 3 /GNP composite material sample. Increasing the hydrothermal temperature increases the crystallinity of the composite material, but the particle size of the material also increases. To determine the optimal hydrothermal temperature, the photocatalytic activity of the material is determined. The photocatalytic activity of the material is shown in the ability to convert Cr (VI), the conversion efficiency after 90 minutes is shown in the graph in Figure 3.22.
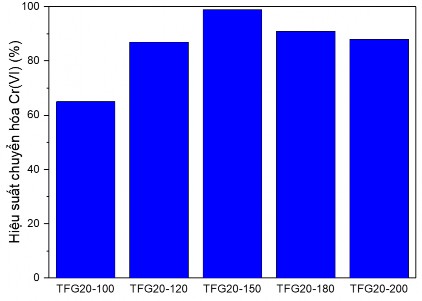
Figure 3.22. Graph determining the influence of hydrothermal temperature on the Cr(VI) conversion capacity of TFG20 samples
Through the Cr(VI) conversion efficiency graph in Figure 3.18, it can be seen that among the TFG materials, the material hydrothermally treated at 150 o C has the highest photocatalytic activity, reaching 99% after 90 minutes, the material sample with the lowest activity is the sample hydrothermally treated at 100 o C, although the TFG20-100 sample has the smallest particle size. This can be explained by the low crystallinity of the TFG20-100 sample, so there are still many components with amorphous phase structure in the structure and therefore a part of the hydrothermal product at 100 o C does not have photocatalytic activity. Meanwhile, in the samples with high hydrothermal temperatures, although the crystallinity is higher than the hydrothermal sample at 150 o C, the photocatalytic activity is not as high. This can also be explained by the fact that the hydrothermal sample at high temperature has a larger average crystal size and the crystallization process carried out at high temperature causes many defects in the network structure of the material, reducing the photocatalytic activity.
c. Effect of pH of hydrothermal process
The effect of pH of hydrothermal solution was evaluated based on experiments conducted under the same temperature conditions (150 o C), time
hydrothermal (8 hours) and GNP content (20 mg), only differing in the hydrothermal solution environment. The products after hydrothermal treatment were subjected to XRD, BET surface area, band gap energy through UV-VIS DRS and photocatalytic activity was determined through the Cr(VI) conversion process with a treatment time of 90 minutes.
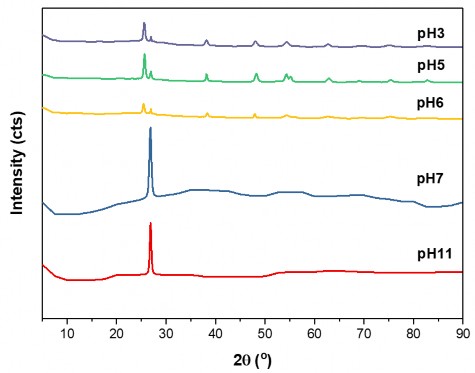
Figure 3.23. XRD patterns of hydrothermal TFG20 samples in pH3, pH5, pH6, pH7 and pH11 environments
The phase structure of TFG20 material after hydrothermal conditions at pH5, pH7 and pH11 is shown in the XRD diagram in Figure 3.23. In Figure 3.23, it can be seen that TFG20 hydrothermal material at pH7 and pH11 only has a characteristic peak of graphene at 2θ = 26.85 o , in addition, there are no characteristic peaks of 2 oxides like the TFG hydrothermal sample in acidic environment (pH3, pH5 and pH6). When pH increases, the crystallinity decreases because when pH increases, the H + concentration increases, increasing the competition between H + and oxide ions, reducing the ability to contact between metal ions and the negatively charged GNP matrix. But when pH exceeds 5, the crystallinity also decreases, possibly because the environment is almost neutral, the TiO 2 crystal phase is created less.
The surface area determined by the N 2 adsorption isothermal process of the TFG20 hydrothermal sample in pH7 and pH11 environment was compared with the TFG20 hydrothermal sample in the environmental environment, shown in Table 3.6. The results showed that the TFG20 hydrothermal composite material in pH7 and pH11 environment had a larger surface area than the hydrothermal samples in acidic environment, which can be explained by the amorphous structure of the two Fe and Ti oxides formed on the GNP matrix.
Table 3.6. Surface area of two hydrothermal TFG20 samples in different environments
STT
Sample | BET surface area (m 2 /g) | Pore volume (cm 3 /g) | Pore size (nm) | |
1 | TFG20-pH7 | 138.0 | 0.051 | 2,143 |
2 | TFG20-pH11 | 137.6 | 0.060 | 2,180 |
3 | TFG 20-pH6 | 111.4 | 0.881 | 2,706 |
4 | TFG 20-pH5 | 133.4 | 0.106 | 2,886 |
5 | TFG 20-pH5 | 125.4 | 0.913 | 2,786 |
The band gap energy of TFG20 hydrothermal material in different environments was determined through UV-VIS DRS spectrum and Kubela-Munk function, shown in Figure 3.24.

Figure 3.24. Comparison of band gap energy of hydrothermal TFG20 material in different environments: pH11(a), pH7(b), pH5(c)
Through the Tauc-plot graph, it can be seen that the band gap energy of the hydrothermal TFG20 material in pH11 environment has the smallest value (E bg = 2.13eV), the band gap energy of the hydrothermal sample in pH5 has the highest value of 2.87 eV. All three hydrothermal TFG20 samples in different environments have band gap energy values smaller than the band gap energy of pure TiO 2 (with anatase E bg = 3.2 eV, rutile is 3 eV).
To evaluate the photocatalytic activity of TFG20 hydrothermal materials in different environments, Cr(VI) conversion reactions were conducted and the Cr(VI) conversion efficiency of the samples was determined after 90 minutes of treatment. The results are shown in graph 3.25.
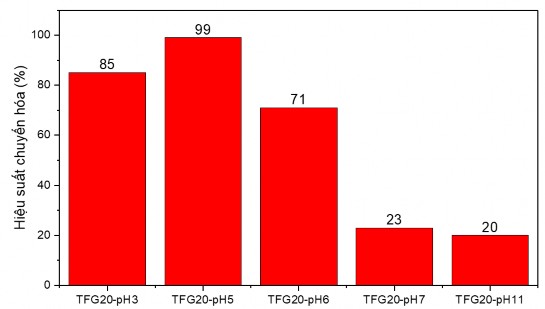
Figure 3.25. Comparison chart of Cr (VI) conversion capacity of hydrothermal TFG materials in different environments
The results of the Cr(VI) conversion test showed that both TFG20-pH7 and TFG20-pH11 materials had weak photocatalytic activity. This was attributed to the amorphous structure of the TiO 2 - Fe 2 O 3 nanoparticles on the GNP substrate. The amorphous structure of TiO 2 makes the material, although having a low band gap energy, has a fast recombination ability, so the photocatalytic activity of
The hydrothermal TGF20 material in pH7 and pH11 environments was worse than the hydrothermal sample in acidic environment. Among the samples synthesized in acidic environment, the sample synthesized at pH5 had the highest conversion efficiency, which was explained by the highest crystallinity at pH5. Thus, the optimal environment for the synthesis of TiO 2 - Fe 2 O 3 photocatalytic materials on GNP platform was at pH5.
d. Effect of stirring factor
The effect of the stirring process was investigated by comparing two TFG 20 samples synthesized under the same conditions of temperature, hydrothermal time and GNP content, in acidic medium, differing in the presence or absence of a stirring element during the hydrothermal process (the selected stirring speed was 1000 rpm). The obtained TFG material samples were measured by XRD and the photocatalytic activity was determined by the Cr(VI) conversion process. The XRD results of the two TFG20 samples are summarized in Figure 3.26 and Table 3.7.
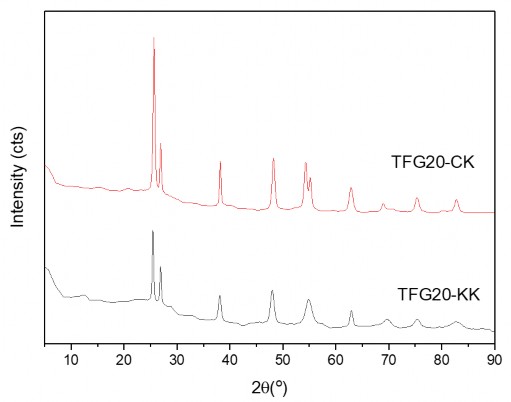
Figure 3.26. XRD spectrum of TFG composites with and without the presence of stirring elements
Table 3.7. Effect of mixing factors on particle size
STT
Model name | The characteristic pic position has highest intensity ( o ) | FWHM ( o ) | Medium size average (nm) | |
1 | TFG20-CK | 25.63 | 0.51 | 15.8 |
2 | TFG20-KK | 25.45 | 0.3 | 27.3 |
The results showed that the stirring factor affects the crystal formation process of oxides on the GNP substrate, making the size of the obtained crystal grains smaller and the crystallinity of the TFG material with stirring is also higher than when there is no stirring factor involved. This is explained because when there is stirring, the crystal seeds will be evenly dispersed on the surface of the GNP substrates and thanks to that, the crystal grains will grow evenly. When there is no stirring, the crystal grains tend to agglomerate on the GNP substrate, forming larger and less uniform grains.
To evaluate the photocatalytic activity, the Cr(VI) conversion efficiency of the material was determined and compared with the TFG20 sample with and without stirring, the survey time was 90 min.
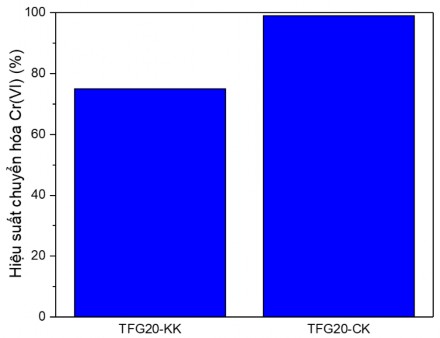
Figure 3.27. Graph evaluating the influence of stirring factor on the Cr(VI) conversion capacity of TFG material


