In addition, the existing empirical evidence suggests both directions of impact. Some authors find that foreign ownership can help increase the performance of banks while other studies note a negative correlation between foreign ownership and performance.
CHAPTER 3: CURRENT STATE OF OWNERSHIP STRUCTURE AND PERFORMANCE OF VIETNAM'S BANKING INDUSTRY
3.1. Overview of the banking industry in Southeast Asian countries
Vietnam and regional banking sector index
200
180
160
140
120
100
80
60
40
20
0
Vietnam
Asia Pacific
The next section focuses on an overview of the banking sector in a number of Southeast Asian countries. This analysis will help to identify a partial picture of the overall outlook for the banking sector in the region. Figure 3.1 shows the evolution of the Vietnam banking sector index as calculated by Thomson Reuters in correlation with the banking sector index of the Asia-Pacific region. Note that the indices are calculated in each country's currency, except for the regional index which is calculated on a USD basis.
4/1/2012
6/1/2012
8/1/2012
10/1/2012
12/1/2012
2/1/2013
4/1/2013
6/1/2013
8/1/2013
10/1/2013
12/1/2013
2/1/2014
4/1/2014
6/1/2014
8/1/2014
10/1/2014
12/1/2014
2/1/2015
4/1/2015
6/1/2015
8/1/2015
10/1/2015
12/1/2015
2/1/2016
4/1/2016
6/1/2016
8/1/2016
10/1/2016
Source: Thomson Reuters Datastream
Figure 3.1 Vietnam and regional banking sector index
Looking at Figure 3.1, it can be seen that the performance of the Vietnamese banking sector index is quite similar to the regional index. Vietnam only formed this index in January 2012. It can be seen that after its formation, this index continuously decreased in the period 2012-2014, reflecting the difficulties that the banking sector faced due to the economic recession. However, since 2015, this index has tended to increase again although there are still many fluctuations. This shows the improvements in the operational efficiency of the banking sector in recent times. Figure 3.2 illustrates
Developments in banking sector index of Southeast Asian countries
and the Asia Pacific region
1000
900
800
700
600
500
400
300
200
100
0
Philippines
Indonesia
Malaysia
Thailand
Asia Pacific
describes the evolution of the banking sector index in some other countries in the region, including Thailand, Malaysia, Indonesia and the Philippines. While the sector indexes of the Philippines and Indonesia have tended to increase, those of Malaysia and Thailand have tended to decrease slightly. However, in general, the banking indices in these countries have developed quite similarly to the regional index.
4/1/2012
6/1/2012
8/1/2012
10/1/2012
12/1/2012
2/1/2013
4/1/2013
6/1/2013
8/1/2013
10/1/2013
12/1/2013
2/1/2014
4/1/2014
6/1/2014
8/1/2014
10/1/2014
12/1/2014
2/1/2015
4/1/2015
6/1/2015
8/1/2015
10/1/2015
12/1/2015
2/1/2016
4/1/2016
6/1/2016
8/1/2016
10/1/2016
Source: Thomson Reuters Datastream
Figure 3.2 Banking sector index of Southeast Asian countries and the region
Figure 3.3 provides information on the total asset size in 2015 of the banking system of Vietnam and some other countries. Compared to other countries in the region, the total asset size of Vietnamese banks is still low, only higher than the Philippines in Southeast Asia. Meanwhile, according to Figure 3.4, the bad debt ratio in the whole system is at the highest level compared to other countries such as Thailand, Malaysia, the Philippines and Indonesia. Specifically, the bad debt ratio of other countries in the region is lower than 2% while in Vietnam this ratio is at 3%.
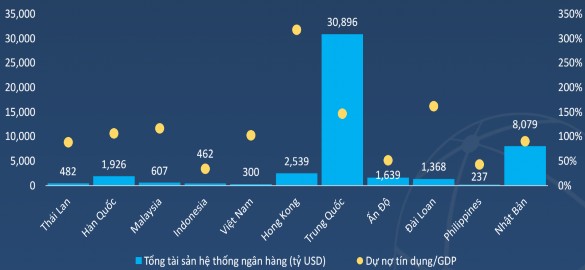
Source: Business Monitor International
Figure 3.3 Total assets of banking systems in countries
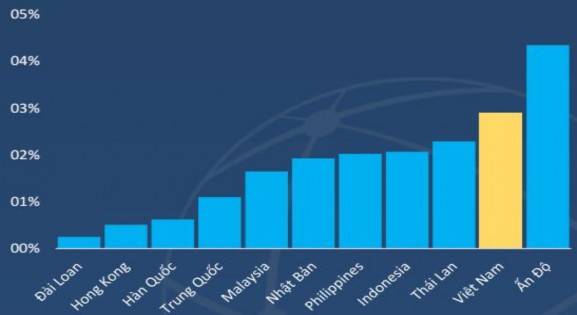
Source: World Bank
Figure 3.4 Bad debt ratio of banking system in countries
Figure 3.5 provides an overview of the profitability of the banking system in countries in the region, including Vietnam, when considering profitability indicators such as return on total assets and return on equity.
on equity. It can be seen that in terms of both of these indicators, Vietnamese banks are lower than other countries in the region when the return on total assets is maintained at 0.4% and the return on equity is approximately 5%.
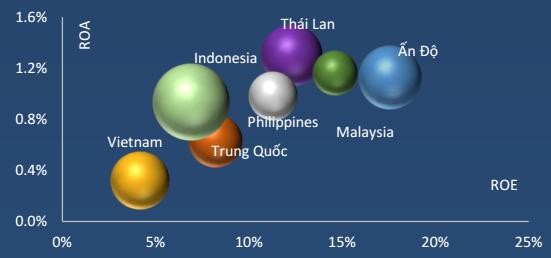
Source: Bloomberg
Figure 3.5 Profitability of banking systems in different countries
In the analysis report on the prospects of the banking industry in the Asia-Pacific region by Vinayak and colleagues (2016), the analysis shows that although the conditions in each country have their own characteristics, the banking industry in each country will soon face three pressures that can affect the profitability and growth potential of the industry. The first is the pressure from the slowing growth rate of the global economy in general and the region in particular. This causes the profit growth rate of the banking industry in the region to be forecasted to decrease from 10% in the period 2011-2014 to 3% in the period 2016-2021. The second is the appearance of businesses outside the industry participating in providing financial services, especially startups. Second is the pressure from bad debts in the system, which is a consequence of the global economic crisis and the lack of compliance with system safety regulations. Thus, it can be seen that with the current challenges, restructuring the banking system is an urgent need in countries in the region in general and in Vietnam in particular. The next section will delve into an overview of the industry.
Bank of Vietnam
3.2. Current status of ownership structure and operational efficiency of Vietnam's banking system
3.2.1. Overview of Vietnam Banking System Operations
3.2.1.1. About scale
According to statistics of the State Bank in Table 3.1, as of June 30, 2016, the total assets of the entire credit institution system reached 7.8 million billion VND, continuously increasing in recent months and increasing by 549 thousand billion VND (equivalent to an increase of 7.5%) compared to the end of 2015.
Table 3.1 Size of credit institutions as of June 2016
Unit: Billion VND
Type of credit institution | Total assets | Equity | Charter capital | Minimum capital adequacy ratio | Short-term capital to medium-term lending ratio long term | |||
+/- | % | +/- | % | +/- | % | |||
(1) | (2) | (3) | (4) | (5) | (6) | (7) | (8) | (9) |
Bank State Trade | 3,522,520 | 6.61 | 212,868 | 4.69 | 137,120 | 0.02 | 9.32 | 33.41 |
Policy Bank society | 154,368 | 7.05 | 10,696 | 0.00 | ||||
Commercial Bank Share | 3,154,574 | 7.73 | 244,634 | 3.51 | 196,466 | 1.28 | 12.14 | 36.33 |
Bank Joint venture, foreign | 828,948 | 9.71 | 126,296 | 7.79 | 100,552 | 7.03 | 33.89 | |
Note: - Data source based on Accounting balance sheet report, statistical report June 2016. - State-owned commercial banks include: Vietnam Bank for Agriculture and Rural Development, Vietnam Joint Stock Commercial Bank for Industry and Trade, Vietnam Joint Stock Commercial Bank for Foreign Trade, Vietnam Joint Stock Commercial Bank for Investment and Development, Vietnam Construction Commercial Bank, Global Petroleum Commercial Bank, Ocean Commercial Bank; - Data in columns (4), (5), (8), (9) do not include the Social Policy Bank (not subject to reporting) and People's Credit Funds; - Equity capital, CAR ratio has eliminated credit institutions with negative Equity capital; - Total assets index is calculated according to Circular 49/2014/TT-NHNN. | ||||||||
Maybe you are interested!
-
 Current status of investment activities in bond trading of Vietnam Commercial Bank
 -
 Current status of credit risk at Saigon Thuong Tin Commercial Joint Stock Bank, Lam Dong branch - 1
 -
 Current Status of Credit Risk Management for Individual Customers at Vietnam Technological and Commercial Joint Stock Bank - Thai Nguyen Branch
 -
 Current Status of Lending Scale of Vietnam Technological and Commercial Joint Stock Bank
 -
 Current Status of Savings Deposits at Binh Phuoc Industrial and Commercial Bank
- The ratio of short-term capital for medium and long-term loans of the Joint Venture and Foreign Banking Block is invalid because this block does not use short-term capital for medium and long-term loans.
Source: http://www.sbv.gov.vn |
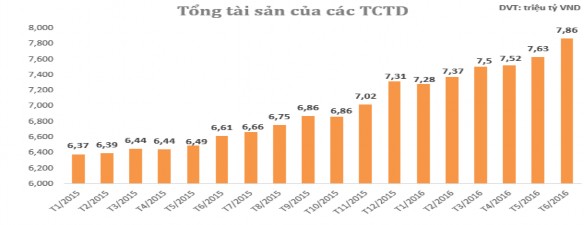
Figure 3.6 Asset size of Vietnamese credit institutions from January 2015 to June 2016
According to Figure 3.6, in June, the assets of all remaining sectors increased quite strongly. In which, the highest increase was in the State-owned commercial banking sector when in June, the total assets of this sector increased by 116 trillion VND to 3.52 trillion VND.
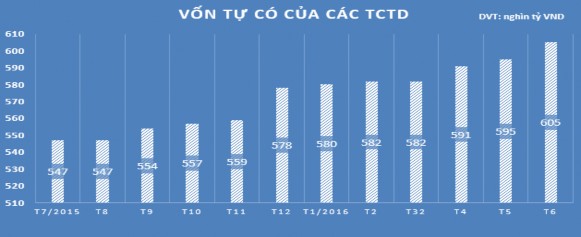
Figure 3.7 Equity capital of credit institutions from July 2015 to June 2016
Coming in second is the joint stock commercial banking sector, with total assets also increasing by VND99.8 trillion to VND3.1 trillion. Next is the joint venture - foreign banking sector, with an increase of VND15 trillion to VND829 trillion.
In addition to total assets, the equity capital of the entire system also maintained its growth momentum. By the end of June, the equity capital of the entire system reached 605.8 trillion VND, an increase of 27 trillion VND (equivalent to an increase of 4.81%) compared to the end of 2015.
In June 2016, equity capital of all sectors increased. Of which, equity capital of State-owned commercial banks increased sharply by 5.6 trillion VND to 212 trillion VND; joint stock commercial banks increased by 4.4 trillion VND to 244 trillion VND; joint venture and foreign banks increased by 395 billion VND to 126 trillion VND.
However, the charter capital of the entire system decreased slightly by 161 billion VND to
469.7 trillion VND in June. However, compared to the end of 2015, the charter capital of the entire system still increased by 9.4 trillion VND (equivalent to an increase of 2.05%).
The reason for the decrease in charter capital of the entire system in June was that the charter capital of the joint venture - foreign banks decreased by VND214 billion. However, the charter capital of the State commercial banks increased by VND23 billion; the charter capital of the people's credit fund system increased by VND32 billion.
In terms of absolute value, the joint stock commercial bank sector is also leading in charter capital with 196 trillion VND; followed by the state-owned commercial bank sector with 137 trillion VND; third is the joint venture and foreign bank sector with 100 trillion VND.
3.2.1.2. On operational efficiency
According to statistics from the State Bank up to the end of the first quarter of 2016 shown in Table 3.2, the group of state-owned commercial banks is the group with the highest operating efficiency with high return on total assets and return on equity ratios that are superior to other groups.
Table 3.2 Statistics of profitability ratios by credit institution group