LIST OF TABLES
Table 1.1.
Board Main ARV drugs and mechanism of action | Page 8 | |
Table 1.2. | Mutations with NRTI group and resistance effects with other | |
ARV drugs in the group | 10 | |
Table 1.3. Table 1.4. | Mutations with NNRTI group and ARV drug resistance Mutations to PIs and resistance to drugs | 11 |
ARV | 11 | |
Table 1.5. | Early warning indicators of HIV drug resistance as recommended | |
WHO report | 16 | |
Table 1.6. | Distribution of HIV treatment facilities according to EWIs results | |
WHO recommendations by region, 2004-2009 | 17 | |
Table 1.7. | Prevalence of HIV drug resistance before starting treatment ARV in WHO surveys, 2007-2010 | 21 |
Table 1.8. | Acquired drug-resistant HIV status at the time of treatment completion | |
end | 23 | |
Table 1.9. | Distribution of HIV drug-resistant mutations in non-HIV individuals achieved HIV suppression after 12 months of ARV treatment, | |
by region and drug group | 24 | |
Table 2.1. | Number of medical records and drug inventory reports collected | |
Decimals for each index by year | 36 | |
Table 2.2. | How to calculate early warning indicators for HIV drug resistance | 39 |
Table 3.1. | Number of patients collected for each early warning indicator | |
HIV drug resistance by year | 57 | |
Table 3.2. | Rate of patients dropping out of treatment after 12 months of ARV treatment (EWI 2) over the years | 59 |
Table 3.3. | Proportion of patients maintaining first-line ARV regimen at time point | |
12 months after first-line ARV treatment over the years | 60 | |
Table 3.4. Table 3.5. | Rate of patients returning for follow-up visits on time over the years Summary of clinics with HIV early warning indicators | 61 |
Drug resistance did not meet WHO 2010 target | 62 | |
Table 3.6. | Summary of clinics with HIV early warning indicators | |
Table 3.7. | Drug resistance did not meet WHO target in 2011 Summary of clinics with HIV early warning indicators | 63 |
Drug resistance did not meet WHO target in 2012 | 63 |
Maybe you are interested!
-
 Description of the Current Situation of Early Warning of HIV Drug Resistance at Treatment Facilities
 -
 HIV Drug Resistance Surveillance and Prevention Situation in the World
 -
 Current status of HIV infection, AFB + tuberculosis and evaluation of preventive intervention effectiveness among drug addicts in Dak Lak province - 1
 -
 Risk of HIV infection and effectiveness of preventive intervention among drug addicts in Quang Nam - 1
 -
 Study on microbiological characteristics of foot ulcers in diabetic patients at the Department of Endocrinology - Diabetes, Bach Mai Hospital in 2021 - 11
Results of early warning of HIV drug resistance in 4 clinical laboratories currently monitoring HIV drug resistance | 64 | |
Table 3.9. | Demographic characteristics of patients with HIV drug resistance | 66 |
Table 3.10. | Clinical and immunological characteristics of the patient at the time of | |
T1 | 67 | |
Table 3.11. | Tuberculosis treatment at T1 | 68 |
Table 3.12. | History of ARV treatment | 68 |
Table 3.13. | Distribution of ARV treatment regimens at time T1 | 69 |
Table 3.14. | HIV viral load at T1 | 69 |
Table 3.15. | Clinical stage at T2 | 71 |
Table 3.16. | CD4 cell classification at T2 | 71 |
Table 3.17. | Distribution of ARV treatment regimens at time T2 | 73 |
Table 3.18. | Re-examination status between T1 and T2 | 73 |
Table 3.19. | Adherence level in terms of the number of ARV pills taken during the | |
within 30 days prior to the end of the study at the | ||
PKNT | 74 | |
Table 3.20. | Distribution of patients with HIV drug-resistant mutations at T1 | 75 |
Table 3.21. | Demographic, immunological and HIV viral load characteristics of patients | |
HIV drug-resistant mutations at T1 | 76 | |
Table 3.22. | HIV drug-resistant mutations and susceptibility to drugs | |
ARV drugs in patients with drug-resistant HIV mutations | ||
at time T1 | 77 | |
Table 3.23. | Total number of patients assessed for HIV status | |
drug resistance at T2 | 79 | |
Table 3.24. | Summary of patients with HIVKT mutations at T1 and T2 | 81 |
Table 3.25. | Some characteristics of patients with HIV resistance mutations | |
drugs at T1 and achieved HIV drug resistance prevention at T2 | 82 | |
Table 3.26. | Some characteristics of patients with HIV-resistant mutations | |
medicine at T2 | 84 | |
Table 3.27. | Predicting the level of ARV drug resistance of mutations | |
HIV drug resistance at time T | 87 | |
Table 3.28. | Factors associated with HIV drug resistance mutations at T1 | 88 |
Table 3.29. | Factors associated with cumulative HIVKT mutations at T2 | 89 |
Table 3.30. | Factors associated with new HIVKT mutations at T2 | 90 |
LIST OF CHARTS, DIAGRAMS AND FIGURES
Figure 1.1.
Charts, diagrams and figures Change in survival rate (%) in HIV-infected people over 25 | Page | |
year old | 4 | |
Figure 1.2. | HIV replication cycle | 6 |
Chart 1.1. | Distribution of HIV drug-resistant mutations in the population HIV infection before ARV treatment, 2007 – 2010 | 20 |
Chart 1.2. | Number of patients treated with ARV over the years | 27 |
Diagram 2.1. | Flowchart of HIV drug resistance monitoring study implementation | 50 |
Diagram 2.2. | Schematic diagram of sampling, transportation and sample handling in the study | |
rescue | 53 | |
Figure 2.1. | Methods for determining the level of resistance to ARV drugs | 54 |
Chart 3.1. Chart 3.2. | EWI 1 Prescribing Practice Index Results Rate of PKNT with treatment dropout index after 12 months of treatment | 58 |
ARV (EWI 2) achieves WHO target over the years | 59 | |
Chart 3.3. | Rate of PKNT with patient index maintaining ARV regimen | |
Level 1 (EWI 3) achieved WHO target over the years | 60 | |
Chart 3.4. | Rate of PKNT with index of patients returning for follow-up examination on time | 61 |
(EWI 4) achieved WHO target over the years. | ||
Diagram 3.1. | HIV drug resistance monitoring study flowchart | 70 |
Chart 3.5. Chart 3.6. | Changes in TCD4 cells between T1 and T2 HIV load distribution by clinic in | 72 |
T2 | 74 | |
Chart 3.7. | Mutation distribution in patients with HIV-resistant mutations | |
drug at time T1 | 78 | |
Chart 3.8. | HIV drug resistance indices at T2 | 80 |
Chart 3.9. | Distribution of patients with HIV drug-resistant mutations at T2 | 83 |
Chart 3.10. | Distribution of HIV drug-resistant mutations in the NRTI group | |
in patients with HIV drug-resistant mutations at T2 | 85 | |
Chart 3.11. | Mutation distribution in the NNRTI group | 86 |
PROBLEM STATEMENT
There is growing evidence of the effectiveness of ARV treatment in people with HIV. ARV treatment not only reduces mortality and morbidity in people with HIV but also reduces new HIV infections in the community [100]. In an effort to reduce the impact of the HIV epidemic, Vietnam began expanding its ARV treatment program in late 2005 and set a target of reaching 70% of people living with HIV who are eligible for treatment by 2015 (equivalent to 105,000 people) and 80% by 2020 (equivalent to 150,000 people) [15]. As ARV treatment coverage increases, the emergence and spread of HIV drug resistance is inevitable [87]. The emergence of drug-resistant HIV means that the ARV regimen that the patient is on fails and needs to be switched to another ARV regimen at a higher cost. In addition, the expansion of ARV treatment can lead to the emergence and spread of drug-resistant HIV due to poor treatment adherence, or treatment interruption due to intermittent ARV drug supply, or inadequate monitoring of drug-resistant HIV leading to limited effectiveness of ARV treatment [82], [26].
HIV drug resistance testing is expensive and not routinely performed in most resource-limited countries, including Vietnam. However, collecting early warning indicators of HIV drug resistance is low-cost, easy to implement, reflects HIV drug resistance prevention at both the program and treatment facility levels, and provides warnings about the risk of HIV drug resistance. In addition, the status of HIV drug resistance in patients on ARV treatment will provide evidence for interventions that need to be implemented at both the treatment facility and treatment program levels to maximize the effectiveness of ARV treatment.
Many countries around the world have conducted assessments on early warning of HIV drug resistance as well as monitoring the emergence of HIV drug resistance in the ARV patient population with the aim of monitoring the status of HIV drug resistance.
Vietnam has not had any studies reflecting the current status of early warning factors for HIV drug resistance, nor has there been any prospective study on the status of HIV drug resistance in patients since starting ARV treatment. Assessing the current status of HIV drug resistance and factors related to the emergence of HIV drug resistance is very important in developing appropriate strategies to expand effective ARV treatment programs.
Therefore, we conducted this study with the following two objectives:
1. Describe the current status of early warning of HIV drug resistance at HIV treatment facilities in
some provinces and cities 2010 - 2012.
2. Identify characteristics of HIV drug resistance and some related factors in patients receiving first-line ARV treatment regimen at some treatment facilities.
Chapter 1
OVERVIEW
1.1. ARV treatment situation in the world
Highly active antiretroviral therapy (HAART) with a combination of three highly suppressive ARV drugs was recommended in 1996 [119]. HAART not only prolongs the lives of people living with HIV but also reduces the risk of HIV transmission from HIV-infected people to others, especially through sexual contact [32]. By the end of 2012, approximately 1.6 million more people living with HIV in low- and middle-income countries had access to ARVs than at the end of 2011 [108]. This was the year with the highest number of people living with HIV accessing ARV treatment ever. In 2002, only about 300,000 people in low- and middle-income countries had access to ARV treatment, but by 2012, 9.7 million people living with HIV were receiving ARV treatment in these countries [108]. Africa is the region with the highest number of people living with HIV receiving ARV treatment – about 7.5 million.
The expansion of access to ARV treatment varies across regions. Africa remains the leading region in increasing the number of people living with HIV accessing ARV treatment. This region accounts for only 12% of the global population but accounts for 69% (65–73%, approximately 23.4 million people, ranging from 22 million to 24.7 million) of people living with HIV globally [108]. Eastern and Southern Africa account for 50% of all people living with HIV globally and had 6.4 million people receiving ARV treatment at the end of 2012. South Africa's ARV treatment programme is the largest in the world with approximately 2.2 million people receiving ARV treatment in 2012. Following South Africa, Zimbabwe and Kenya continued to be the countries with the fastest growth in the number of people living with HIV receiving ARV treatment in 2012 with 90,000 new people receiving ARV treatment in Zimbabwe and 65,000 in Kenya.
Asia is also the region with the highest number of people living with HIV receiving ARV treatment.
rapidly in recent years. At the end of 2012, there were 983,000 people infected with HIV on treatment.
ARV, an increase of about 100,000 people compared to 2011. India and Thailand are two countries that have contributed greatly to expanding access to ARV treatment in this region. The number of HIV-infected people receiving ARV treatment in China increased from 126,000 in 2011 to
154,000 people in 2012. Cambodia, which achieved 80% ARV treatment coverage in 2011, increased the number of people living with HIV receiving ARV treatment to about 50,000 in 2012. Other countries in the region, including Papua New Guinea and Vietnam, have also seen leaps in ARV treatment [108].
With the intensification of ARV treatment and increasingly better treatment regimens, survival rates in HIV-infected people have gradually increased. Figure 1.1 shows the change in reported survival rates in HIV-infected people in Denmark from 1995 to 2005 (Lohse N -2007) [62]. The earlier treatment is started, the more effective it is, although survival rates in HIV-infected people cannot be compared to those in uninfected people. On the other hand, as survival times are prolonged in people receiving ARV treatment, the side effects of the drugs become more and more pronounced.
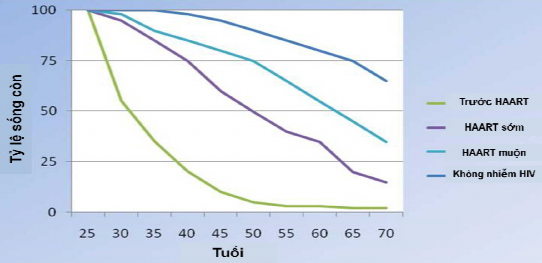
Figure 0.1. Change in survival rate (%) in HIV-infected people over 25 years old
*Source: according to Lohse N. (2007) [62]
As ARV treatment is expanded, the emergence of drug-resistant HIV (DRHIV) is inevitable [87]. This situation also appears in
cases treated with standard HIV antiretroviral regimens and patients with good treatment adherence [57].
1.2. Overview of HIV and HIV drug resistance
1.2.1. Overview of HIV
HIV, the causative agent of acquired immunodeficiency syndrome (AIDS), is a retrovirus of the Lentivirus family. HIV has RNA as its genetic material, and during replication, it must undergo an intermediate stage of molecular transcription from RNA to double-stranded DNA by the HIV reverse transcriptase (RT). Due to this characteristic as well as the rapid replication rate, HIV has a high rate of gene mutation and genetic diversity. There are two types of HIV-1 and HIV-2, of which HIV-1 is the most common pathogen worldwide, including Vietnam. HIV-2, which mainly circulates in African countries, is less common and has lower virulence, the transition time from virus infection to the disease stage is longer, but still has clinical manifestations in the AIDS stage like HIV-1[17]. HIV-1 and HIV-2 are retroviruses of the Retroviridae family, Lentivirus tribe . These are enveloped viruses (outer peplon and inner capsid), the core of which contains two single-stranded RNA molecules that are the HIV genome, capable of integrating into the host cell's DNA. This makes it very difficult for the host to clear the virus, as the proviral genome can survive without being detected by the immune system and avoid the effects of antiviral agents. The complete virus is spherical in shape with a diameter of 80-120 nm.
HIV replication cycle:
Cell entry: HIV can only replicate inside human cells. This process begins when the virus particle encounters a cell that has the CD4 marker on its surface (called a CD4 + T cell ). Spikes on the surface of the virus particle attach to CD4, with the help of the co-receptors CXCR4 and CCR5, and allow the viral envelope to fuse with the cell membrane.