The limitation is due to the lack of linkage and product consumption contracts with buyers, mainly sold in traditional markets, leading to low selling prices, which is an obstacle in the production of safe vegetables. Table 3.21. Prices of safe vegetables and regular vegetables in Thua Thien Hue province
Unit: VND/kg
Vegetables
Safe vegetables | Common vegetables | RAT/regular vegetables (Times) | |
1. Vegetables | 8,000 | 7,000 | 1.14 |
2. Gotu kola | 7,000 | 6,500 | 1.08 |
3. Green onions | 14,800 | 14,000 | 1.05 |
4. Bitter melon | 18,000 | 15,000 | 1.27 |
5. Malabar spinach | 9,000 | 8,000 | 1.13 |
Maybe you are interested!
-
 Sustainable Development Perspectives of Safe Vegetables in Hanoi
 -
 Production and supply of clean vegetables in Van Duc commune, Gia Lam district, Hanoi - 7
 -
 Production and supply of clean vegetables in Van Duc commune, Gia Lam district, Hanoi - 1
 -
 Production and supply of clean vegetables in Van Duc commune, Gia Lam district, Hanoi - 3
 -
 Solutions for tourism development in Tien Lang - 10
zt2i3t4l5ee
zt2a3gstourism, tourism development
zt2a3ge
zc2o3n4t5e6n7ts
- District People's Committees and authorities of communes with tourist attractions should support, promote, and provide necessary information to people, helping them improve their knowledge about tourism. Raise tourism awareness for local people.
*
* *
Due to limited knowledge and research time, the thesis inevitably has shortcomings. Therefore, I look forward to receiving guidance from teachers, experts as well as your comments to make the thesis more complete.
Chapter III Conclusion
Through the issues presented in Chapter II, we can come to some conclusions:
Based on the strengths of available tourism resources, the types of tourism in Tien Lang that need to be promoted in the coming time are sightseeing and resort tourism, discovery tourism, weekend tourism. To improve the quality and diversify tourism products, Tien Lang district needs to combine with local cultural tourism resources, at the same time combine with surrounding areas, build rich tourism products. The strengths of Tien Lang tourism are eco-tourism and cultural tourism, so developing Tien Lang tourism must always go hand in hand with restoring and preserving types of cultural tourism resources. Some necessary measures to support and improve the efficiency of exploiting tourism resources in Tien Lang are: strengthening the construction of technical facilities and labor force serving tourism, actively promoting and advertising tourism, and expanding forms of capital mobilization for tourism development.
CONCLUDE
I Conclusion
1. Based on the results achieved within the framework of the thesis's needs, some basic conclusions can be drawn as follows:
Tien Lang is a locality with great potential for tourism development. The relatively abundant cultural tourism resources and ecological tourism resources have great appeal to tourists. Based on this potential, Tien Lang can build a unique tourism industry that is competitive enough with other localities within Hai Phong city and neighboring areas.
In recent years, the exploitation of the advantages of resources to develop tourism and build tourist routes in Tien Lang has not been commensurate with the available potential. In terms of quantity, many resource objects have not been brought into the purpose of tourism development. In terms of time, the regular service time has not been extended to attract more visitors. Infrastructure and technical facilities are still weak. The labor force is still thin and weak in terms of expertise. Tourism programs and routes have not been organized properly, the exploitation content is still monotonous, so it has not attracted many visitors. Although resources have not been mobilized much for tourism development, they are facing the risk of destruction and degradation.
2. Based on the results of investigation, analysis, synthesis, evaluation and selective absorption of research results of related topics, the thesis has proposed a number of necessary solutions to improve the efficiency of exploiting tourism resources in Tien Lang such as: promoting the restoration and conservation of tourism resources, focusing on investment and key exploitation of ecotourism resources, strengthening the construction of infrastructure and tourism workforce. Expanding forms of capital mobilization. In addition, the thesis has built a number of tourist routes of Hai Phong in which Tien Lang tourism resources play an important role.
Exploiting Tien Lang tourism resources for tourism development is currently facing many difficulties. The above measures, if applied synchronously, will likely bring new prospects for the local tourism industry, contributing to making Tien Lang tourism an important economic sector in the district's economic structure.
REFERENCES
1. Nhuan Ha, Trinh Minh Hien, Tran Phuong, Hai Phong - Historical and cultural relics, Hai Phong Publishing House, 1993
2. Hai Phong City History Council, Hai Phong Gazetteer, Hai Phong Publishing House, 1990.
3. Hai Phong City History Council, History of Tien Lang District Party Committee, Hai Phong Publishing House, 1990.
4. Hai Phong City History Council, University of Social Sciences and Humanities, VNU, Hai Phong Place Names Encyclopedia, Hai Phong Publishing House. 2001.
5. Law on Cultural Heritage and documents guiding its implementation, National Political Publishing House, Hanoi, 2003.
6. Tran Duc Thanh, Lecture on Tourism Geography, Faculty of Tourism, University of Social Sciences and Humanities, VNU, 2006
7. Hai Phong Center for Social Sciences and Humanities, Some typical cultural heritages of Hai Phong, Hai Phong Publishing House, 2001
8. Nguyen Ngoc Thao (editor-in-chief, Tourism Geography, Hai Phong Publishing House, two volumes (2001-2002)
9. Nguyen Minh Tue and group of authors, Hai Phong Tourism Geography, Ho Chi Minh City Publishing House, 1997.
10. Nguyen Thanh Son, Hai Phong Tourism Territory Organization, Associate Doctoral Thesis in Geological Geography, Hanoi, 1996.
11. Decision No. 2033/QD – UB on detailed planning of Tien Lang town, Hai Phong city until 2020.
12. Department of Culture, Information, Hai Phong Museum, Hai Phong relics
- National ranked scenic spot, Hai Phong Publishing House, 2005. 13. Tien Lang District People's Committee, Economic Development Planning -
Culture - Society of Tien Lang district to 2010.
14.Website www.HaiPhong.gov.vn
APPENDIX 1
List of national ranked monuments
STT
Name of the monument
Number, year of decisiondetermine
Location
1
Gam Temple
938 VH/QĐ04/08/1992
Cam Khe Village- Toan Thang commune
2
Doc Hau Temple
9381 VH/QĐ04/08/1992
Doc Hau Village –Toan Thang commune
3
Cuu Doi Communal House
3207 VH/QĐDecember 30, 1991
Zone II of townTien Lang
4
Ha Dai Temple
938 VH/QĐ04/08/1992
Ha Dai Village –Tien Thanh commune
APPENDIX II
STT
Name of the monument
Number, year of decision
Location
1
Phu Ke Pagoda Temple
178/QD-UBJanuary 28, 2005
Zone 1 - townTien Lang
2
Trung Lang Temple
178/QD-UBJanuary 28, 2005
Zone 4 – townTien Lang
3
Bao Khanh Pagoda
1900/QD-UBAugust 24, 2006
Nam Tu Village -Kien Thiet commune
4
Bach Da Pagoda
1792/QD-UB11/11/2002
Hung Thang Commune
5
Ngoc Dong Temple
177/QD-UBNovember 27, 2005
Tien Thanh Commune
6
Tomb of Minister TSNhu Van Lan
2848/QD-UBSeptember 19, 2003
Nam Tu Village -Kien Thiet commune
7
Canh Son Stone Temple
2160/QD-UBSeptember 19, 2003
Van Doi Commune –Doan Lap
8
Meiji Temple
2259/QD-UBSeptember 19, 2002
Toan Thang Commune
9
Tien Doi Noi Temple
477/QD-UBSeptember 19, 2005
Doan Lap Commune
10
Tu Doi Temple
177/QD-UBJanuary 28, 2005
Doan Lap Commune
11
Duyen Lao Temple
177/QD-UBJanuary 28, 2005
Tien Minh Commune
12
Dinh Xuan Uc Pagoda
177/QD-UBJanuary 28, 2005
Bac Hung Commune
13
Chu Khe Pagoda
177/QD-UBJanuary 28, 2005
Hung Thang Commune
14
Dong Dinh
2848/QD-UBNovember 21, 2002
Vinh Quang Commune
15
President's Memorial HouseTon Duc Thang
177/QD-UBJanuary 28, 2005
NT Quy Cao
Ha Dai Temple
Ben Vua Temple
Tien Lang hot spring
div.maincontent .p { color: black; font-family:"Times New Roman", serif; font-style: normal; font-weight: normal; text-decoration: none; font-size: 14pt; margin:0pt; } div.maincontent p { color: black; font-family:"Times New Roman", serif; font-style: normal; font-weight: normal; text-decoration: none; font-size: 14pt; margin:0pt; } div.maincontent .s1 { color: black; font-family:"Times New Roman", serif; font-style: normal; font-weight: normal; font-size: 16pt; } div.maincontent .s2 { color: black; font-family:"Times New Roman", serif; font-style: italic; font-weight: bold; text-decoration: none; font-size: 14pt; } div.maincontent .s3 { color: black; font-family:"Times New Roman", serif; font-style: italic; font-weight: normal; text-decoration: none; font-size: 14pt; } div.maincontent .s4 { color: black; font-family:"Times New Roman", serif; font-style: normal; font-weight: normal; font-size: 14pt; } div.maincontent .s5 { color: black; font-family:"Times New Roman", serif; font-style: normal; font-weight: bold; font-size: 14pt; } div.maincontent .s6 { color: black; font-family:"Times New Roman", serif; font-style: normal; font-weight: normal; text-decoration: none; font-size: 14pt; } div.maincontent .s7 { color: black; font-family:"Times New Roman", serif; font-style: normal; font-weight: bold; text-decoration: none; font-size: 14pt; } div.maincontent .s8 { color: black; font-family:"Times New Roman", serif; font-style: normal; font-weight: normal; text-decoration: none; font-size: 9pt; vertical-align: 6pt; } div.maincontent .s9 { color: black; font-family:"Times New Roman", serif; font-style: normal; font-weight: bold; text-decoration: none; font-size: 12pt; } div.maincontent .s11 { color: black; font-family:"Times New Roman", serif; font-style: normal; font-weight: normal; tex
Solutions for tourism development in Tien Lang - 10
zt2i3t4l5ee
zt2a3gstourism, tourism development
zt2a3ge
zc2o3n4t5e6n7ts
- District People's Committees and authorities of communes with tourist attractions should support, promote, and provide necessary information to people, helping them improve their knowledge about tourism. Raise tourism awareness for local people.
*
* *
Due to limited knowledge and research time, the thesis inevitably has shortcomings. Therefore, I look forward to receiving guidance from teachers, experts as well as your comments to make the thesis more complete.
Chapter III Conclusion
Through the issues presented in Chapter II, we can come to some conclusions:
Based on the strengths of available tourism resources, the types of tourism in Tien Lang that need to be promoted in the coming time are sightseeing and resort tourism, discovery tourism, weekend tourism. To improve the quality and diversify tourism products, Tien Lang district needs to combine with local cultural tourism resources, at the same time combine with surrounding areas, build rich tourism products. The strengths of Tien Lang tourism are eco-tourism and cultural tourism, so developing Tien Lang tourism must always go hand in hand with restoring and preserving types of cultural tourism resources. Some necessary measures to support and improve the efficiency of exploiting tourism resources in Tien Lang are: strengthening the construction of technical facilities and labor force serving tourism, actively promoting and advertising tourism, and expanding forms of capital mobilization for tourism development.
CONCLUDE
I Conclusion
1. Based on the results achieved within the framework of the thesis's needs, some basic conclusions can be drawn as follows:
Tien Lang is a locality with great potential for tourism development. The relatively abundant cultural tourism resources and ecological tourism resources have great appeal to tourists. Based on this potential, Tien Lang can build a unique tourism industry that is competitive enough with other localities within Hai Phong city and neighboring areas.
In recent years, the exploitation of the advantages of resources to develop tourism and build tourist routes in Tien Lang has not been commensurate with the available potential. In terms of quantity, many resource objects have not been brought into the purpose of tourism development. In terms of time, the regular service time has not been extended to attract more visitors. Infrastructure and technical facilities are still weak. The labor force is still thin and weak in terms of expertise. Tourism programs and routes have not been organized properly, the exploitation content is still monotonous, so it has not attracted many visitors. Although resources have not been mobilized much for tourism development, they are facing the risk of destruction and degradation.
2. Based on the results of investigation, analysis, synthesis, evaluation and selective absorption of research results of related topics, the thesis has proposed a number of necessary solutions to improve the efficiency of exploiting tourism resources in Tien Lang such as: promoting the restoration and conservation of tourism resources, focusing on investment and key exploitation of ecotourism resources, strengthening the construction of infrastructure and tourism workforce. Expanding forms of capital mobilization. In addition, the thesis has built a number of tourist routes of Hai Phong in which Tien Lang tourism resources play an important role.
Exploiting Tien Lang tourism resources for tourism development is currently facing many difficulties. The above measures, if applied synchronously, will likely bring new prospects for the local tourism industry, contributing to making Tien Lang tourism an important economic sector in the district's economic structure.
REFERENCES
1. Nhuan Ha, Trinh Minh Hien, Tran Phuong, Hai Phong - Historical and cultural relics, Hai Phong Publishing House, 1993
2. Hai Phong City History Council, Hai Phong Gazetteer, Hai Phong Publishing House, 1990.
3. Hai Phong City History Council, History of Tien Lang District Party Committee, Hai Phong Publishing House, 1990.
4. Hai Phong City History Council, University of Social Sciences and Humanities, VNU, Hai Phong Place Names Encyclopedia, Hai Phong Publishing House. 2001.
5. Law on Cultural Heritage and documents guiding its implementation, National Political Publishing House, Hanoi, 2003.
6. Tran Duc Thanh, Lecture on Tourism Geography, Faculty of Tourism, University of Social Sciences and Humanities, VNU, 2006
7. Hai Phong Center for Social Sciences and Humanities, Some typical cultural heritages of Hai Phong, Hai Phong Publishing House, 2001
8. Nguyen Ngoc Thao (editor-in-chief, Tourism Geography, Hai Phong Publishing House, two volumes (2001-2002)
9. Nguyen Minh Tue and group of authors, Hai Phong Tourism Geography, Ho Chi Minh City Publishing House, 1997.
10. Nguyen Thanh Son, Hai Phong Tourism Territory Organization, Associate Doctoral Thesis in Geological Geography, Hanoi, 1996.
11. Decision No. 2033/QD – UB on detailed planning of Tien Lang town, Hai Phong city until 2020.
12. Department of Culture, Information, Hai Phong Museum, Hai Phong relics
- National ranked scenic spot, Hai Phong Publishing House, 2005. 13. Tien Lang District People's Committee, Economic Development Planning -
Culture - Society of Tien Lang district to 2010.
14.Website www.HaiPhong.gov.vn
APPENDIX 1
List of national ranked monuments
STT
Name of the monument
Number, year of decisiondetermine
Location
1
Gam Temple
938 VH/QĐ04/08/1992
Cam Khe Village- Toan Thang commune
2
Doc Hau Temple
9381 VH/QĐ04/08/1992
Doc Hau Village –Toan Thang commune
3
Cuu Doi Communal House
3207 VH/QĐDecember 30, 1991
Zone II of townTien Lang
4
Ha Dai Temple
938 VH/QĐ04/08/1992
Ha Dai Village –Tien Thanh commune
APPENDIX II
STT
Name of the monument
Number, year of decision
Location
1
Phu Ke Pagoda Temple
178/QD-UBJanuary 28, 2005
Zone 1 - townTien Lang
2
Trung Lang Temple
178/QD-UBJanuary 28, 2005
Zone 4 – townTien Lang
3
Bao Khanh Pagoda
1900/QD-UBAugust 24, 2006
Nam Tu Village -Kien Thiet commune
4
Bach Da Pagoda
1792/QD-UB11/11/2002
Hung Thang Commune
5
Ngoc Dong Temple
177/QD-UBNovember 27, 2005
Tien Thanh Commune
6
Tomb of Minister TSNhu Van Lan
2848/QD-UBSeptember 19, 2003
Nam Tu Village -Kien Thiet commune
7
Canh Son Stone Temple
2160/QD-UBSeptember 19, 2003
Van Doi Commune –Doan Lap
8
Meiji Temple
2259/QD-UBSeptember 19, 2002
Toan Thang Commune
9
Tien Doi Noi Temple
477/QD-UBSeptember 19, 2005
Doan Lap Commune
10
Tu Doi Temple
177/QD-UBJanuary 28, 2005
Doan Lap Commune
11
Duyen Lao Temple
177/QD-UBJanuary 28, 2005
Tien Minh Commune
12
Dinh Xuan Uc Pagoda
177/QD-UBJanuary 28, 2005
Bac Hung Commune
13
Chu Khe Pagoda
177/QD-UBJanuary 28, 2005
Hung Thang Commune
14
Dong Dinh
2848/QD-UBNovember 21, 2002
Vinh Quang Commune
15
President's Memorial HouseTon Duc Thang
177/QD-UBJanuary 28, 2005
NT Quy Cao
Ha Dai Temple
Ben Vua Temple
Tien Lang hot spring
div.maincontent .p { color: black; font-family:"Times New Roman", serif; font-style: normal; font-weight: normal; text-decoration: none; font-size: 14pt; margin:0pt; } div.maincontent p { color: black; font-family:"Times New Roman", serif; font-style: normal; font-weight: normal; text-decoration: none; font-size: 14pt; margin:0pt; } div.maincontent .s1 { color: black; font-family:"Times New Roman", serif; font-style: normal; font-weight: normal; font-size: 16pt; } div.maincontent .s2 { color: black; font-family:"Times New Roman", serif; font-style: italic; font-weight: bold; text-decoration: none; font-size: 14pt; } div.maincontent .s3 { color: black; font-family:"Times New Roman", serif; font-style: italic; font-weight: normal; text-decoration: none; font-size: 14pt; } div.maincontent .s4 { color: black; font-family:"Times New Roman", serif; font-style: normal; font-weight: normal; font-size: 14pt; } div.maincontent .s5 { color: black; font-family:"Times New Roman", serif; font-style: normal; font-weight: bold; font-size: 14pt; } div.maincontent .s6 { color: black; font-family:"Times New Roman", serif; font-style: normal; font-weight: normal; text-decoration: none; font-size: 14pt; } div.maincontent .s7 { color: black; font-family:"Times New Roman", serif; font-style: normal; font-weight: bold; text-decoration: none; font-size: 14pt; } div.maincontent .s8 { color: black; font-family:"Times New Roman", serif; font-style: normal; font-weight: normal; text-decoration: none; font-size: 9pt; vertical-align: 6pt; } div.maincontent .s9 { color: black; font-family:"Times New Roman", serif; font-style: normal; font-weight: bold; text-decoration: none; font-size: 12pt; } div.maincontent .s11 { color: black; font-family:"Times New Roman", serif; font-style: normal; font-weight: normal; tex
(Source: Survey data 2020)
3.2.3.3. Consumer awareness and behavior about safe vegetables
To assess consumer awareness of RAT products in Thua Thien Hue province, the author conducted a survey of 120 consumers on information related to RAT. The survey results are shown in Figure 3.11.
Difficult to distinguish RAT from normal vegetables There are no signs to identify RAT
The price of RAT is much higher than that of regular vegetables. Regular vegetables are cheaper and still meet consumer demand. Consumers do not really trust RAT.
Propaganda and promotion of RAT production is still limited.
Few RAT types Few RAT sales points
RAT point of sale is not convenient for purchasing products
No comments
78.3%
75.0%
67.5%
55.8%
51.7%
30.0%
25.0%
22.5%
18.3%
12.5%
Figure 3.11. Factors affecting people's consumption of safe vegetables
(Source: Compiled from 2020 survey results)
The survey results show that 78.3% of consumers think it is difficult and impossible to distinguish between RAT and regular vegetables. According to the opinions of interviewed consumers, they know whether it is a RAT product or regular vegetables through the brand from the place where the product is purchased such as supermarkets, RAT stores and information provided by the seller. Most RAT products do not show information about the production facility on the product packaging. In addition, the price of RAT is also a factor that consumers are interested in. 67.5% of the respondents
The survey found that the price of RAT is much higher than the price of regular vegetables and 55.8% said that although the price of regular vegetables is cheaper, it still meets the consumer's requirements for quality. 36.7% said that the activities to promote, introduce and propagate RAT to consumers in the province are currently limited. Therefore, they often choose to buy RAT based on trust and from the introduction of acquaintances. This is also the reason why up to 45.8% of the surveyed people said that they do not really trust RAT.
This shows that, in order to develop RAT production, it is necessary to build a brand for RAT products and production areas, and implement traceability through QR Code stamps. In addition, it is necessary to have measures to promote and propagate to introduce and provide information about RAT to consumers.
3.2.4. Capacity conditions of safe vegetable production households
3.2.4.1. Household production capacity
Production capacity has a direct impact on the decision and efficiency of household production activities. The capacity of vegetable production households in Thua Thien Hue province is shown in Table 3.22.
Table 3.22. Production capacity of surveyed safe vegetable production households
(Average household)
Target
Unit | Safe vegetables | Common vegetables | BQC | Sig. | |
1. Number of employees | People | 2.5 | 2.6 | 2.6 | 0.161 |
- Vegetable production workers | People | 1.6 | 1.4 | 1.5 | 0.000 |
2. Production area | m 2 | 2,932 | 2,984 | 2,961 | 0.695 |
- Vegetable production area | m 2 | 1,334 | 819 | 1,040 | 0.000 |
3. Years of experience | Year | 11.8 | 12.7 | 12.3 | 0.035 |
4. Number of training sessions | Time | 3.5 | 2.6 | 3.0 | 0.000 |
(Source: Survey data 2020)
Labor and production land area are not different between the two groups of households, each household has an average of 2.5 laborers and nearly 3,000 m2 of agricultural land. However, the land area used for vegetable production is different between the two groups of households. The average vegetable production area of RAT producing households is 1,334 m2, higher than
1.6 times that of households producing normal vegetables. Thus, it can be seen that households producing vegetables on a large scale often tend to choose the RAT production form to bring high economic efficiency and sustainable development.
On average, surveyed households participated in vegetable production training 3 times, the most was 6 times. SV producing households participated on average 3.5 times, 1.4 times higher than normal vegetable producing households. This shows that SV producing households have become more aware of grasping information related to SV production, so they have been more active in participating in training. The evaluation results on the application of SV production processes in section 3.1.4.2 further confirm that participating in training courses has changed the production methods of households.
Thus, the resource conditions and production capacity of the production household affect the choice of production organization form. To develop SV production and convert the production model from normal vegetables to SV, the first important issue is to raise awareness for households and expand the production scale.
3.2.4.2. Household awareness level of safe vegetable production
Household awareness of SV production affects compliance with the production process as well as sustainable development of SV production. The results of the survey on household awareness through reasons for choosing the production form and level of understanding of SV production are shown in Figure 3.12, Figure 3.13 and Table 3.23.
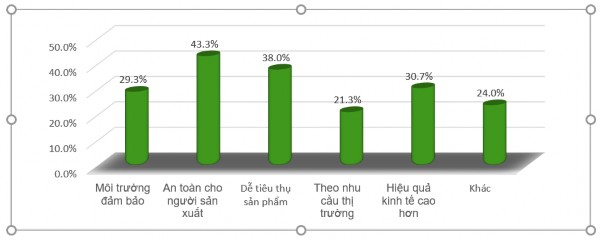
Figure 3.12. Reasons for participating in safe vegetable production of surveyed households
(Source: Survey data 2020)
Regarding the reasons for participating in RAT production: 43.3% of surveyed households said that the reason they produce RAT is to ensure safety for producers, 29.3% to ensure the environment. Producers are aware of the application of RAT production processes, especially
Compliance with the process of using fertilizers and pesticides will reduce the risk of pollution of soil, water, air as well as ensure food hygiene and safety, protect the health of consumers and themselves. 30.7% of households choose to produce SV because they think that SV production brings higher economic efficiency and 38.0% of households think that product consumption will be more convenient than normal vegetable production. According to the producers, although the current price of SV is not much higher than the price of normal vegetables, it has an advantage in product consumption. In particular, 21.3% of producers choose to produce SV because they think that along with development, consumers will be concerned about food safety issues, so the demand for SV will increase, and SV production will be suitable for future consumption trends.
100%
80%
68.0%
81.3%
66.5%
60%
44.5%
64.7%
52.5%
40%
20%
14.7% 14.5%
11.3% 12.5%
0%
Self-study
Share your experience
Training
Media
Other
Safe vegetables Regular vegetables
Figure 3.13. Information channels for accessing knowledge on safe vegetable production
(Source: Survey data 2020)
Awareness of SV production processes and standards: The survey results show that the sources of access to knowledge about SV production are quite diverse and there are differences between the two groups of households. In particular, training is the main information channel for accessing knowledge about SV production, with a rate of 81.3% of SV production households and 66.5% of regular vegetable production households. 64.7% of SV production households and 52.5% of regular vegetable production households said that sharing experiences, knowledge and information about SV production from production households in the area is the channel that helps them know and understand SV production. In addition, 68.0% of SV production households and 44.5% of regular vegetable production households access information and knowledge about SV production from self-study through television, books, newspapers, etc.
When interviewed, most households knew about SV production, but the level of understanding was different. Most SV production households understood.
know more clearly and fully about RAT than households producing regular vegetables, specifically 72.7% of households producing RAT know and understand relatively clearly about the content of RAT production, 26.7% of households know clearly and fully about the content of RAT production while this rate is 15.5% in households producing regular vegetables. 55.5% of households producing regular vegetables know but do not understand clearly and 29% of households know little about RAT. Thus, the level of understanding of RAT affects the choice of production form of the household.
Table 3.23. Level of knowledge about safe vegetables of production households
Unit: %
Level of understanding of RAT
Maternity RAT export | Vegetable production household often | BQC | |
1. Completely unaware | 0.0 | 0.0 | 0.0 |
2. Know little | 0.0 | 29.0 | 16.6 |
3. Know but don't understand clearly | 0.7 | 55.5 | 32.0 |
4. Know and understand relatively well | 72.7 | 15.5 | 40.0 |
5. Know clearly and fully | 26.7 | 0.0 | 11.4 |
(Source: 2020 household production survey data)
3.2.4.3. Orientation and needs for developing safe vegetable production of households
Surveying the production orientation of households in the coming time, 87.4% of interviewed households said they would continue to produce vegetables, of which 92.7% produced RAT and 83.5% produced regular vegetables. According to the producing households, vegetable production brings higher income than other crops and is the main source of income for the family. In addition, vegetable production provides regular income so it can cover the family's living expenses. 9.4% of households have not yet decided on the production orientation in the coming time and 3.1% of households do not continue to produce vegetables because these households are old and have no labor.
Regarding the choice of vegetable production method: 100% of the surveyed households producing RAT said that they would continue to produce RAT, 32.5% of the households producing regular vegetables intended to switch to RAT production, 67.5% of the households producing regular vegetables had no intention of switching to RAT production. The reason why vegetable producing households often intended to switch to RAT production was because RAT products are easier to sell and have a more stable price than regular vegetables, so they provide higher and more stable income. At the same time, when producing in the direction of RAT, the health of the producer is ensured due to limited exposure to pesticides.
Table 3.24. Household vegetable production orientation
Unit: %
Orientation of production households
RAT production household | Regular vegetable production household | BQC | |
1. Production orientation | |||
- Continue vegetable production | 92, 7 | 83.5 | 87.4 |
- Not decided yet | 6.7 | 11.5 | 9.4 |
- Not produced | 0.7 | 5.0 | 3.1 |
2. Type of vegetable production | |||
- Switch to RAT production | 100.0 | 32.5 | 61.4 |
- Continue to produce regular vegetables | - | 67.5 | 38.6 |
(Source: Survey data 2020)
To have more basis to evaluate production activities and propose solutions to develop SV production, the author interviewed households about difficulties in vegetable production. According to households, there are 8 difficulties in SV production activities including unstable selling prices, not creating a habit of recording production diary, unfavorable weather, not building a brand for SV products, difficulties in accessing new techniques, strict SV production process, lower SV productivity compared to normal vegetables and high certification costs. The results of the assessment of the level of difficulties are shown in Table 3.25.
Table 3.25. Households' assessment of the level of difficulty in producing RAT
Target
% of households selected | BQC | |||||
1 | 2 | 3 | 4 | 5 | ||
1. Unstable selling price | 0.0 | 10.0 | 58.7 | 31.3 | 0.0 | 3.2 |
2. Production diary recording | 0.0 | 0.7 | 39.3 | 58.0 | 2.0 | 3.6 |
3. Unfavorable weather | 10.0 | 74.0 | 14.7 | 1.3 | 0.0 | 2.1 |
4. Not yet built a brand | 4.0 | 52.7 | 37.3 | 6.0 | 0.0 | 2.5 |
5. Difficulty in accessing new techniques | 26.7 | 57.3 | 16.0 | 0.0 | 0.0 | 1.9 |
6. Strict production process | 12.0 | 56.7 | 26.0 | 5.3 | 0.0 | 2.3 |
7. Low productivity | 0.7 | 10.7 | 26.7 | 47.3 | 14.7 | 3.7 |
8. High cost of certification | 0.0 | 6.0 | 34.0 | 45.3 | 14.7 | 3.7 |
(Source: Household survey data 2020) (Note: 1: Very difficult, 2: Difficult, 3: Normal, 4: Favorable, 5: Very favorable)
Unstable product prices have directly affected the production efficiency of households. Although the consumption of vegetable products is relatively favorable, the harvested vegetable volume is consumed, but the selling price of vegetables fluctuates and a large volume of RAT still has to be sold at normal vegetable prices. Therefore, 52.7% of production households believe that the lack of building a RAT brand has caused difficulties in consumption, specifically directly affecting the price of RAT. Through the survey, currently in Thua Thien Hue province, the issue that most production households are most concerned about is the output for the product. They are not concerned about applying the correct technical process of production but are most concerned about how to sell products at prices that ensure RAT quality and stability. In addition, recording production logs and high certification costs are also difficult problems that many production households encounter.
According to vegetable producers, to reduce difficulties and risks in vegetable production as well as improve economic efficiency, producers hope to receive support from local authorities, organizations and enterprises in the production and consumption of vegetable products. In production, 68.7% of producers need support in production training, 82.7% of producers need support in input, 77.3% of producers need support in providing market information. Surveyed households said that currently, agricultural extension training courses mainly support production techniques, and it is necessary to increase training courses on production organization, health protection for producers as well as business planning. In addition, each locality needs to have stores providing agricultural materials so that producers can buy materials with guaranteed quality, avoiding the current situation where some types of materials of unknown origin and quality are still supplied on the market.
In consumption, 88.7% of surveyed households need support for linkage in product consumption, contract production is 83.3%, product consumption support is 82.7%. According to production households, although vegetable consumption is relatively favorable, production households still face difficulties in selling prices, especially no difference compared to normal vegetable prices. Therefore, it is necessary to establish cooperatives or vegetable production groups in localities to act as a bridge between production households and the market. Develop purchasing contracts between production households and collectors, supermarkets, schools, etc. to clearly define the rights and responsibilities of the parties as well as ensure the production process according to RAT standards.
Table 3.26. Household needs to develop safe vegetable production
Unit: %
Needs of production households
Maternity RAT export | Production household common vegetables | BQC | |
1. Production training | 68.7 | 69.5 | 69.1 |
2. Links in consumption | 88.7 | 75.5 | 81.1 |
3. Production capital support | 71.3 | 65.0 | 67.7 |
4. Input support | 82.7 | 78.5 | 80.3 |
5. Complete infrastructure system | 84.0 | 83.0 | 83.4 |
6. Provide market information | 77.3 | 75.5 | 76.3 |
7. Quality control of agricultural materials | 76.7 | 65.5 | 70.3 |
8. Contract manufacturing | 83.3 | 75.0 | 78.6 |
9. Product consumption support | 82.7 | 68.5 | 74.6 |
(Source: 2020 production household survey data) Thus, households have a fairly good awareness of the effectiveness of production activities.
RAT. A large number of vegetable producing households usually have some knowledge about RAT production.
but have not yet understood it clearly enough to apply it to production. One of the reasons affecting the decision to switch from regular vegetable production to SV is due to the small production area. In the coming time, to develop SV production, it is necessary to strengthen training for households on SV production and complete planning and land consolidation to increase the scale of household vegetable production.
3.2.5. Factors affecting households' decisions to produce safe vegetables
Survey results at research sites show that farming households often choose to produce SV or regular vegetables, there are no cases of households producing both SV and regular vegetables. Therefore, using the Logit regression model will indicate the factors affecting households' decisions to produce SV in Thua Thien Hue province. This is the basis for proposing solutions to promote the development of SV production. The Logit model is used with the following variables:
1. Dependent variable: Household's decision to participate in RAT production. (1: Household produces RAT and 0: Household produces regular vegetables).
2. Independent variables: The independent variables used in the model include the gender of the household head, the educational level of the household head, the age of the household head, labor, experience in vegetable production,