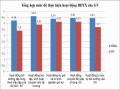
Through the table above, we can see that the training results of the company's employees are almost 100%, through the knowledge test by essay and multiple choice, through this we can see that the company's training results are very good if only based on the theoretical test. But in addition to the theoretical test, the company also evaluates the application results of the employees after training to meet the needs of the job or not, up to here the level is quite low compared to the 100% achievement level of the test, in 2017 it was 83%, in 2018 it was 86% and finally the most optimistic 91%. This can be explained, there is still a gap between theory and practice training, which means that being good at theory does not mean that practice will also be good.

For knowledge training:
After completing the course, trainees must write a post-training harvest report (BM07) and send it to the training department within 3 days from the date of completion of the training course. In addition to the post-training harvest report, employees sent for training after 6 months from the completion of the course will be verified again when evaluating the staff every 6 months or periodically according to the form issued by THACO Chu Lai depending on each year and each period.
For this type of training, almost all workers achieve 100%.
2.3.2.6. Save records
Training specialists update training results into human resource management software to manage training objectives for each personnel component and store training-related records.
2.4. Evaluation of training activities of Chu Lai Truong Hai Composite Production Company through survey of the company's employees
When conducting the survey, the author chose to survey all 147 current employees of the company, the result obtained was 129 votes. Therefore, the results obtained are as follows:
- Total number of ballots issued: 147 ballots
- Total votes received: 129 votes
- Number of votes qualified: 129 votes
Table 2.17: Characteristics of the survey sample
Target
Quantity | Rate (%) | |
Total number of samples | 129 | 100.0 |
Sex | ||
Male | 118 | 91.5 |
Female | 11 | 8.5 |
Age | ||
Under 25 years old | 21 | 16.3 |
25-35 years old | 56 | 43.4 |
35-45 years old | 37 | 28.7 |
45 years old and above | 15 | 11.6 |
Working time | ||
Under 1 year | 6 | 4.7 |
1-3 years | 23 | 17.8 |
3-5 years | 37 | 28.7 |
Over 5 years | 63 | 48.8 |
Title | ||
CB management | 21 | 16.3 |
Specialist, staff | 25 | 19.4 |
Worker | 83 | 64.3 |
Maybe you are interested!
-
 Evaluation of the Implementation of Learning and Professional Activities at High Schools according to the Call of the Department of Education and Training
 -
 Strengthening Training Quality Monitoring and Evaluation Activities
 -
 Current Status of Inspection and Evaluation of Vocal Music Training Activities
 -
 Evaluation of Business Activities and Organization of Inbound Tourism Program at Lotus Tours Travel Company
 -
 The Thesis Conducted A Survey And Evaluation Of The Current Status Of Training Activities And Organization Of Training Activities In Counseling Skills
(Data processing on SPSS software)
Comment:
Regarding gender: As analyzed in secondary data, the male-female ratio in this survey sample also has a very large difference, with males accounting for 91.5% and females only 8.5%.
Regarding age : According to the survey results, the number of employees under 25 years old accounts for 16.3%, the number of employees from 25 to under 35 years old is the largest at 43.3%, the number of employees from 35 to under 45 years old accounts for 28.7% and finally, employees over 45 years old have the lowest rate of 11.6%. This age structure of the labor force is understandable because the nature of the company's production and business industry requires young and enthusiastic workers.
Regarding seniority: According to the survey results, the number of employees with less than 1 year of work experience accounts for the smallest proportion of 4.7%. This is because the survey was conducted at the end of the year and employees with less than 1 year of work experience are all new employees recruited this year. Of which, the number of employees with more than 5 years of work experience accounts for the largest proportion of 48.8%, followed by employees with 3 to 5 years of work experience at 28.7% and finally the number of employees with 1 to 3 years of work experience at 17.8%. Thus, we can see that the majority of the company's employees have good work experience and seniority.
Regarding job titles: According to the survey results, the number of workers accounts for the highest proportion of 64.3%, which is understandable because the company is a manufacturing company. Right after that, is the number of specialists and employees accounting for 19.4%, and finally, managers accounting for 16.3%.
2.4.1. Scale testing using Cronbach's Alpha coefficient
Table 2.18: Cronbach's Alpha analysis of total variable correlation
STT
Variable | Total variable correlation | |
1 | Training opportunities | |
CHĐT1 | 0.562 | |
CHĐT2 | 0.820 | |
CHĐT3 | 0.803 | |
2 | Content, training program | |
CTĐT1 | 0.578 |
STT
Variable | Total variable correlation | |
CTĐT2 | 0.666 | |
CTĐT3 | 0.792 | |
CTĐT4 | 0.755 | |
3 | Quality of teachers | |
GV1 | 0.740 | |
GV2 | 0.638 | |
GV3 | 0.716 | |
4 | Training environment and location | |
MTDT1 | 0.493 | |
MTDT2 | 0.610 | |
MTDT3 | 0.563 | |
5 | Training duration | |
TLĐT1 | 0.735 | |
TLĐT2 | 0.773 | |
TLĐT3 | 0.626 | |
6 | Results of the training program | |
KQD1 | 0.566 | |
KQD2 | 0.626 | |
KQD3 | 0.632 | |
KQD4 | 0.471 | |
7 | Overall assessment of the training program resources (dependent variable) | |
DGC1 | 0.632 | |
DGC2 | 0.769 | |
DGC3 | 0.695 |
(Data processing on SPSS software)
Table 2.19: Statistics after Cronbach's Alpha test completed
STT
Factor | change | change | Cronbach's | Eliminated variable |
initial close | remaining | Alpha | |||
1 | CHĐT | 3 | 3 | 0.849 | - |
2 | Training | 4 | 4 | 0.851 | - |
3 | GV | 3 | 3 | 0.833 | - |
4 | MTDT | 3 | 3 | 0.727 | - |
5 | TĐT | 3 | 3 | 0.839 | - |
6 | Results | 4 | 4 | 0.771 | - |
7 | DGC (dependent) | 3 | 3 | 0.830 | - |
(Data processing on SPSS software)
Comment:
All observed variables of the factors are > 0.6, showing that the measurement scale is used well and meets the requirements, ensuring reliability, so through the Cronbach Alpha reliability test, no observed variables were eliminated, all of these coefficients are meaningful and can be used in the following analysis. In addition, the total correlation coefficients (Corrected Item - Total Correlation) of the variables measuring these factors are all greater than the allowable standard of 0.3, so they meet the requirements and are used in the following analysis. Therefore, all observed variables of the factors will be included in the EFA factor analysis.
2.4.2. Exploratory factor analysis EFA
Factor analysis was conducted using Principal Component Analist with Varimax rotation.
Table 2.20: EFA factor analysis of dependent variable
Factors to consider
Corresponding value | Condition | Conclude | |
KMO coefficient | 0.692 | 0.5<KMO<1 | Meet the requirements |
Sig. Bartlett's test | 0.000 | < 0.05 | Meet the requirements |
Eigenvalues | 2,276 | > 1 | Meet the requirements |
Extracted variance
(Cumulative %)
75,882 | > 50% | Meet the requirements |
(Data processing on SPSS software)
Comment:
In the table above, comparing with the EFA factor analysis conditions, we see that the KMO coefficient = 0.692 > 0.5 meets the conditions (0.5 ≤ KMO ≤1), which means it is consistent with the actual data.
Bartlett's test has a statistical significance level of Sig = 0.000 < 0.05, so the observed variables have a linear correlation with the representative factor. Eigenvalues = 2.276 > 1, Cumulative variance is 75.882% > 50%, so it meets the standards of EFA factor analysis.
Table 2.21: Rotated matrix EFA factor analysis
Observation variable
Factor | |
1 | |
DGCTDT2 | 0.911 |
DGCTDT3 | 0.875 |
DGCTDT1 | 0.825 |
(Data processing on SPSS software)
Table 2.22: EFA factor analysis of independent variables
Factors to consider
Corresponding value | Condition | Conclude | |
KMO coefficient | 0.787 | 0.5<KMO<1 | Meet the requirements |
Sig. Bartlett's test | 0.000 | < 0.05 | Meet the requirements |
Eigenvalues | 1,103 | > 1 | Meet the requirements |
Extracted variance
(Cumulative %)
73,205 | > 50% | Meet the requirements |
(Data processing on SPSS software)
Comment:
The data from the table above shows that all the factors that need to be evaluated by the independent factor
The values meet the requirements. Specifically as follows:
Testing the suitability of factor analysis model
The KMO value = 0.787 satisfies the condition 0.5 ≤ KMO ≤1, so EFA exploratory factor analysis is suitable for real data.
Bartlett's correlation test between observed variables has a statistical significance level of Sig = 0.000 < 0.05, so it can be concluded that the observed variables are linearly correlated with each other in each factor group.
Test of extracted variance of factors (% Cumulative variance)
The above results show that there are 6 factors with Eigenvalues > 1, the smallest is 1.103 > 1, these factors will be retained in the model. In addition, the Cumulative % value is 73.205 %, which means that 73.205 % of the changes in the factors are explained by the observed variables. Thus, the Cumulative % is 73.205% > 50%, which is significant, so the EFA model is appropriate.
Factor loading test
The author uses a sample size of 129, so the Factor loading coefficient needs to be > 0.5 (sample size from 100-350). Using 20 observed variables with sufficient reliability of 6 independent variables to perform factor analysis, the results as shown in Table 2.23 are that all remaining variables satisfy the conditions for factor analysis and are retained for analysis in the next step.
Thus, through testing the quality of the scale by Cronbach's Alpha test and the results of EFA exploratory factor analysis with factor extraction method and Varimax factor rotation for independent variables, the research model has 6 independent variables and
20 observed variables corresponding to 6 factors representing factors affecting the quality of human resource training at the Company….