Table 3.18. Distribution of Ascaris infection intensity by gender (n=261)
Gender
Number of infections | Mild CDN | Average CDN | Severe CDN | ||||
SL | TL % | SL | TL % | SL | TL % | ||
Male | 131 | 101 | 77.1 | 24 | 18.3 | 6 | 4.6 |
Female | 130 | 94 | 72.3 | 32 | 24.6 | 4 | 3.1 |
Total | 261 | 195 | 74.7 | 56 | 21.5 | 10 | 3.8 |
p-value | p (1:2) = 0.668 | p (1:2) =0.350 | p (1:2) =0.754 | ||||
Maybe you are interested!
-
 Interview Questions on Knowledge, Attitudes, and Practices in Worm Infection Prevention.
 -
 HIV infection status and care and ARV treatment for children under 18 months of age born to infected mothers in Vietnam, 2010-2013 - 19
 -
 Chlamydia Infection Distribution by Age Group Before Intervention
 -
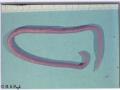 Life Cycle of Ascaris Lumbricoides Worm
 -
 Current status of infection and effectiveness of treatment of soil-transmitted helminths with albendazole and mebendazole in children aged 12-23 months in 3 districts of Dien Bien, Yen Bai, Ha Giang provinces 2015-2016-17
Comment :
The rate of roundworm infection at different intensity levels in the two sexes did not have a statistically significant difference (p>0.05).
Table 3.19. Intensity of worm infection in 3 districts
Conscious
Type of worm | Number of infections | Intensity light | Intensity medium | Intensity heavy | ||||
SL | TL% | SL | TL% | SL | TL% | |||
Week of Teaching | Roundworm | 121 | 86 | 70.1 | 27 | 22.3 | 8 | 7.6 |
whipworm | 34 | 34 | 100 | 0 | 0 | 0 | 0 | |
Hookworm/Beakworm | 3 | 3 | 100 | 0 | 0 | 0 | 0 | |
Meo Vac | Roundworm | 81 | 51 | 62.9 | 28 | 34.6 | 2 | 2.5 |
whipworm | 25 | 24 | 96 | 1 | 4 | 0 | 0 | |
Hookworm/Beakworm | 4 | 4 | 100 | 0 | 0 | 0 | 0 | |
Literature Yen | Roundworm | 59 | 58 | 98.3 | 1 | 1.7 | 0 | 0 |
whipworm | 13 | 13 | 0 | 0 | 0 | 0 | 0 | |
Total | Roundworm | 261 | 195 | 74.7 | 56 | 21.4 | 10 | 3.9 |
whipworm | 72 | 71 | 98.6 | 1 | 1.4 | 0 | 0 | |
Hookworm/Beakworm | 7 | 7 | 100 | 0 | 0 | 0 | 0 | |
Comment:
- In Tuan Giao, 8/121 children were infected with severe roundworm, accounting for 7.6%;
- In Meo Vac, 2/81 children were infected with severe roundworm, accounting for 2.5%;
- Only 1 child infected with moderate intensity whipworm in Meo Vac
Table 3.20. Geometric mean worm egg intensity at study sites
District
Roundworm | whipworm | Hookworm/Beakworm | |
Week of Teaching | 7.71 2.45 | 0.46 0.29 | 0.03 |
Meo Vac | 4.08 ± 2.19 | 0.35 0.17 | 0.05 |
Van Yen | 1.13 0.9 | 0.10 0.05 | 0 |
Comment:
The average intensity of Ascaris eggs in Tuan Giao was highest at 7.71 and lowest at Van Yen at 1.13.
The intensity of whipworm eggs is quite low (0.1-0.46), the intensity of hookworm eggs/beak is very low.
3.1.3. Prevalence and intensity of soil-transmitted helminth infections after 3 and 6 months
We performed stool examinations of all children at 3 and 6 months after the baseline survey. Due to the long follow-up period, the number of children followed at each time point was lower than at the baseline survey. Of the 1240 children, 925 had stool samples retested at both 3 and 6 months.
Table 3.21. Worm infection rate before and after treatment in 3 districts
District
Initial investigation (n=1,240) | Investigation after 3 month (n=925) | Investigation after 6 month (n=925) | |||||||
Number XN | Number (+) | TL % | Number XN | Number (+) | TL % | Number XN | Number (+) | TL % | |
Week of Teaching | 419 | 134 | 32.0 | 349 | 62 | 17.8 | 349 | 88 | 25.2 |
Meo Vac | 389 | 91 | 23.4 | 151 | 30 | 19.9 | 151 | 50 | 33.1 |
Van Yen | 432 | 69 | 16.0 | 361 | 7 | 1.9 | 361 | 12 | 3.3 |
Total | 1,240 | 294 | 23.7 | 925 | 99 | 12.1 | 925 | 150 | 18.0 |
Comment:
- After 3 months, the infection rate in Meo Vac was 19.9%; After 6 months, the infection rate was up to 33.1%, higher than the initial infection rate.
- After 3 months, the infection rate in Tuan Giao was 17.8%; After 6 months, the infection rate was 25.2%,
- In Van Yen, the infection rate after 3 months and 6 months was very low, 1.9% and 3.3% respectively.
Table 3.22. Intensity of worm infection before and after 3 and 6 months
Type of worm
Total infected | Mild CDN | Central College jar | Severe CDN | ||||||||||
(1) | (2) | (3) | (1) | (2) | (3) | (1) | (2) | (3) | (1) | (2) | (3) | ||
Worms chopsticks | SL | 261 | 65 | 93 | 195 | 40 | 57 | 56 | 23 | 34 | 10 | 2 | 2 |
TL% | 100 | 100 | 100 | 74.7 | 61.5 | 61.3 | 21.4 | 35.4 | 36.6 | 3.9 | 3.0 | 2.1 | |
Worms hair | SL | 72 | 34 | 47 | 71 | 34 | 46 | 1 | 0 | 1 | 0 | 0 | 0 |
TL% | 100 | 100 | 100 | 98.6 | 100 | 97.9 | 1.4 | 2.1 | |||||
Worms hook/beak | SL | 7 | 4 | 7 | 7 | 4 | 7 | 0 | 0 | 0 | 0 | 0 | 0 |
TL% | 100 | 100 | 100 | 100 | 100 | 100 | 0 | ||||||
Comment:
After 3 months and 6 months, the rates of infection intensity levels of GTQD types at the research sites were equivalent to those before the investigation.
Table 3.23. Rates of mono- and poly-infection with worms before and after 3 and 6 months
Time
XN
Number infected | Monoinfection | 2 types of infection | 3 types of infection | ||||
SL | TL % | SL | TL % | SL | TL % | ||
Before treatment | 294 | 251 | 85.4 | 40 | 13.6 | 3 | 1.0 |
After 3 months | 99 | 76 | 76.8 | 20 | 20.2 | 3 | 3.0 |
After 6 months | 150 | 119 | 79.3 | 29 | 19.3 | 3 | 2.0 |
Comment:
- The rate of children infected with worms tends to decrease.
- The rate of infection with two and three types of worms increased compared to the initial survey.
Of the 925 children re-sampled at 3 and 6 months, 646 were free of soil-transmitted helminth infections at baseline and 189 were infected with at least one type of soil-transmitted helminth infection. Based on the infection rates of negative children, the incidence and cumulative incidence rates were calculated.
Table 3.24. Incidence of soil-transmitted helminth infections after 3 and 6 months (n=646)
Type
GTQD
After 3 months | From 3rd to 6th month | TLMMTL after 6 months | ||||
Number (+) | TL% | Number (+) | TL% | Number (+) | TL % | |
Chopsticks | 27 | 4.2 | 23 | 3.6 | 50 | 7.7 |
Hair | 11 | 1.7 | 13 | 2.0 | 24 | 3.7 |
Hook/beak | 2 | 0.3 | 2 | 0.3 | 4 | 0.6 |
(Note: TLMMTL: Cumulative incidence rate)
Comment:
- The highest incidence of roundworm infection was 4.2% after 3 months and 7.7% after 6 months;
- The incidence of whipworm ranges from 1.7% to 3.7%;
- The incidence of hookworm/helminthiasis is very low.
3.1.4. Some factors related to soil-transmitted helminth infection in children 12-23 months old at the study site.
In this study, we conducted interviews with parents and caregivers to identify factors associated with STDs in children aged 12-23 months. 1,240 people participated in the interviews.
Table 3.25. Relationship between worm infection rate in children and age group (n=1240)
Age group
Have infected | Are not infected | Total | OR [95%CI] | p | |
From 12-17 months | 117 | 480 | 597 | 1.55 [1.19-2.03] | 0.01 |
From 18-23 months | 177 | 466 | 643 | ||
Total | 294 | 946 | 1,240 |
Comment: Children aged 18-23 months had a 1.55 times higher risk of worm infection than children aged 12-17 months (p<0.01).
Table 3.26. Association between worm infection rate in children and parental education (n=1240)
Education
Infected | Not infected | Total | OR [95%CI] | p | |
Illiteracy + primary school | 158 | 390 | 548 | OR= 1.66 [1:28-2:16] | 0.01 |
From junior high school onwards go up | 177 | 466 | 692 | ||
Total | 294 | 946 | 1,240 |
Comment: The risk of worm infection in children whose parents only attended primary school was 1.66 times higher than in the group of parents who attended junior high school or higher (p<0.01).
Table 3.27. Association between worm infection rate in children and parents' knowledge of soil-transmitted helminth infection prevention (n=1240)
Knowledge about
PC GTQD
Have infected | Are not infected | Total | OR [95%CI] | p | |
Not achieved | 244 | 699 | 943 | OR= 1.72 [1:23-2:41] | 0.01 |
Obtain | 50 | 247 | 297 | ||
Total | 294 | 946 | 1,240 |
Comment: The risk of worm infection in children in the group of parents with inadequate knowledge of preventing STDs was 1.72 times higher than in the group of parents with adequate knowledge. The difference was statistically significant with p<0.01.
Table 3.28. Association between worm infection and number of children in the family (n=1240)
Number of children
Have infected | Are not infected | Total | OR [95%CI] | p | |
3 or more | 77 | 124 | 201 | OR= 2.35 [1.70-3.24] | 0.00 |
1-2 children | 217 | 822 | 946 | ||
Total | 294 | 946 | 1,240 |
Comment:
Children living in families with 3 or more children have a 2.35 times higher risk of worm infection than children living in families with 1-2 children. The difference is statistically significant with p<0.01.
Table 3.29. Association between worm infection and hand washing with soap
for children (n=1,240)
Wash hands with soap
room
Have infected | Are not infected | Total | OR [95%CI] | p | |
Are not | 155 | 438 | 593 | OR= 1.29 [0.99-1.6] | 0.054 |
Have | 139 | 508 | 647 | ||
Total | 294 | 946 | 1,240 |
Comment:
There was no difference in the rate of worm infection between the group whose parents washed their hands with soap and the group who did not wash their hands regularly. The difference was statistically significant with p>0.05.
Table 3.30. Association between worm infection and nail clipping in children
(n = 1,240)
Nail clipping
hands for children
Have infected | Are not infected | Total | OR [95%CI] | p | |
Are not | 214 | 709 | 923 | 1.11 [0.83-1.50] | 0.459 |
Have | 80 | 237 | 317 | ||
Total | 294 | 946 | 1,240 |
Comment:
There was no difference in infection rate between the group that did not have their nails trimmed regularly and the group that had their nails trimmed regularly (p>0.05).
Table 3.31. Association between worm infection and soil playing habits in children (n=1,240)
Dirt
Infected | Not infected | Total | OR [95%CI] | p | |
Have | 216 | 632 | 848 | 1.38 [1.03-1.84] | 0.032 |
Are not | 78 | 314 | 278 | ||
Total | 294 | 946 | 1,240 |
Comment:
There is a correlation between the habit of playing in the soil and the rate of soil-transmitted helminth infection in children. The difference is statistically significant (p<0.05).
Table 3.32. Association between worm infection and use of unsanitary latrines (n=1,231)
Toilet
Infected | Are not infected | Total | OR [95%CI] | p | |
No HVS | 245 | 708 | 953 | 2.0 [1.39-2.87] | 0.00 |
VS | 41 | 237 | 278 | ||
Total | 286 | 945 | 1,231 |
(Note: There were 1231 respondents to this question)
Comment: Households using unsanitary latrines have a 2.0 times higher risk of worm infection than households with hygienic latrines. The difference is statistically significant (p<0.01).
Table 3.33. Association between worm infection and family habit of using fresh manure to fertilize fields (n=1,240)
SD division
fresh
Infected | Are not infected | Total | OR [95%CI] | p-value | |
Have | 188 | 599 | 787 | 1.03 [0.78-1.35] | >0.549 |
Are not | 106 | 347 | 453 | ||
Total | 294 | 946 | 1,240 |
Comment:
There was no difference in the rate of worm infection between children in families using fresh manure and children in families not using fresh manure (p>0.05).
In univariate analysis, we identified 6 factors related to soil-transmitted helminth infection. However, education and knowledge are two factors related to each other, so we chose knowledge to include in the model. Multivariate regression analysis to eliminate confounding factors.
Table 3.34. Logistic regression analysis of risk factors associated with worm infection in children 12-23 months old
Related factors
Grouping | OR [95% CI] | p-value | |
Age group | 18-23 months | 1.65 [ 1.25-2.17] | 0.01 |
12-17 months | |||
naughty habits land of children | Have | 1.20 [0.88-1.65] | 0.331 |
Are not | |||
Number of children | ≥ 3 children | 2.28 [ 1.64-3.18] | 0.00 |
1-2 children | |||
Toilet | No HVS | 1.71 [ 1.16-2.49] | 0.015 |
Hygienic | |||
Parents' knowledge about PC worms | Not achieved | 1.28 [0.89-1.86] | 0.139 |
Obtain |
Comment :
- The 18-23 month age group has a 1.65 times higher risk of worm infection than the 12-17 month age group.
- Children living in families with 3 or more children have a 2.28 times higher risk of worm infection than those in families with only 1-2 children.
- Children in families with unsanitary latrines are 1.71 times more likely to be infected with worms than those in families with hygienic latrines.