Home / Sti Page 20

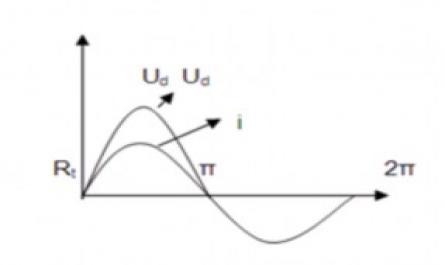
Resistive Load Current and Voltage Curve.

U d = u 2  u d = iR =  2U 2 sin  t  i  2 U 2 sin  t R - The current will be sinusoidal and in phase with u. + In the range from   2  voltage u 2 (-), the voltage of point A (-) compared to point B, diode D is placed in reverse voltage and blocks the current from passing ...

Pulse Characteristics of Linear Phase Fir Digital Filter

Comment: - If there is an all-pass digital filter, a band-pass digital filter and a band-stop filter with the same phase response, we have the following relationship: j  j  j  H bs ( e )  H ap ( e )  H bp ( e ) j  j  j  H bs ( e ) : is the frequency response of the band-stop ...

Statistical Table of Measurement Results of Activities During Learning

We also conducted a correlation test between school blocks, majors and pre-study activities. The results showed that there was no difference between natural science majors and social science majors, between public schools and private schools in terms of pre-study activities. Thus, through the ...

Testing Assumptions of Regression Models

A. Forecasts: (Constant), SI, PE, FC, EE b. Dependent variable: UIE Table 4.8. Parameter table of linear regression model Model Unstandardized coefficient Standardization factor t Sig. Multicollinearity statistics B Standard error Beta Tolerance VIF 1 (Constant) -.327 .169 -1.930 .055 PE .224 .046 ...

Home Reference Doccument