u d = u 2 u d = iR = 2U 2 sin t
i 2 U 2 sin t
R
- The current will be sinusoidal and in phase with u.
+ In the range from 2 voltage u 2 (-), the voltage of point A (-) compared to point B, diode D is placed in reverse voltage and blocks the current from passing through so i = 0
u d = 0.
1 | 0 | 2U 2 | ||||
U d | = | | 2U 2 sin td t | = | = 0.45U 2 |
Maybe you are interested!
-

 Car body electrical practice - 8
zt2i3t4l5ee
zt2a3gs
zt2a3ge
zc2o3n4t5e6n7ts
If the voltage is out of specification, replace the wire or connector.
If the voltage is within specification, install the front fog light relay and follow step 5.
Step 5 Check the front fog light switch
- Remove the D4 connector of the fog light switch
- Use a multimeter to measure the resistance of the front fog light switch.
Measurement location
Condition
Standard
D4-3 (BFG) -D4-4 (LFG)
Light switchFront Fog OFF
>10kΩ
D4-3 (BFG) -D4-4 (LFG)
Front fog light switchON
<1 Ω
- Standard resistor
D4 connector is located on the combination switch assembly.
If the resistance is out of specification, replace the combination switch (the fog light switch is located in the combination switch).
If the resistance is within specification, follow step 6.
Step 6 Check wiring and connectors (front fog light relay-light selector switch)
- Disconnect connector D4 of the combination switch assembly
- Use a voltmeter to measure the voltage value of jack D4 on the wire side.
Measurement location
Control modecontrol
Standard
D4-3 (BFG) - (-) AQ
TAIL
11 to 14 V
D4 connector for the wiring of the combination switch assembly
If the voltage does not meet the standard, replace the wire or connector.
If the voltage is within standard, there may have been an error in the previous measurements.
Step 7 Check the front fog lights
- Remove the front fog light electrical connector.
- Supply battery voltage to the fog lamp terminals
Jack 8, B9 of front fog lamp on the electrical side
blind first.
Power supply location
Terms and Conditions
Battery positive terminal - Terminal 2Battery negative terminal - Terminal 1
Fog lightsbefore morning
- If the light does not come on, replace the bulb.
If the light is on, re-plug the jack and continue to step 8.
Step 8 Check wiring and connectors (relay and front fog lights)
- Disconnect the B8 and B9 connectors of the front fog lights.
- Use a voltmeter to measure voltage at the following locations:
Measurement location
Switch location
Terms and Conditions
B8-2 - (-) AQ
Electric lock ON TAIL size switchFog switch ON
11 to 14 V
B9-2 - (-) AQ
Electric lock ONTAIL size switch Fog switch ON
11 to 14 V
B8 and B9 connectors on the front fog lamp wiring side
Voltage is not up to standard, repair or replace the jack. If up to standard, there may have been an error in the measurement process.
2.2.4. Procedure for removing, installing and adjusting fog lights 1. Procedure for removing
- Remove the front inner ear pads
Use a screwdriver to remove the 3 screws and remove the front part of the front inner ear liner
-Remove the fog light assembly
+ Disconnect the connector.
+ Use a screwdriver to remove 3 screws to remove the fog light cover
2. Installation sequence
-Rotate the fog lamp bulb in the direction indicated by the arrow as shown in the figure and remove the fog lamp from the fog lamp assembly.
-Rotate the fog light bulb in the direction indicated by the arrow as shown in the figure and install the light into the fog light assembly.
- Use a screwdriver to install the fog light cover
-Install the electrical connector
Attention: Be careful not to damage the plastic thread on the lamp assembly.
- Install the front inner ear pads
Use a screwdriver to install the front inner bumper with 3 screws.
3. Prepare the vehicle to adjust the fog light convergence. Prepare the vehicle:
- Make sure there is no damage or deformation to the vehicle body around the fog lights.
- Add fuel to the fuel tank
- Add oil to standard level.
- Add engine coolant to standard level.
- Inflate the tire to standard pressure.
- Place spare tire, tools and jack in original design position
- Do not leave any load in the luggage compartment.
- Let a person weighing about 75 kg sit in the driver's seat.
4. Prepare to check the fog light convergence
a/ Prepare the vehicle status as follows:
- Place the car in a dark enough place to see the lines. The lines are the dividing line, below which the light from the fog lights can be seen but above which it cannot.
- Place the car perpendicular to the wall.
- Keep a distance of 7.62 m between the center of the fog lamp and the wall.
- Park the car on level ground.
- Press the car down a few times to stabilize the suspension.
Note: A distance of approximately 7.62 m is required between the vehicle (fog lamp center) and the wall to adjust the convergence correctly. If the distance of 7.62 m cannot be achieved, set the correct distance of 3 m to check and adjust the fog lamp convergence. (Since the target area varies with the distance, please follow the instructions as shown in the figure.)
b/ Prepare a piece of thick white paper about 2 m high and 4 m wide to use as a screen.
c/ Draw a vertical line through the center of the screen (line V).
d/ Set the screen as shown in the picture. Note:
- Keep the screen perpendicular to the ground.
- Align the V line on the screen with the center of the vehicle.
e/Draw the reference lines (H, V LH and V RH lines) on the screen as shown in the figure.HINT:
Mark the center of the fog lamp on the screen. If the center mark cannot be seen on the fog lamp, use the center of the fog lamp or the manufacturer's name mark on the fog lamp as the center mark.
H line (fog light height):
Draw a line across the screen so that it passes through the center mark. Line H should be at the same height as the center mark of the fog light bulb.
Line V LH, V RH (center mark position of left fog lamp LH and right fog lamp RH):
Draw two lines so that they intersect line H at the center marks.
5. Check the fog light convergence
a/ Cover the fog lamp or remove the connector of the other side fog lamp to prevent light from the unchecked fog lamp from affecting the fog lamp convergence test.
b/ Start the engine.
c/ Turn on the fog lights and make sure that the dividing line is outside the standard area as shown in the drawing.
6. Adjust the fog light convergence
Use a screwdriver to adjust the fog light to the standard area by turning the toe adjustment screw.
Note: If the screw is adjusted too far, loosen it and then tighten it again, so that the last rotation of the light adjustment screw is clockwise.
3. Self-study questions
1. Describe the operating principle of the lighting system with automatic headlight function
2. Describe the operating principle of the lighting system with the function of rotating headlights when turning
3. Draw diagram and connect lighting system on Hyundai Porter car
4. Draw diagram and connect lighting system on Honda Accord 1992
5. Draw the lighting circuit on a 1993 Toyota Lexus
LESSON 3 MAINTENANCE AND REPAIR OF SIGNAL SYSTEM
I. IMPLEMENTATION GOAL
After completing this lesson, students will be able to:
- Distinguish between types of signals on cars
- Correctly describe common symptoms and suspected areas causing damage.
- Connecting signal circuits ensures technical requirements
- Disassemble, install, check, maintain and repair the signal system to ensure technical requirements.
- Ensure safety in work and industrial hygiene
II. LESSON CONTENT
1. General description
The signal system equipped on cars aims to create signals to notify other vehicles participating in traffic about the vehicle's operating status such as: stopping, parking, braking, reversing, turning...
Signals are used either by light such as headlamps, brake lights, turn signals….. or by sound such as horns, reverse music….
Just like the lighting system. A signal system circuit usually consists of: battery, fuse, wire, relay, electrical load and control switch. Only some switches of the signal system are on the combination switch. The switches of other signals are usually located in different locations such as in the gearbox or brake pedal……
2. Maintenance and repair
2.1. Turn signals and hazard lights
The installation location of the turn signal is shown in Figure 3.1. The turn signal control switch is located in the combination switch under the steering wheel. Turning this switch to the right or left will make the turn signal turn right or left.
The hazard light switch is used when the vehicle has a problem while participating in traffic. When the hazard light switch is turned on, all the turn signals on the vehicle will light up at a certain frequency. The hazard light switch is usually placed separately from the turn signal switch (some old cars integrate the hazard and turn signal switches on the same combination switch cluster).
Figure 3.1 Turn signal switch Figure 3.2 Hazard switch
The part that generates the flashing frequency for the lights is called a turn signal relay. The turn signal relay usually has 3 terminals: B (positive power supply); E (negative power supply); L (providing the turn signal switch to distribute to the
lamp)
2.1.1. Circuit diagram
To generate the frequency for the turn signal, a turn signal relay is used in the turn signal circuit. The current from the turn signal relay will be sent to the turn signal switch assembly to distribute the current to the turn signal lights for the driver's purpose.
Figure 3.3. Schematic diagram of a turn signal circuit without a hazard switch
1. Battery; 2. Electric lock; 3. Turn signal relay; 4. Turn signal switch; 5. Turn signal lamp; 6. Turn signal lamp; 7. Hazard switch
Figure 3.4 Schematic diagram of turn signal circuit with hazard switch
1. Battery; 2. Combination switch cluster; 3. Turn signal;
4. Turn signal light; 5. Turn signal relay
Today's cars no longer use three-pin turn signal relays (B, L, E) but use eight-pin turn signal relays (figure 3.5) (pin number 8 is used for hazard lights).
For this type, the current supplying the turn signal lights is supplied directly from the turn signal relay to the lights.
div.maincontent .p { color: black; font-family:"Times New Roman", serif; font-style: normal; font-weight: normal; text-decoration: none; font-size: 14pt; margin:0pt; } div.maincontent p { color: black; font-family:"Times New Roman", serif; font-style: normal; font-weight: normal; text-decoration: none; font-size: 14pt; margin:0pt; } div.maincontent .s1 { color: black; font-family:"Times New Roman", serif; font-style: normal; font-weight: normal; text-decoration: none; font-size: 13pt; } div.maincontent .s2 { color: black; font-family:"Times New Roman", serif; font-style: italic; font-weight: normal; text-decoration: none; font-size: 14pt; } div.maincontent .s3 { color: black; font-family:"Times New Roman", serif; font-style: normal; font-weight: normal; text-decoration: none; font-size: 14pt; } div.maincontent .s4 { color: black; font-family:"Times New Roman", serif; font-style: normal; font-weight: normal; text-decoration: none; font-size: 13pt; } div.maincontent .s5 { color: black; font-family:"Times New Roman", serif; font-style: normal; font-weight: normal; text-decoration: none; font-size: 13pt; vertical-align: 1pt; } div.maincontent .s6 { color: black; font-family:"Times New Roman", serif; font-style: normal; font-weight: normal; text-decoration: none; font-size: 11pt; } div.maincontent .s7 { color: black; font-family:"Times New Roman", serif; font-style: normal; font-weight: normal; text-decoration: none; font-size: 14pt; vertical-align: -9pt; } div.maincontent .s8 { color: black; font-family:"Times New Roman", serif; font-style: normal; font-weight: normal; text-decoration: none; font-size: 11pt; } div.maincontent .s9 { color: #008000; font-family:"Times New Roman", serif; font-style: normal; font-weight: normal; text-decoration: none; font-size: 14pt; } div.maincontent .s10 { color: black; font-family:"Times New Roman", serif; font-style: italic; font-weight: normal; te
Car body electrical practice - 8
zt2i3t4l5ee
zt2a3gs
zt2a3ge
zc2o3n4t5e6n7ts
If the voltage is out of specification, replace the wire or connector.
If the voltage is within specification, install the front fog light relay and follow step 5.
Step 5 Check the front fog light switch
- Remove the D4 connector of the fog light switch
- Use a multimeter to measure the resistance of the front fog light switch.
Measurement location
Condition
Standard
D4-3 (BFG) -D4-4 (LFG)
Light switchFront Fog OFF
>10kΩ
D4-3 (BFG) -D4-4 (LFG)
Front fog light switchON
<1 Ω
- Standard resistor
D4 connector is located on the combination switch assembly.
If the resistance is out of specification, replace the combination switch (the fog light switch is located in the combination switch).
If the resistance is within specification, follow step 6.
Step 6 Check wiring and connectors (front fog light relay-light selector switch)
- Disconnect connector D4 of the combination switch assembly
- Use a voltmeter to measure the voltage value of jack D4 on the wire side.
Measurement location
Control modecontrol
Standard
D4-3 (BFG) - (-) AQ
TAIL
11 to 14 V
D4 connector for the wiring of the combination switch assembly
If the voltage does not meet the standard, replace the wire or connector.
If the voltage is within standard, there may have been an error in the previous measurements.
Step 7 Check the front fog lights
- Remove the front fog light electrical connector.
- Supply battery voltage to the fog lamp terminals
Jack 8, B9 of front fog lamp on the electrical side
blind first.
Power supply location
Terms and Conditions
Battery positive terminal - Terminal 2Battery negative terminal - Terminal 1
Fog lightsbefore morning
- If the light does not come on, replace the bulb.
If the light is on, re-plug the jack and continue to step 8.
Step 8 Check wiring and connectors (relay and front fog lights)
- Disconnect the B8 and B9 connectors of the front fog lights.
- Use a voltmeter to measure voltage at the following locations:
Measurement location
Switch location
Terms and Conditions
B8-2 - (-) AQ
Electric lock ON TAIL size switchFog switch ON
11 to 14 V
B9-2 - (-) AQ
Electric lock ONTAIL size switch Fog switch ON
11 to 14 V
B8 and B9 connectors on the front fog lamp wiring side
Voltage is not up to standard, repair or replace the jack. If up to standard, there may have been an error in the measurement process.
2.2.4. Procedure for removing, installing and adjusting fog lights 1. Procedure for removing
- Remove the front inner ear pads
Use a screwdriver to remove the 3 screws and remove the front part of the front inner ear liner
-Remove the fog light assembly
+ Disconnect the connector.
+ Use a screwdriver to remove 3 screws to remove the fog light cover
2. Installation sequence
-Rotate the fog lamp bulb in the direction indicated by the arrow as shown in the figure and remove the fog lamp from the fog lamp assembly.
-Rotate the fog light bulb in the direction indicated by the arrow as shown in the figure and install the light into the fog light assembly.
- Use a screwdriver to install the fog light cover
-Install the electrical connector
Attention: Be careful not to damage the plastic thread on the lamp assembly.
- Install the front inner ear pads
Use a screwdriver to install the front inner bumper with 3 screws.
3. Prepare the vehicle to adjust the fog light convergence. Prepare the vehicle:
- Make sure there is no damage or deformation to the vehicle body around the fog lights.
- Add fuel to the fuel tank
- Add oil to standard level.
- Add engine coolant to standard level.
- Inflate the tire to standard pressure.
- Place spare tire, tools and jack in original design position
- Do not leave any load in the luggage compartment.
- Let a person weighing about 75 kg sit in the driver's seat.
4. Prepare to check the fog light convergence
a/ Prepare the vehicle status as follows:
- Place the car in a dark enough place to see the lines. The lines are the dividing line, below which the light from the fog lights can be seen but above which it cannot.
- Place the car perpendicular to the wall.
- Keep a distance of 7.62 m between the center of the fog lamp and the wall.
- Park the car on level ground.
- Press the car down a few times to stabilize the suspension.
Note: A distance of approximately 7.62 m is required between the vehicle (fog lamp center) and the wall to adjust the convergence correctly. If the distance of 7.62 m cannot be achieved, set the correct distance of 3 m to check and adjust the fog lamp convergence. (Since the target area varies with the distance, please follow the instructions as shown in the figure.)
b/ Prepare a piece of thick white paper about 2 m high and 4 m wide to use as a screen.
c/ Draw a vertical line through the center of the screen (line V).
d/ Set the screen as shown in the picture. Note:
- Keep the screen perpendicular to the ground.
- Align the V line on the screen with the center of the vehicle.
e/Draw the reference lines (H, V LH and V RH lines) on the screen as shown in the figure.HINT:
Mark the center of the fog lamp on the screen. If the center mark cannot be seen on the fog lamp, use the center of the fog lamp or the manufacturer's name mark on the fog lamp as the center mark.
H line (fog light height):
Draw a line across the screen so that it passes through the center mark. Line H should be at the same height as the center mark of the fog light bulb.
Line V LH, V RH (center mark position of left fog lamp LH and right fog lamp RH):
Draw two lines so that they intersect line H at the center marks.
5. Check the fog light convergence
a/ Cover the fog lamp or remove the connector of the other side fog lamp to prevent light from the unchecked fog lamp from affecting the fog lamp convergence test.
b/ Start the engine.
c/ Turn on the fog lights and make sure that the dividing line is outside the standard area as shown in the drawing.
6. Adjust the fog light convergence
Use a screwdriver to adjust the fog light to the standard area by turning the toe adjustment screw.
Note: If the screw is adjusted too far, loosen it and then tighten it again, so that the last rotation of the light adjustment screw is clockwise.
3. Self-study questions
1. Describe the operating principle of the lighting system with automatic headlight function
2. Describe the operating principle of the lighting system with the function of rotating headlights when turning
3. Draw diagram and connect lighting system on Hyundai Porter car
4. Draw diagram and connect lighting system on Honda Accord 1992
5. Draw the lighting circuit on a 1993 Toyota Lexus
LESSON 3 MAINTENANCE AND REPAIR OF SIGNAL SYSTEM
I. IMPLEMENTATION GOAL
After completing this lesson, students will be able to:
- Distinguish between types of signals on cars
- Correctly describe common symptoms and suspected areas causing damage.
- Connecting signal circuits ensures technical requirements
- Disassemble, install, check, maintain and repair the signal system to ensure technical requirements.
- Ensure safety in work and industrial hygiene
II. LESSON CONTENT
1. General description
The signal system equipped on cars aims to create signals to notify other vehicles participating in traffic about the vehicle's operating status such as: stopping, parking, braking, reversing, turning...
Signals are used either by light such as headlamps, brake lights, turn signals….. or by sound such as horns, reverse music….
Just like the lighting system. A signal system circuit usually consists of: battery, fuse, wire, relay, electrical load and control switch. Only some switches of the signal system are on the combination switch. The switches of other signals are usually located in different locations such as in the gearbox or brake pedal……
2. Maintenance and repair
2.1. Turn signals and hazard lights
The installation location of the turn signal is shown in Figure 3.1. The turn signal control switch is located in the combination switch under the steering wheel. Turning this switch to the right or left will make the turn signal turn right or left.
The hazard light switch is used when the vehicle has a problem while participating in traffic. When the hazard light switch is turned on, all the turn signals on the vehicle will light up at a certain frequency. The hazard light switch is usually placed separately from the turn signal switch (some old cars integrate the hazard and turn signal switches on the same combination switch cluster).
Figure 3.1 Turn signal switch Figure 3.2 Hazard switch
The part that generates the flashing frequency for the lights is called a turn signal relay. The turn signal relay usually has 3 terminals: B (positive power supply); E (negative power supply); L (providing the turn signal switch to distribute to the
lamp)
2.1.1. Circuit diagram
To generate the frequency for the turn signal, a turn signal relay is used in the turn signal circuit. The current from the turn signal relay will be sent to the turn signal switch assembly to distribute the current to the turn signal lights for the driver's purpose.
Figure 3.3. Schematic diagram of a turn signal circuit without a hazard switch
1. Battery; 2. Electric lock; 3. Turn signal relay; 4. Turn signal switch; 5. Turn signal lamp; 6. Turn signal lamp; 7. Hazard switch
Figure 3.4 Schematic diagram of turn signal circuit with hazard switch
1. Battery; 2. Combination switch cluster; 3. Turn signal;
4. Turn signal light; 5. Turn signal relay
Today's cars no longer use three-pin turn signal relays (B, L, E) but use eight-pin turn signal relays (figure 3.5) (pin number 8 is used for hazard lights).
For this type, the current supplying the turn signal lights is supplied directly from the turn signal relay to the lights.
div.maincontent .p { color: black; font-family:"Times New Roman", serif; font-style: normal; font-weight: normal; text-decoration: none; font-size: 14pt; margin:0pt; } div.maincontent p { color: black; font-family:"Times New Roman", serif; font-style: normal; font-weight: normal; text-decoration: none; font-size: 14pt; margin:0pt; } div.maincontent .s1 { color: black; font-family:"Times New Roman", serif; font-style: normal; font-weight: normal; text-decoration: none; font-size: 13pt; } div.maincontent .s2 { color: black; font-family:"Times New Roman", serif; font-style: italic; font-weight: normal; text-decoration: none; font-size: 14pt; } div.maincontent .s3 { color: black; font-family:"Times New Roman", serif; font-style: normal; font-weight: normal; text-decoration: none; font-size: 14pt; } div.maincontent .s4 { color: black; font-family:"Times New Roman", serif; font-style: normal; font-weight: normal; text-decoration: none; font-size: 13pt; } div.maincontent .s5 { color: black; font-family:"Times New Roman", serif; font-style: normal; font-weight: normal; text-decoration: none; font-size: 13pt; vertical-align: 1pt; } div.maincontent .s6 { color: black; font-family:"Times New Roman", serif; font-style: normal; font-weight: normal; text-decoration: none; font-size: 11pt; } div.maincontent .s7 { color: black; font-family:"Times New Roman", serif; font-style: normal; font-weight: normal; text-decoration: none; font-size: 14pt; vertical-align: -9pt; } div.maincontent .s8 { color: black; font-family:"Times New Roman", serif; font-style: normal; font-weight: normal; text-decoration: none; font-size: 11pt; } div.maincontent .s9 { color: #008000; font-family:"Times New Roman", serif; font-style: normal; font-weight: normal; text-decoration: none; font-size: 14pt; } div.maincontent .s10 { color: black; font-family:"Times New Roman", serif; font-style: italic; font-weight: normal; te -
 Current Status of Human Resource Quality in terms of Mental Power
 -
 Overview of Transformer Station Selection, Voltage Level Selection, Power Supply Diagram.
 -
 Power Electronics Refrigeration and Air Conditioning Engineering - College - Dong Thap Vocational College - 16
 -
 Power Electronics Air Conditioning and Refrigeration Engineering - College - Dong Thap Vocational College - 1
- The maximum reverse voltage applied to the diode is:
U 2max = 2U 2
- The average value of rectified voltage in 1 cycle is:
- The average value of the current through the load is:
U d | 2U 2 | 0.45U 2 | ||||
I d | = | R | = | R | = | R |
- The effective value of the secondary current of the transformer is:
U 2 | ||||
I | = | I 2 | = | 2R |
- Voltage current curve for load R.
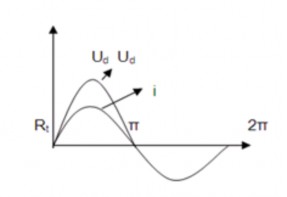
Figure 3.2. Current and voltage curve of purely resistive load.
* When the load is R - L.
Because of the inductor, when the current changes, a self-induced electromotive force e = -L di/dt appears in the inductor. According to Kiecchop's second law for the loop, we have:
u 2 + e = Ri
When u d increases, Ri increases slower than u d by an amount e (the crossed-out part) because now di/dt
> 0 so e < 0, so the inductor stores energy
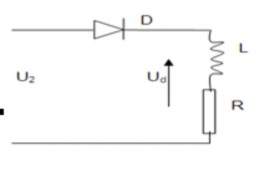
Figure 3.3. Principle of 1-phase half-cycle rectifier circuit RL .
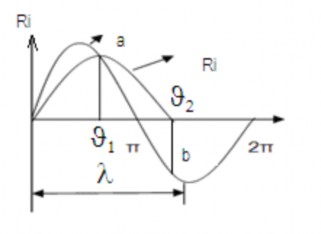
At point a, the current reaches its maximum and then gradually decreases, du/dt < 0, the self-induced electromotive force changes direction. At point b: e = - u 2 , diode D is locked so i = 0. Thus, the current i will be maintained in the range from 2 even though u 2 has changed direction.
Figure 3.4. Current and voltage load curve RL.
2. SINGLE-PHASE TWO HALF-CYCLE RECTIFIER CIRCUIT:
2.1. Draw a schematic diagram of a single-phase, two-half-cycle rectifier circuit:
- Secondary transformer diagram with center tap.
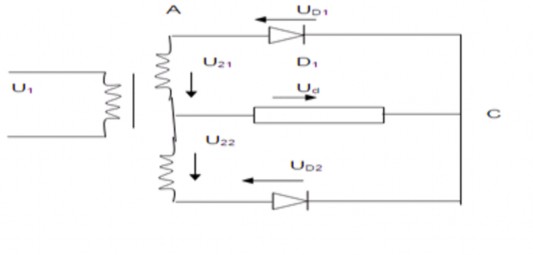
Figure 3.5. 1-phase 2-half-cycle rectifier circuit with center-tapped secondary transformer .
2.2 . Working principle, draw the voltage-current curve for load R, R – L. Secondary voltage:
u 21 = 2U 2 sin t
u 22 = 2U 2 sin t
We have u 21 and u 22 are out of phase with each other. When point A has a (+) voltage, u 21 applies a forward voltage to diode D 1 , then point B has a (-) voltage, u 22 applies a reverse voltage to D 2 . We have
+ In the range (0 ): u 21 (+) D 1 opens u 22 (-) D 2 locks.
The current through D 1 is:
21 D1 d i= i= i=u 21 | = | 2U 2 | sin t |
R | R |
The reverse voltage applied to D 2 is: because D 1 is open, consider the voltage drop on the forward resistance of D 1 to be 0, then the voltage at point A will be applied to the good karma of D 2, so the reverse voltage applied to D 2 is:
u D2 = u 22 – u 21 = -2 2U 2 sin t
The maximum reverse voltage applied to D 2 is: U nm = -2 2U 2
+ In the range from (0 2 ): u 21 (-) and apply reverse voltage to D 1 , u 22 (+) and apply forward voltage to D 2 , D 2 opens and D 1 locks.
22
+ Average value of rectified voltage:
12
1
U
d 2
u dd t
0 0
2 U 2 sin td t U 2
+ Average load current value:
U d | = | 2 2 | U 2 |
R | R |
+ Average value of current through diode:
2
1 2 I
ID sin td t
d
Comment:
2 0 R 2
- The average value of rectified voltage and load current is twice as large as in half-wave rectification diagram.
- The maximum source voltage applied to the diode when it is locked is also twice as large as in ½-cycle rectification.
- Bridge diagram:
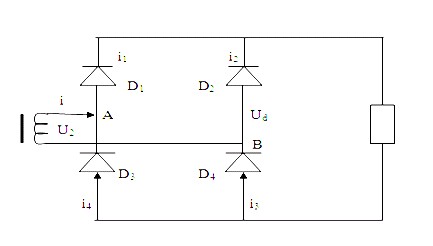
Figure 3.6. Diagram of a 1-phase, 2-half-cycle rectifier bridge.
Whole diagram operation:
+ In the range from (0 ): u 2 > 0 and has polarity (+) at A, (-) at B, D 1 and D 3 open for current to flow along the path A D 1 R D 3 B, D 2 and D 4 are locked
+ in the range (0 2 ): u 2 < 0 and has polarity (+) at B, (-) at A and D 2, D 4 opens for current to flow along path B D 2 R D 4 A, D 1 and D 3 are locked
The average values of voltage and current across the load are U d and I d as in the case of a centre-tapped secondary transformer.
* Steps and how to do the job :
1. EQUIPMENT, TOOLS, MATERIALS:
(Calculated for a practice session of 20 students)
TT
Equipment Type | Quantity | |
1 | Soldering iron. | 01 |
2 | Universal board. | 01 |
3 | Clamp. | 01 |
4 | Bending pliers. | 01 |
5 | Drag | 01 |
6 | Damaged material container | 01 |
Multimeter. | 01 | |
8 | Oscilloscope. | 01 |
9 | Tin, rosin, wire. | |
10 | - Accessory: Semiconductor diode 1A 4 Resistor 30 - 30W1 Single phase transformer S = 15VA 1 small capacity U 2 = 24V Printed circuit 1 - Oscilloscope 1 | |
- | ||
- |
7
2. IMPLEMENTATION PROCESS:
2.1. General process:
+ How to check: use a multimeter to measure:
- Step 1: Plug the red measuring stick into the (-) socket of the meter (positive battery), plug the red measuring stick into the (+) socket of the meter (negative battery).
- Step 2: Turn the knob to the meter at the x10 (x1) resistance scale, short the two ends of the measuring rod, turn the potentiometer so that the indicator needle is at the 0Ω position.
- Step 3: Place the two ends of the measuring stick on the two diode poles as shown (Figure 1.9a) to read the value R 1
2.2. Specific process:
Step 1: Draw the circuit board and component layout diagram.
- Draw the schematic diagram as a pure resistive load circuit.
- Assembly diagram.
Step 2: Mount components and weld
- Mount components in the correct position and polarity. Select components according to load requirements.
- The weld must be standard and beautiful as required.
+ The weld must be neat, round and have a peak.
+ The connecting wire must be tinned.
Step 3: Measure and draw the voltage waveform on the load using a measuring instrument.
- Use a meter to measure output voltage.
- The output voltage graph will be in the form of a half cycle.
- Use an oscilloscope to measure the output voltage on the load.
3. CHECK:
* Student evaluation form:
TT
Job Description | Score | Point Evaluate | Note | |
1 | Make a work plan | 0.5 | ||
2 | Recognize symbols and actual shapes of equipment needed for survey | 1 | ||
3 | Analysis of operating principles | 1.5 | ||
4 | Install and survey according to diagram | 4 | ||
5 | Draw the state diagram of the operation | 2 | ||
6 | Give practical application circuit | 1 | ||
Total score | 10 | |||
Classification | ||||
LESSON 4: THREE-PHASE UNCONTROLLED POWER RECTIFIER
Article code: MD 23 - 04
Introduce:
Three-phase power rectifiers are used as power sources for controllers in particular and electrical equipment in general where there is a three-phase power source. Understanding the working principle of the power source and assembling rectifier power sources is a necessary task for every electrical engineering student.
Target:
- Understand the schematic diagram of three-phase rectifiers in radial and spherical shapes
- Present the working principle, draw the rectifier output voltage and current graph.
- Demonstrate how to install components according to the schematic diagram
- Identify the type of components in the diagram
- Know how to check components
- Install circuit according to correct process, ensuring technical and aesthetic requirements, on time
- Use measuring tools and equipment properly
- Careful, accurate, strictly follow the process
- Ensure safety.
Main content:
1. THREE-PHASE RECTIFIER CIRCUIT RAY DIAGRAM:
1.1. Draw a schematic diagram of a three-phase radial rectifier circuit:
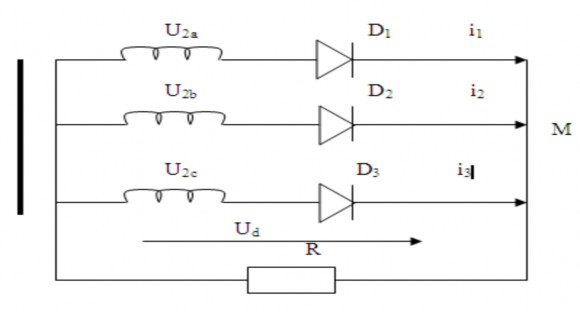
Figure 4.1. Schematic diagram of a three-phase radial rectifier circuit
The circuit includes: 3-phase isolation transformer, three rectifier diodes with pure resistive load.
1.2. Working principle, draw the voltage-current curve for load R:
The secondary voltage of the transformer is:
u 2a = 2U 2 sin t
u 2b = 2U 2 sin t ( t - 2 /3) u 2c = 2U 2 sin t ( t - 4 /3)
The three diodes D 1, D 2, D 3 have a common cathode, so only the diode with the anode connected to the largest (+) voltage will open.
We have a time graph as shown in figure 4.2.
Considering the time corresponding to 1, we have u A > u B > u C, so D 1 opens to let current flow through. Because D 1 is open, the voltage at point M is: u M = u 2a , so D 2 and D 3 are closed because the cathode voltage is greater than the anode voltage.
Thus from /6 < < 5 /6 D 1 is open, D 2 and D 3 are closed.
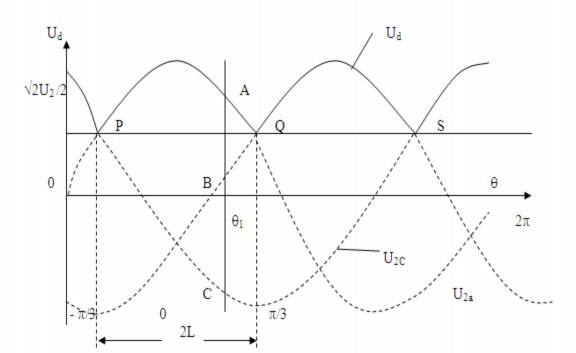
Figure 4.2. Voltage-time graph on load
From 5 /6 < < 9 /6 D 2 is open, D 1 and D 3 are locked. From 9 / 6 < < 13 /6 D 3 is open, D 2 and D 1 are locked.
Thus each diode is open for about 1/3 of a cycle.
1 2
5
2 U 2 sin td t 1.17 U
36
3 6 U
U d 2
u d d t 2
0
6
2
2 2
- Average value of voltage across load:
- Maximum reverse voltage applied to the diode:
In the case D 1 is open, the reverse voltage applied to D 2 is
u n = u 2a – u 2b = u ab so the maximum reverse voltage applied to D 2 is:
U nm = 2 3U 2 = 6U 2 = 2.45 U 2
- The average value of the current on the load is: