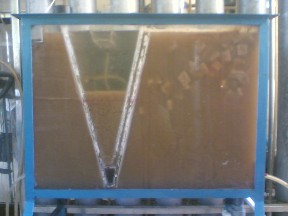
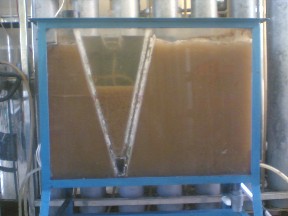
(a) (b)
Figure 3.4. USBF tank with support (a) and USBF tank without support (b)
3.4.2 Experimental layout
3.4.2.1 Experimental setup for electrochemical coagulation tank
For the electrochemical flocculation tank operating in batches to reduce the load on the USBF tank, we need to conduct experiments to determine the following parameters: water retention time in the tank, distance between two electrodes, electrode plate area (or S/V ratio), voltage - current intensity (or current density).
For experiments to determine a parameter, we will perform with the same type of wastewater (collected on the same day, same time and same location) to ensure the objectivity of our data. Because wastewater collected at different times will not be the same in terms of composition and concentration of pollutants. At that time, the operating conditions of the experiments in the same treatment will be different and the results will not be consistent.
In all experiments we controlled the salinity at 1.2‰ and used 24 liters of wastewater. In addition, the effective height of the tank was always 0.94 m.
Experiment 2: Determination of hydraulic retention time (θ)
According to Tran Hieu Nhue (2001), the best retention time for electrolytic flotation tanks is 0.75h (45 minutes). Therefore, we decided to choose time points around the value of 45 minutes for the experiment. We chose 8 retention time points, each time point is 15 minutes apart (meaning starting from 15 minutes and ending at 120 minutes). The purpose of this is to investigate the relationship between treatment efficiency and retention time.
Thus, we conducted this experiment with 8 treatments corresponding to 8 water retention time points, respectively 15; 30; 45; 60; 75; 90; 105; 120 (minutes). We performed each treatment with 3 repetitions.
For the remaining parameters we decided to choose as follows: The metal used as electrode will use the best result of the orientation experiment - experiment 1. The distance between the two electrodes is 2cm (Tran Hieu Nhue, 2001) , the area of the electrode plate is 100cm 2 (or the S/V ratio is 0.4167 m 2 /m 3 ). Using a current with an intensity of 1.6A - the voltage is 24V (or the current density is 160 A/m 2 ).
The experiment is arranged according to the following diagram:
TN 60.
3
TN 45.
3
TN 30.
3
TN 30.
2
TN 30.
1
TN 15.
3
TN 15.
2
TN 15.
1
60 (minutes)
45 (minutes)
30 (minutes)
15 (minutes)
Hydraulic retention time (θ)
TN 60.
2
TN 60.
1
TN 45.
2
TN 45.
1
75 (minutes)
90 (minutes)
105 (minutes)
120 (minutes)
TN 75.1
TN 75.2
TN 75.3
TN 90.1
TN 90.2
TN 90.3
TN 105.
3
TN 120.
3
TN 105.
1
TN 105.
2
TN 120.
1
TN 120.
2
During the operation of the model, we will monitor the evolution of electricity consumption over each retention period. Input and output samples will be analyzed for pH, salinity, conductivity, SS, COD, BOD5 , TKN, total P. After analyzing the above indicators, the data will be processed and analyzed to select the best treatment (retention time) based on the proposed economic and technical objectives. This best retention time will be applied to the following experiments.
Experiment 3: Determine the distance between two electrodes (d)
According to Tran Hieu Nhue (2001), the best distance between two electrodes in the electrolytic flotation tank is 2cm. Therefore, we conducted this experiment with 3 solutions.
The formulas correspond to 3 distances of 1cm; 2cm; 3cm respectively. We performed each formula with 3 repetitions.
For the remaining parameters we decided to choose as follows: the metal as electrode will use the best result of the orientation experiment - experiment 1. The retention time is the best retention time chosen in experiment 2 , the electrode plate area is 100cm 2 (or the S/V ratio is 0.4167 m 2 /m 3 ). Using a current with an intensity of 1.6A - the voltage is 24V (or the current density is 160 A/m 2 ).
The experiment is arranged according to the following diagram:
1 (cm)
2 (cm)
3 (cm)
TN 1.1
TN 1.2
TN 1.3
TN 2.1
TN 2.2
TN 2.3
TN 3.1
TN 3.2
TN 3.3
Distance between two electrodes (d)
During the operation of the model, we will monitor the evolution of power consumption corresponding to each distance between the two electrodes. Input and output samples will be analyzed for pH, salinity, conductivity, SS, COD, BOD5 , TKN, total P. After analyzing the above indicators, the data will be processed and analyzed to select the best formula (distance between the two electrodes) based on the proposed economic and technical goals. This best distance between the two electrodes will be applied for the following experiments.
Experiment 4: Determine the electrode area (S) or the S/V ratio
We performed this experiment with 3 electrode area values of 100cm 2 ; 200cm 2 ; 300cm 2 respectively , corresponding to 3 S/V ratios of 0.4167m 2 /m 3 ; 0.8333m 2 /m 3 ; 1.25m 2 /m 3 respectively (because the volume of wastewater used is always 24 liters). Each electrode area value (or S/V ratio) is a solution. We performed each formula with 3 repetitions.
For the remaining parameters we decided to choose as follows: The metal for electrodes will use the best result of the orientation experiment - experiment 1. Time
The retention time is taken as the best value in experiment 2. The distance between the two electrodes is taken as the best value in experiment 3. Use a current with an intensity of 1.6A - a voltage of 24V (or a current density of 160 A/m 2 ).
200 (cm 2 )
TN 200.
1
TN 200.
2
TN 200.
3
100 (cm 2 )
TN 100.
1
TN 100.
2
TN 100.
3
The experiment is arranged according to the following diagram:
Electrode plate area (S) or S/V ratio
300 (cm 2 )
TN 300.
3
TN 300.
1
TN 300.
2
During the model operation, we will monitor the evolution of power consumption corresponding to each electrode area. Input and output samples will be analyzed for pH, salinity, conductivity, SS, COD, BOD5 , TKN, total P. After analyzing the above indicators, the data will be processed and analyzed to select the best formula (electrode area) based on the proposed economic and technical goals. This best electrode area will be applied to the following experiments.
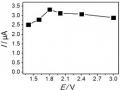
Experiment 5: Determine the intensity and voltage of the electric current (current density)
electricity)
We performed this experiment with 3 pairs of voltage and current values.
The voltage values are 15V - 1.1A; 18V - 1.4A; 24V - 1.6A, corresponding to 3 current density values of 110 A/m 2 ; 140 A/m 2 ; 160 A/m 2 respectively . Each pair of voltage value - current intensity (or current density) is a test. We performed each test with 3 repetitions.
For the remaining parameters we decided to choose as follows: The metal used as electrode will use the best result of the orientation experiment - experiment 1. The retention time will take the best value in experiment 2. The distance between the two electrodes will take the best value in experiment 3. The area of the electrode plate (or S/V ratio) will be the best result in experiment 4.
18V - 1.4A
15V - 1.1A
The experiment is arranged according to the following diagram:
Voltage - current (current density)
24V - 1.6A
TN
TN | TN | TN | TN | TN | TN | TN | TN | ||||||||
15.1 | 15.2 | 15.3 | 18.1 | 18.2 | 18.3 | 24.1 | 24.2 | 24.3 |
Maybe you are interested!
-

 Research on the treatment of seafood wastewater by electrocoagulation method combined with USBF - 19 tank
 -
 Car body electrical practice - 8
zt2i3t4l5ee
zt2a3gs
zt2a3ge
zc2o3n4t5e6n7ts
If the voltage is out of specification, replace the wire or connector.
If the voltage is within specification, install the front fog light relay and follow step 5.
Step 5 Check the front fog light switch
- Remove the D4 connector of the fog light switch
- Use a multimeter to measure the resistance of the front fog light switch.
Measurement location
Condition
Standard
D4-3 (BFG) -D4-4 (LFG)
Light switchFront Fog OFF
>10kΩ
D4-3 (BFG) -D4-4 (LFG)
Front fog light switchON
<1 Ω
- Standard resistor
D4 connector is located on the combination switch assembly.
If the resistance is out of specification, replace the combination switch (the fog light switch is located in the combination switch).
If the resistance is within specification, follow step 6.
Step 6 Check wiring and connectors (front fog light relay-light selector switch)
- Disconnect connector D4 of the combination switch assembly
- Use a voltmeter to measure the voltage value of jack D4 on the wire side.
Measurement location
Control modecontrol
Standard
D4-3 (BFG) - (-) AQ
TAIL
11 to 14 V
D4 connector for the wiring of the combination switch assembly
If the voltage does not meet the standard, replace the wire or connector.
If the voltage is within standard, there may have been an error in the previous measurements.
Step 7 Check the front fog lights
- Remove the front fog light electrical connector.
- Supply battery voltage to the fog lamp terminals
Jack 8, B9 of front fog lamp on the electrical side
blind first.
Power supply location
Terms and Conditions
Battery positive terminal - Terminal 2Battery negative terminal - Terminal 1
Fog lightsbefore morning
- If the light does not come on, replace the bulb.
If the light is on, re-plug the jack and continue to step 8.
Step 8 Check wiring and connectors (relay and front fog lights)
- Disconnect the B8 and B9 connectors of the front fog lights.
- Use a voltmeter to measure voltage at the following locations:
Measurement location
Switch location
Terms and Conditions
B8-2 - (-) AQ
Electric lock ON TAIL size switchFog switch ON
11 to 14 V
B9-2 - (-) AQ
Electric lock ONTAIL size switch Fog switch ON
11 to 14 V
B8 and B9 connectors on the front fog lamp wiring side
Voltage is not up to standard, repair or replace the jack. If up to standard, there may have been an error in the measurement process.
2.2.4. Procedure for removing, installing and adjusting fog lights 1. Procedure for removing
- Remove the front inner ear pads
Use a screwdriver to remove the 3 screws and remove the front part of the front inner ear liner
-Remove the fog light assembly
+ Disconnect the connector.
+ Use a screwdriver to remove 3 screws to remove the fog light cover
2. Installation sequence
-Rotate the fog lamp bulb in the direction indicated by the arrow as shown in the figure and remove the fog lamp from the fog lamp assembly.
-Rotate the fog light bulb in the direction indicated by the arrow as shown in the figure and install the light into the fog light assembly.
- Use a screwdriver to install the fog light cover
-Install the electrical connector
Attention: Be careful not to damage the plastic thread on the lamp assembly.
- Install the front inner ear pads
Use a screwdriver to install the front inner bumper with 3 screws.
3. Prepare the vehicle to adjust the fog light convergence. Prepare the vehicle:
- Make sure there is no damage or deformation to the vehicle body around the fog lights.
- Add fuel to the fuel tank
- Add oil to standard level.
- Add engine coolant to standard level.
- Inflate the tire to standard pressure.
- Place spare tire, tools and jack in original design position
- Do not leave any load in the luggage compartment.
- Let a person weighing about 75 kg sit in the driver's seat.
4. Prepare to check the fog light convergence
a/ Prepare the vehicle status as follows:
- Place the car in a dark enough place to see the lines. The lines are the dividing line, below which the light from the fog lights can be seen but above which it cannot.
- Place the car perpendicular to the wall.
- Keep a distance of 7.62 m between the center of the fog lamp and the wall.
- Park the car on level ground.
- Press the car down a few times to stabilize the suspension.
Note: A distance of approximately 7.62 m is required between the vehicle (fog lamp center) and the wall to adjust the convergence correctly. If the distance of 7.62 m cannot be achieved, set the correct distance of 3 m to check and adjust the fog lamp convergence. (Since the target area varies with the distance, please follow the instructions as shown in the figure.)
b/ Prepare a piece of thick white paper about 2 m high and 4 m wide to use as a screen.
c/ Draw a vertical line through the center of the screen (line V).
d/ Set the screen as shown in the picture. Note:
- Keep the screen perpendicular to the ground.
- Align the V line on the screen with the center of the vehicle.
e/Draw the reference lines (H, V LH and V RH lines) on the screen as shown in the figure.HINT:
Mark the center of the fog lamp on the screen. If the center mark cannot be seen on the fog lamp, use the center of the fog lamp or the manufacturer's name mark on the fog lamp as the center mark.
H line (fog light height):
Draw a line across the screen so that it passes through the center mark. Line H should be at the same height as the center mark of the fog light bulb.
Line V LH, V RH (center mark position of left fog lamp LH and right fog lamp RH):
Draw two lines so that they intersect line H at the center marks.
5. Check the fog light convergence
a/ Cover the fog lamp or remove the connector of the other side fog lamp to prevent light from the unchecked fog lamp from affecting the fog lamp convergence test.
b/ Start the engine.
c/ Turn on the fog lights and make sure that the dividing line is outside the standard area as shown in the drawing.
6. Adjust the fog light convergence
Use a screwdriver to adjust the fog light to the standard area by turning the toe adjustment screw.
Note: If the screw is adjusted too far, loosen it and then tighten it again, so that the last rotation of the light adjustment screw is clockwise.
3. Self-study questions
1. Describe the operating principle of the lighting system with automatic headlight function
2. Describe the operating principle of the lighting system with the function of rotating headlights when turning
3. Draw diagram and connect lighting system on Hyundai Porter car
4. Draw diagram and connect lighting system on Honda Accord 1992
5. Draw the lighting circuit on a 1993 Toyota Lexus
LESSON 3 MAINTENANCE AND REPAIR OF SIGNAL SYSTEM
I. IMPLEMENTATION GOAL
After completing this lesson, students will be able to:
- Distinguish between types of signals on cars
- Correctly describe common symptoms and suspected areas causing damage.
- Connecting signal circuits ensures technical requirements
- Disassemble, install, check, maintain and repair the signal system to ensure technical requirements.
- Ensure safety in work and industrial hygiene
II. LESSON CONTENT
1. General description
The signal system equipped on cars aims to create signals to notify other vehicles participating in traffic about the vehicle's operating status such as: stopping, parking, braking, reversing, turning...
Signals are used either by light such as headlamps, brake lights, turn signals….. or by sound such as horns, reverse music….
Just like the lighting system. A signal system circuit usually consists of: battery, fuse, wire, relay, electrical load and control switch. Only some switches of the signal system are on the combination switch. The switches of other signals are usually located in different locations such as in the gearbox or brake pedal……
2. Maintenance and repair
2.1. Turn signals and hazard lights
The installation location of the turn signal is shown in Figure 3.1. The turn signal control switch is located in the combination switch under the steering wheel. Turning this switch to the right or left will make the turn signal turn right or left.
The hazard light switch is used when the vehicle has a problem while participating in traffic. When the hazard light switch is turned on, all the turn signals on the vehicle will light up at a certain frequency. The hazard light switch is usually placed separately from the turn signal switch (some old cars integrate the hazard and turn signal switches on the same combination switch cluster).
Figure 3.1 Turn signal switch Figure 3.2 Hazard switch
The part that generates the flashing frequency for the lights is called a turn signal relay. The turn signal relay usually has 3 terminals: B (positive power supply); E (negative power supply); L (providing the turn signal switch to distribute to the
lamp)
2.1.1. Circuit diagram
To generate the frequency for the turn signal, a turn signal relay is used in the turn signal circuit. The current from the turn signal relay will be sent to the turn signal switch assembly to distribute the current to the turn signal lights for the driver's purpose.
Figure 3.3. Schematic diagram of a turn signal circuit without a hazard switch
1. Battery; 2. Electric lock; 3. Turn signal relay; 4. Turn signal switch; 5. Turn signal lamp; 6. Turn signal lamp; 7. Hazard switch
Figure 3.4 Schematic diagram of turn signal circuit with hazard switch
1. Battery; 2. Combination switch cluster; 3. Turn signal;
4. Turn signal light; 5. Turn signal relay
Today's cars no longer use three-pin turn signal relays (B, L, E) but use eight-pin turn signal relays (figure 3.5) (pin number 8 is used for hazard lights).
For this type, the current supplying the turn signal lights is supplied directly from the turn signal relay to the lights.
div.maincontent .p { color: black; font-family:"Times New Roman", serif; font-style: normal; font-weight: normal; text-decoration: none; font-size: 14pt; margin:0pt; } div.maincontent p { color: black; font-family:"Times New Roman", serif; font-style: normal; font-weight: normal; text-decoration: none; font-size: 14pt; margin:0pt; } div.maincontent .s1 { color: black; font-family:"Times New Roman", serif; font-style: normal; font-weight: normal; text-decoration: none; font-size: 13pt; } div.maincontent .s2 { color: black; font-family:"Times New Roman", serif; font-style: italic; font-weight: normal; text-decoration: none; font-size: 14pt; } div.maincontent .s3 { color: black; font-family:"Times New Roman", serif; font-style: normal; font-weight: normal; text-decoration: none; font-size: 14pt; } div.maincontent .s4 { color: black; font-family:"Times New Roman", serif; font-style: normal; font-weight: normal; text-decoration: none; font-size: 13pt; } div.maincontent .s5 { color: black; font-family:"Times New Roman", serif; font-style: normal; font-weight: normal; text-decoration: none; font-size: 13pt; vertical-align: 1pt; } div.maincontent .s6 { color: black; font-family:"Times New Roman", serif; font-style: normal; font-weight: normal; text-decoration: none; font-size: 11pt; } div.maincontent .s7 { color: black; font-family:"Times New Roman", serif; font-style: normal; font-weight: normal; text-decoration: none; font-size: 14pt; vertical-align: -9pt; } div.maincontent .s8 { color: black; font-family:"Times New Roman", serif; font-style: normal; font-weight: normal; text-decoration: none; font-size: 11pt; } div.maincontent .s9 { color: #008000; font-family:"Times New Roman", serif; font-style: normal; font-weight: normal; text-decoration: none; font-size: 14pt; } div.maincontent .s10 { color: black; font-family:"Times New Roman", serif; font-style: italic; font-weight: normal; te
Car body electrical practice - 8
zt2i3t4l5ee
zt2a3gs
zt2a3ge
zc2o3n4t5e6n7ts
If the voltage is out of specification, replace the wire or connector.
If the voltage is within specification, install the front fog light relay and follow step 5.
Step 5 Check the front fog light switch
- Remove the D4 connector of the fog light switch
- Use a multimeter to measure the resistance of the front fog light switch.
Measurement location
Condition
Standard
D4-3 (BFG) -D4-4 (LFG)
Light switchFront Fog OFF
>10kΩ
D4-3 (BFG) -D4-4 (LFG)
Front fog light switchON
<1 Ω
- Standard resistor
D4 connector is located on the combination switch assembly.
If the resistance is out of specification, replace the combination switch (the fog light switch is located in the combination switch).
If the resistance is within specification, follow step 6.
Step 6 Check wiring and connectors (front fog light relay-light selector switch)
- Disconnect connector D4 of the combination switch assembly
- Use a voltmeter to measure the voltage value of jack D4 on the wire side.
Measurement location
Control modecontrol
Standard
D4-3 (BFG) - (-) AQ
TAIL
11 to 14 V
D4 connector for the wiring of the combination switch assembly
If the voltage does not meet the standard, replace the wire or connector.
If the voltage is within standard, there may have been an error in the previous measurements.
Step 7 Check the front fog lights
- Remove the front fog light electrical connector.
- Supply battery voltage to the fog lamp terminals
Jack 8, B9 of front fog lamp on the electrical side
blind first.
Power supply location
Terms and Conditions
Battery positive terminal - Terminal 2Battery negative terminal - Terminal 1
Fog lightsbefore morning
- If the light does not come on, replace the bulb.
If the light is on, re-plug the jack and continue to step 8.
Step 8 Check wiring and connectors (relay and front fog lights)
- Disconnect the B8 and B9 connectors of the front fog lights.
- Use a voltmeter to measure voltage at the following locations:
Measurement location
Switch location
Terms and Conditions
B8-2 - (-) AQ
Electric lock ON TAIL size switchFog switch ON
11 to 14 V
B9-2 - (-) AQ
Electric lock ONTAIL size switch Fog switch ON
11 to 14 V
B8 and B9 connectors on the front fog lamp wiring side
Voltage is not up to standard, repair or replace the jack. If up to standard, there may have been an error in the measurement process.
2.2.4. Procedure for removing, installing and adjusting fog lights 1. Procedure for removing
- Remove the front inner ear pads
Use a screwdriver to remove the 3 screws and remove the front part of the front inner ear liner
-Remove the fog light assembly
+ Disconnect the connector.
+ Use a screwdriver to remove 3 screws to remove the fog light cover
2. Installation sequence
-Rotate the fog lamp bulb in the direction indicated by the arrow as shown in the figure and remove the fog lamp from the fog lamp assembly.
-Rotate the fog light bulb in the direction indicated by the arrow as shown in the figure and install the light into the fog light assembly.
- Use a screwdriver to install the fog light cover
-Install the electrical connector
Attention: Be careful not to damage the plastic thread on the lamp assembly.
- Install the front inner ear pads
Use a screwdriver to install the front inner bumper with 3 screws.
3. Prepare the vehicle to adjust the fog light convergence. Prepare the vehicle:
- Make sure there is no damage or deformation to the vehicle body around the fog lights.
- Add fuel to the fuel tank
- Add oil to standard level.
- Add engine coolant to standard level.
- Inflate the tire to standard pressure.
- Place spare tire, tools and jack in original design position
- Do not leave any load in the luggage compartment.
- Let a person weighing about 75 kg sit in the driver's seat.
4. Prepare to check the fog light convergence
a/ Prepare the vehicle status as follows:
- Place the car in a dark enough place to see the lines. The lines are the dividing line, below which the light from the fog lights can be seen but above which it cannot.
- Place the car perpendicular to the wall.
- Keep a distance of 7.62 m between the center of the fog lamp and the wall.
- Park the car on level ground.
- Press the car down a few times to stabilize the suspension.
Note: A distance of approximately 7.62 m is required between the vehicle (fog lamp center) and the wall to adjust the convergence correctly. If the distance of 7.62 m cannot be achieved, set the correct distance of 3 m to check and adjust the fog lamp convergence. (Since the target area varies with the distance, please follow the instructions as shown in the figure.)
b/ Prepare a piece of thick white paper about 2 m high and 4 m wide to use as a screen.
c/ Draw a vertical line through the center of the screen (line V).
d/ Set the screen as shown in the picture. Note:
- Keep the screen perpendicular to the ground.
- Align the V line on the screen with the center of the vehicle.
e/Draw the reference lines (H, V LH and V RH lines) on the screen as shown in the figure.HINT:
Mark the center of the fog lamp on the screen. If the center mark cannot be seen on the fog lamp, use the center of the fog lamp or the manufacturer's name mark on the fog lamp as the center mark.
H line (fog light height):
Draw a line across the screen so that it passes through the center mark. Line H should be at the same height as the center mark of the fog light bulb.
Line V LH, V RH (center mark position of left fog lamp LH and right fog lamp RH):
Draw two lines so that they intersect line H at the center marks.
5. Check the fog light convergence
a/ Cover the fog lamp or remove the connector of the other side fog lamp to prevent light from the unchecked fog lamp from affecting the fog lamp convergence test.
b/ Start the engine.
c/ Turn on the fog lights and make sure that the dividing line is outside the standard area as shown in the drawing.
6. Adjust the fog light convergence
Use a screwdriver to adjust the fog light to the standard area by turning the toe adjustment screw.
Note: If the screw is adjusted too far, loosen it and then tighten it again, so that the last rotation of the light adjustment screw is clockwise.
3. Self-study questions
1. Describe the operating principle of the lighting system with automatic headlight function
2. Describe the operating principle of the lighting system with the function of rotating headlights when turning
3. Draw diagram and connect lighting system on Hyundai Porter car
4. Draw diagram and connect lighting system on Honda Accord 1992
5. Draw the lighting circuit on a 1993 Toyota Lexus
LESSON 3 MAINTENANCE AND REPAIR OF SIGNAL SYSTEM
I. IMPLEMENTATION GOAL
After completing this lesson, students will be able to:
- Distinguish between types of signals on cars
- Correctly describe common symptoms and suspected areas causing damage.
- Connecting signal circuits ensures technical requirements
- Disassemble, install, check, maintain and repair the signal system to ensure technical requirements.
- Ensure safety in work and industrial hygiene
II. LESSON CONTENT
1. General description
The signal system equipped on cars aims to create signals to notify other vehicles participating in traffic about the vehicle's operating status such as: stopping, parking, braking, reversing, turning...
Signals are used either by light such as headlamps, brake lights, turn signals….. or by sound such as horns, reverse music….
Just like the lighting system. A signal system circuit usually consists of: battery, fuse, wire, relay, electrical load and control switch. Only some switches of the signal system are on the combination switch. The switches of other signals are usually located in different locations such as in the gearbox or brake pedal……
2. Maintenance and repair
2.1. Turn signals and hazard lights
The installation location of the turn signal is shown in Figure 3.1. The turn signal control switch is located in the combination switch under the steering wheel. Turning this switch to the right or left will make the turn signal turn right or left.
The hazard light switch is used when the vehicle has a problem while participating in traffic. When the hazard light switch is turned on, all the turn signals on the vehicle will light up at a certain frequency. The hazard light switch is usually placed separately from the turn signal switch (some old cars integrate the hazard and turn signal switches on the same combination switch cluster).
Figure 3.1 Turn signal switch Figure 3.2 Hazard switch
The part that generates the flashing frequency for the lights is called a turn signal relay. The turn signal relay usually has 3 terminals: B (positive power supply); E (negative power supply); L (providing the turn signal switch to distribute to the
lamp)
2.1.1. Circuit diagram
To generate the frequency for the turn signal, a turn signal relay is used in the turn signal circuit. The current from the turn signal relay will be sent to the turn signal switch assembly to distribute the current to the turn signal lights for the driver's purpose.
Figure 3.3. Schematic diagram of a turn signal circuit without a hazard switch
1. Battery; 2. Electric lock; 3. Turn signal relay; 4. Turn signal switch; 5. Turn signal lamp; 6. Turn signal lamp; 7. Hazard switch
Figure 3.4 Schematic diagram of turn signal circuit with hazard switch
1. Battery; 2. Combination switch cluster; 3. Turn signal;
4. Turn signal light; 5. Turn signal relay
Today's cars no longer use three-pin turn signal relays (B, L, E) but use eight-pin turn signal relays (figure 3.5) (pin number 8 is used for hazard lights).
For this type, the current supplying the turn signal lights is supplied directly from the turn signal relay to the lights.
div.maincontent .p { color: black; font-family:"Times New Roman", serif; font-style: normal; font-weight: normal; text-decoration: none; font-size: 14pt; margin:0pt; } div.maincontent p { color: black; font-family:"Times New Roman", serif; font-style: normal; font-weight: normal; text-decoration: none; font-size: 14pt; margin:0pt; } div.maincontent .s1 { color: black; font-family:"Times New Roman", serif; font-style: normal; font-weight: normal; text-decoration: none; font-size: 13pt; } div.maincontent .s2 { color: black; font-family:"Times New Roman", serif; font-style: italic; font-weight: normal; text-decoration: none; font-size: 14pt; } div.maincontent .s3 { color: black; font-family:"Times New Roman", serif; font-style: normal; font-weight: normal; text-decoration: none; font-size: 14pt; } div.maincontent .s4 { color: black; font-family:"Times New Roman", serif; font-style: normal; font-weight: normal; text-decoration: none; font-size: 13pt; } div.maincontent .s5 { color: black; font-family:"Times New Roman", serif; font-style: normal; font-weight: normal; text-decoration: none; font-size: 13pt; vertical-align: 1pt; } div.maincontent .s6 { color: black; font-family:"Times New Roman", serif; font-style: normal; font-weight: normal; text-decoration: none; font-size: 11pt; } div.maincontent .s7 { color: black; font-family:"Times New Roman", serif; font-style: normal; font-weight: normal; text-decoration: none; font-size: 14pt; vertical-align: -9pt; } div.maincontent .s8 { color: black; font-family:"Times New Roman", serif; font-style: normal; font-weight: normal; text-decoration: none; font-size: 11pt; } div.maincontent .s9 { color: #008000; font-family:"Times New Roman", serif; font-style: normal; font-weight: normal; text-decoration: none; font-size: 14pt; } div.maincontent .s10 { color: black; font-family:"Times New Roman", serif; font-style: italic; font-weight: normal; te -
 When Should a Healthy Child Get the First Dose of Hepatitis B Vaccine? (Check Only One)
 -
 Two Elements A And B Are In Two Consecutive Main Groups In The Periodic System. In Their Pure Substance State, A And B Do Not React With Each Other. Total Number Of Protons
 -
 Effects of Voltage (A); Kcl Concentration (B); Electrolysis Time (C); and Stirring Time (D) on Hg Signal (Ii)
During the model operation, we will monitor the evolution of power consumption corresponding to each current density value. Input and output samples will be analyzed for pH, salinity, conductivity, SS, COD, BOD5, TKN, total P. After analyzing the above indicators, the data will be processed and analyzed to select the best formula (current density ) based on the proposed economic and technical objectives. This best current density will be applied to complete experiments on the electrochemical flocculation tank to reduce the load on the USBF tank in the following experiments.
3.4.2.2 Experimental setup for USBF tank
Before setting up the experiment for the USBF tank, we consider the following factors:
Microbial content in aerobic compartment:
The USBF tank uses the effluent of the electrocoagulation tank, so we analyze the effluent parameters of the electrocoagulation tank and then put it into operation in the USBF tank. In addition, the microbial content in the aerobic compartment depends on the SS content.
According to Trinh Xuan Lai (2002) , we have:
If: SS < 100 (mg/L) => MLSS < 1500 (mg/L)
SS = 100 - 150 (mg/L) => MLSS < 2000 (mg/L) SS = 150 - 200 (mg/L) => MLSS < 2800 (mg/L) SS > 200 (mg/L) => MLSS = 2800 - 4000 (mg/L)
The SS content in the effluent of the electrochemical flocculation tank fluctuated between 150 - 300 (mg/L). Therefore, we decided to control the MLSS in the aerobic compartment of both USBF tanks with and without flocculation at 3400 (mg/L) to conduct this experiment.
Nutrient ratio:
USBF tank is similar to activated sludge tank in that it only works well when BOD5:N:P ratio is 100:5:1. If this ratio lacks N, add ammonium salt, and if it lacks P, add phosphate to the wastewater.
Sludge return rate:
In this topic we do not examine this factor. For the convenience of the experimental process, we decided to choose the recirculation ratio as 100%.
Water retention time:
According to Le Ngoc Cam Van - Nguyen Thi Diem (2010), with a total retention time of 10 hours, the USBF tank model has treated slaughterhouse wastewater to meet QCVN 24: 2009/BTNMT. In addition, seafood wastewater contains organic components with high biodegradability similar to slaughterhouse wastewater. Therefore, we decided to choose a total retention time of 10 hours to operate 2 USBF tanks.
Experiment 6: Determination of efficiency at a total retention time of 10 hours
Waste water
Sludge concentration:
input
Sedimentation chamber
Prevent (1.5h) anaerobic
(2.5)
Aerobic compartment (6h)
Sludge circulation
(undefined)
Output water
Input wastewater
Sedimentation chamber
Sludge concentration:
(undefined )
Output water
USBF tank without shelf
Anoxic compartment (2.5h)
Sludge circulation
(1.5h)
Price tag
Aerobic compartment (6h)
USBF tank with mounting bracket
Determine the efficiency with a total retention time of 10h
No price tag
Has price tag
TN 10.1
TN 10.2
TN 10.3
TN 10.a
TN 10.b
TN 10.c
Experiment 7: Determination of efficiency at a total retention time of 8 hours
If we operate two tanks with a total retention time of 10 hours and the treatment efficiency of SS, COD, BOD5 , TKN, and total P in both USBF tanks without flocculation and USBF tanks with flocculation is high. All of the above indicators meet QCVN 11: 2008/BTNMT (column A) and QCVN 24: 2009/BTNMT (column A), we will decide to operate two tanks.
USBF at total retention time of 8h.
Sludge concentration:
Waste water
Sludge concentration:
(undefined )
input
Anaerobic settling chamber (1.3h)
(2)
Aerobic compartment (4.7h)
Sludge circulation
Waste water
(undefined)
Output water
input
Settling tank (1.3h)
Compartment
Price tag
Output water
anaerobic
(2h)
Sludge circulation
Aerobic compartment (4.7h)
USBF tank without shelf
USBF tank with mounting bracket
Determine the efficiency with a total retention time of 8h
no price tag
Has price tag
TN 8.1
TN 8.2
TN 8.3
TN
8.a
TN
8.b
TN
8.c
Experiment 8: Determination of efficiency at a total retention time of 7 hours
Similarly, if we operate two tanks with a total retention time of 8 hours and the treatment efficiency of SS, COD, BOD5 , TKN, and total P in both the USBF tank without flocculation and the USBF tank with high flocculation is the same. All of the above indicators meet QCVN 11: 2008/BTNMT (column A) and QCVN 24: 2009/BTNMT (column A), we will decide to operate two USBF tanks with a total retention time of 7 hours.
Waste water
Sludge concentration:
input
Sedimentation chamber
(1.2 hours)
Anoxic compartment (1.8)
Aerobic compartment (4h)
Sludge circulation
(undefined)
Output water
Input wastewater
Settling tank (1.2h)
Compartment
Sludge concentration:
(undefined )
Output water
Price tag
USBF tank without shelf
anaerobic
(1.8h)
Sludge circulation
Aerobic compartment (4h)
USBF tank with mounting bracket
Determine the efficiency with a total retention time of 7h
No price tag
Has price tag
TN 7.1
TN 7.2
TN 7.3
TN
7.a
TN
7.b
TN
7.c
3.4.3 Methods and means of analyzing indicators
Influent and effluent samples of aquaculture wastewater were analyzed at the Water Treatment Laboratory and Solid Waste Treatment Laboratory of the Faculty of Environment and Natural Resources, Can Tho University.
The parameters pH, DO, COD, BOD, TKN, total P .... were analyzed according to the instructions of Standard Methods for the Examination of Water and Wastewater (APHA 1995).