In theory, it can be explained on the basis of agency theory, due to information asymmetry, the longer the debt, the greater the risk of the lender, so the agency cost of the lender or the financial cost of the enterprise is greater.
Combining the analysis with the statistically significant impact results of some other factors related to debt such as short-term debt/total assets ratio (STD), cost of debt (CostD) all have negative impacts on ROA, ROE shows the ineffective use of borrowed capital of enterprises with state capital investment.
(4) The results of the impact of enterprise size (Size) on enterprise performance (according to ROE index) show that the performance of enterprises with state capital investment still depends a lot on enterprise size.
In addition, with the negative impact of the fixed asset factor (FixAss) on ROA, ROE shows that enterprises with a large proportion of fixed assets operate inefficiently. Therefore, although the operating efficiency of enterprises with state capital investment still depends a lot on the scale of the enterprise and there is a positive relationship between the scale and fixed assets of the enterprise according to the Peason correlation analysis, when restructuring state capital, it is still necessary to pay attention to divestment in industries and fields of production and business activities with a large proportion of fixed assets.
(5) A notable point is that the listing age (Age) has a negative impact on the performance of enterprises according to the ROA and ROE indicators, but has a positive impact on TobinsQ, indicating a positive expectation signal of the market about the profit potential of enterprises with state capital investment in the future. Therefore, in terms of policy, it is also necessary to be cautious when continuing to divest state capital invested in equitized SOEs that are eligible for listing on the stock market.
5.1.2. Testing the non-linear impact of ownership structure on business performance
Regression model ( Equation 1.2 ) with the addition of SquareY variable it is the square of each variable State it , InLocal it , OrLocal it , Foreign it to test the non-linear impact of each ownership component on the business performance.
Performing similar testing steps, the FEM-robust model was selected with the result that state ownership has a non-linear (U-shaped) relationship with operating efficiency according to the ROA indicator; and foreign ownership also has a non-linear (U-shaped) relationship with operating efficiency but according to the TobinsQ indicator; while there is no statistically significant non-linear relationship between domestic private ownership (including individual ownership and organizational ownership).
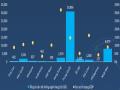
Table 5.3 Summary of test results of nonlinear relationship between ownership form and operating efficiency
VARIABLE
Department | state owned | Department | foreign ownership | |||
ROA | ROE | TobinsQ | ROA | ROE | TobinsQ | |
State | -0.0005* | -0.0004 | -0.0017 | 0.0001 | 0.0004 | 0.0002 |
(0.00) | (0.00) | (0.00) | (0.00) | (0.00) | (0.00) | |
State2 | 0.0000** | 0.0000 | 0.0000 | |||
(0.00) | (0.00) | (0.00) | ||||
InLocal | 0.0003*** | 0.0007* | 0.0013 | 0.0004*** | 0.0008** | 0.0016* |
(0.00) | (0.00) | (0.00) | (0.00) | (0.00) | (0.00) | |
OrLocal | 0.0004*** | 0.0008 | 0.0022** | 0.0004*** | 0.0008 | 0.0023** |
(0.00) | (0.00) | (0.00) | (0.00) | (0.00) | (0.00) | |
Foreign | -0.0008*** | -0.0023* | 0.0015 | -0.0013** | -0.0051 | -0.0086* |
(0.00) | (0.00) | (0.00) | (0.00) | (0.00) | (0.00) | |
Foreign2 | 0.0000 | 0.0001 | 0.0003** | |||
(0.00) | (0.00) | (0.00) | ||||
LTD | -0.2377*** | -0.4390*** | -0.2656* | -0.2386*** | -0.4392*** | -0.2691* |
(0.03) | (0.12) | (0.16) | (0.03) | (0.12) | (0.16) | |
STD | -0.1895*** | -0.5132*** | -0.0603 | -0.1919*** | -0.5174*** | -0.0747 |
(0.02) | (0.17) | (0.14) | (0.02) | (0.17) | (0.14) | |
SIZE | 0.0318*** | 0.1423*** | 0.1084** | 0.0328*** | 0.1429*** | 0.1094** |
(0.01) | (0.04) | (0.05) | (0.01) | (0.04) | (0.05) | |
FixAss | -0.0685*** | -0.2517*** | 0.0863 | -0.0689*** | -0.2539*** | 0.0778 |
(0.01) | (0.07) | (0.12) | (0.01) | (0.07) | (0.12) | |
CostD | -0.1365*** | -0.2555*** | -0.2639** | -0.1364*** | -0.2540*** | -0.2582** |
(0.04) | (0.05) | (0.13) | (0.04) | (0.05) | (0.13) | |
Liq | 0.0001 | -0.0044 | 0.0143 | 0.0001 | -0.0045 | 0.0140 |
(0.00) | (0.00) | (0.01) | (0.00) | (0.00) | (0.01) | |
Age | -0.0077*** | -0.0238*** | 0.0122** | -0.0074*** | -0.0233*** | 0.0136*** |
(0.00) | (0.00) | (0.00) | (0.00) | (0.00) | (0.00) | |
Board | 0.0002 | -0.0282 | 0.0007 | 0.0093 | -0.0179 | 0.0255 |
(0.01) | (0.03) | (0.04) | (0.01) | (0.03) | (0.04) | |
Constant | -0.6353*** | -3.2608*** | -1.9725* | -0.6649*** | -3.2795*** | -2.0006* |
(0.19) | (1.03) | (1.18) | (0.19) | (1.03) | (1.18) | |
Observations | 3.109 | 3.109 | 3,052 | 3.109 | 3.109 | 3,052 |
R-squared | 0.1957 | 0.0645 | 0.0763 | 0.1922 | 0.0651 | 0.0815 |
Number of i | 427 | 427 | 422 | 427 | 427 | 422 |
Robust standard errors in parentheses ***p<0.01, **p<0.05, *p<0.1 | ||||||
Maybe you are interested!
-

 The impact of state ownership and bank loans on investment decisions of companies in Vietnam - 18
 -
 Current Status of Ownership Structure and Performance of Vietnam's Banking Industry
 -
 The impact of online banking service quality of Vietnam Development Investment Bank on customer satisfaction in Ho Chi Minh City market - 14
 -
 The impact of state ownership and bank loans on investment decisions of companies in Vietnam - 2
 -
 Impact on Banking Operations
Note: Variable name explanation Table 4.2 Sample descriptive statistics
Discussion of results Table 5.3:
(1) Although state ownership does not have a linear impact on performance,
business dynamics but have a non-linear (U-shaped) relationship.
In theory, the explanation for the non-linear (U-shaped) relationship can be based on the underlying theory of the signaling hypothesis, with the view that the presence of state shareholders affects investors' perception of enterprise value in opposite directions, depending on the level of state ownership at the U-shaped minimum point. However, the results in Table 5.3 only show a non-linear (U-shaped) impact of state ownership on operating efficiency reflected by book value (ROA), with no statistically significant impact on the TobinsQ index; while the signaling hypothesis theory is only suitable when explaining the relationship between state ownership and operating efficiency reflected by TobinsQ, through the impact of the market. Therefore, as the underlying hypothesis argument stated in Chapter 4, this case can be explained with the argument of ownership concentration.
According to the argument on concentration of ownership: With the characteristics of state-owned enterprises with invested capital, which are usually post-equitization SOEs, the state can be a major shareholder, or the largest, so the level of state ownership (concentration) is said to have different effects on the level of control that the state exerts on the management of the enterprise; meanwhile, the private sector is not a major shareholder of enterprises because it represents many individuals and organizations. Therefore, as a major shareholder of listed enterprises, the state will play an important role in the decision-making process of enterprises. Along with that, the level of state ownership concentration helps enterprises receive benefits from government support and political connections (Yu, 2013). The presence of the state as a major shareholder can bring advantages to Vietnamese listed enterprises in accessing loans as well as projects invested by the state. Enterprises can easily obtain bank loans with state guarantees. With the influence of the state, enterprises can access loans more easily and negotiate lower interest rates (Li et al., 2009a). At the same time, with the awareness of many organizations about the reliability and potential of state-owned enterprises, these enterprises can take advantage of this advantage to achieve contracts and projects. Therefore, based on this point of view, the level of state ownership in enterprises will be proportional to business performance. However, this relationship is not linear, but according to the test results, it is a non-linear relationship (U-shaped), which means that when the state owns shares at a certain level, state ownership can positively affect the business performance of enterprises.
(2) The results of the non-linear (U-shaped) relationship between foreign ownership and operating efficiency according to the TobinsQ index show that the presence of foreign ownership at a certain level of concentration will bring positive signals to the market, with investors' confidence in advanced management capacity and modern technology. Therefore, in terms of policy, it is necessary to consider further loosening the foreign ownership ceiling in equitized SOEs.
The results of testing the linear relationship in the above sections showed that foreign ownership has a negative impact (statistically significant) on performance according to ROA and ROE indicators due to its dispersion level.
5.2. Impact of corporate performance on ownership structure
Testing the relationship between ownership structure and business performance has shown that ownership structure has an impact on business performance. To test the impact in the opposite direction from business performance to ownership structure, the researcher studied the change in ownership structure by analyzing how the form of state ownership is affected by business performance and some other factors, through testing Equation 2.


The testing was performed with the static model in turn with the Pool-OLS estimation model, the fixed-effects regression model (FEM) and the random-effects regression model (REM).
Through the results of the testing steps, the researcher selected the results of the Pool-OLS and FEM estimation models for analysis (because the Hausman test showed that the FEM model was more suitable than the REM model); summarized in Table 5.4.
Table 5.4 Summary of test results of the impact of performance on changes in state ownership structure
VARIABLE
Pool-OLS DState | FEM Dstate | Note (variable description) | |
ROA | -0.2636* | 0.2617 | Profit after tax / total assets |
(0.14) | (0.24) | ||
ROE | 0.1441*** | 0.1018* | Profit after tax / equity |
(0.05) | (0.06) | ||
TobinsQ | 0.0293* | 0.0826** | (Market capitalization + liabilities)/total assets |
(0.02) | (0.04) | ||
LTD | -0.0183 | -0.1666 | Long-term debt / total assets ratio |
(0.06) | (0.14) | ||
SIZE | 0.0082 | 0.1469*** | Firm size (logarithm of total assets) |
(0.00) | (0.04) | ||
FixAss | -0.0762** | -0.4370*** | Fixed assets / total assets ratio |
(0.03) | (0.12) | ||
OwnEq | 0.0709*** | 0.1230*** | Owner's equity / equity ratio |
(0.03) | (0.04) | ||
Rgrow | 0.0014** | 0.0004*** | Annual revenue growth |
(0.00) | (0.00) | ||
Industry | 0.0077*** | Set of 14 industry dummy variables | |
(0.00) | |||
Board | -0.2012*** | -0.6010*** | State-owned enterprises hold controlling shares |
(0.01) | (0.05) | ||
o.industry | - | ||
Constant | -0.1565 | -3.6504*** | |
(0.14) | (1.14) | ||
Observations | 2,234 | 2,234 | |
R-squared | 0.1102 | 0.2679 | |
Number of i | 420 | ||
Standard errors in parentheses ***p<0.01, **p<0.05, *p<0.1 | |||
Discussion of results Table 5.4:
* The results of testing the fixed effects regression model (FEM) give some main results and are analyzed as follows:
(i) Enterprise size (Size), the ratio of equity capital to equity (OwnEq), and annual revenue growth (Rgrow) have a positive impact on the level of state capital divestment in enterprises (Dstate) at a statistical significance level of 1%. In addition, operating efficiency according to ROE and TobinsQ indicators also have a positive impact on the level of state capital divestment, although the statistical significance level is lower (ROE has a significance level of 10%; TobinsQ has a significance level of 5%).
- Enterprise scale and the ratio of owner's equity to owner's equity have a positive impact on the level of state capital divestment in enterprises: This result is consistent with the reality of the State's policy of promoting state capital divestment in large-scale enterprises in recent times.
- Enterprises with high annual revenue growth, high ROE, and high TobinsQ market value will attract investors in the stock market, leading to changes in ownership structure (reduced proportion of state ownership).
(ii) The ratio of fixed assets of an enterprise to total assets (FixAss) has a negative impact on the level of state capital divestment in the enterprise. And the state holding a controlling stake also has a negative impact on capital divestment.
- This result shows that the State has difficulty in divesting capital from enterprises with a large proportion of fixed assets; this is a practical problem due to difficulties in valuing State assets in enterprises, especially in handling assets such as land associated with surplus value and difficult-to-quantify commercial advantages.
- The fact that the state holds a controlling stake has a negative impact on divestment can be explained by the issue of the interests of the person assigned by the state to represent state capital invested in the enterprise, especially when that interest is obtained through the right to control the enterprise.
* Comparing the results of the Pool-OLS estimation model basically gives a similar relationship; except that it does not show the impact of enterprise size on state capital divestment, but it does show that the business lines of enterprises have an impact on state capital divestment, which is completely consistent with the reality that state capital divestment is mainly based on the business lines according to the State's orientation during the research period.
5.3. Some extended studies
5.3.1. Extending the research with dynamic regression model through the method
GMM estimate
Basis for method selection: As presented in the data analysis method section, the disadvantage of panel data with a large number of observed individuals in a short time series often causes the phenomenon of heteroscedasticity; and there is also the problem of endogenous variables in the model, as well as the impact of lagged variables of the explanatory variables that bias the estimation results; then the FEM and REM estimates are no longer effective. And according to Roodman (2009), the use of the GMM estimation method will help overcome the above problems. Comparing with the case study of the PhD student shows that:
(i) First: The research panel data with 427 enterprises, observed over an 8-year time series, corresponding to over 3,000 observation units, and the phenomenon of heteroscedasticity exists as the test results analyzed in the above section.
(ii) Second: The research model has problems with endogenous variables; specifically:

As summarized in the research overview, many studies have shown the relationship between ownership structure and debt in capital structure; the relationship between business performance and capital structure (such as when a business operates effectively, the ability to mobilize loans will be higher). Therefore, in the current research model, including explanatory variables related to ownership structure and debt will potentially have endogenous problems; this has also been shown through the results of the Pearson correlation coefficient test at the 5% significance level with the existence of a correlation between the group of variables on ownership structure (State, InLocal, OrLocal, Foreign) and debt structure (LTD, STD). In addition, the problem of endogenous variables exists when the dependent variable is business performance (PF) which has an impact on capital structure.
From the above analysis, the GMM estimation method is chosen to overcome the above shortcomings. With the Hausman test results showing that the FEM model is considered more suitable than the REM model (presented above), accordingly, the researcher chooses to estimate by the 2-step D-GMM method through the xtabond2 test in Stata according to the instructions of Roodman (2009). The dependent variable is operating efficiency (PF); the endogenous independent variables (explanatory variables) that the researcher chooses in addition to the PF lag variable itself also include State, LTD with lags of order 2 or higher; the choice of lags of order 2 is based on
Explaining the impact of changes in ownership structure and long-term debt on business performance requires a certain period of time, at least over 1 year.
With the 2-step D-GMM estimation model, the model estimation results with PF operating efficiency according to ROA, ROE, TobinsQ indicators are as follows:
- ROA: Hansen test for p-value = 0.312; AR (2) test for p-value
= 0.863. Therefore, the estimated results in the D-GMM model with operating efficiency according to the ROA indicator are significant.
- ROE: Hansen test results give p-value = 0.169; AR (2) test gives p-value = 0.260. Therefore, the estimated results in the D-GMM model with operating efficiency according to ROE indicator are meaningful.
- TobinsQ: Hansen test results give p-value = 0.265; AR (2) test gives p-value = 0.646. Therefore, the estimated results in the D-GMM model with operating efficiency according to TobinsQ criterion are significant.
Table 5.5 Summary of estimation results of static and dynamic D-GMM models
VARIABLE
FE-robust ROA | D-GMM ROA | FE-robust ROE | D-GMM ROE | FE-robust TobinsQ | D-GMM TobinsQ | |
State | 0.0001 | -0.0007 | 0.0004 | -0.0019 | 0.0001 | 0.0015 |
(0.00) | (0.00) | (0.00) | (0.00) | (0.00) | (0.00) | |
InLocal | 0.0004*** | 0.0013 | 0.0007* | 0.0065 | 0.0015 | 0.0094 |
(0.00) | (0.00) | (0.00) | (0.00) | (0.00) | (0.01) | |
OrLocal | 0.0004*** | -0.0005 | 0.0008 | -0.0022 | 0.0023** | -0.0050 |
(0.00) | (0.00) | (0.00) | (0.00) | (0.00) | (0.00) | |
Foreign | -0.0008** | -0.0017 | -0.0023* | -0.0154* | 0.0015 | 0.0055 |
(0.00) | (0.00) | (0.00) | (0.01) | (0.00) | (0.02) | |
LTD | -0.2388*** | -0.3520*** | -0.4403*** | -1.1479*** | -0.2702* | 0.8035 |
(0.03) | (0.12) | (0.12) | (0.41) | (0.16) | (0.98) | |
STD | -0.1915*** | -0.2275** | -0.5156*** | -0.6246 | -0.0663 | 0.5605 |
(0.02) | (0.10) | (0.17) | (0.41) | (0.14) | (0.76) | |
SIZE | 0.0329*** | 0.0511 | 0.1436*** | 0.3886*** | 0.1118** | 0.0995 |
(0.01) | (0.03) | (0.04) | (0.13) | (0.04) | (0.29) | |
FixAss | -0.0685*** | -0.0503 | -0.2518*** | 0.0398 | 0.0868 | 0.1779 |
(0.01) | (0.06) | (0.07) | (0.32) | (0.12) | (0.48) | |
CostD | -0.1368*** | -0.0774 | -0.2558*** | 0.3572 | -0.2646** | -0.3418 |
(0.04) | (0.13) | (0.05) | (0.54) | (0.13) | (1.00) | |
Liq | 0.0000 | -0.0026 | -0.0045 | -0.0144 | 0.0142 | 0.0006 |