Chapter 2
OBJECTIVES, CONTENT AND METHODS OF RESEARCH
2.1. Research objectives
General Objective
- Study the silvicultural characteristics of forest plant communities, which is the basis for proposing technical solutions to manage, restore and develop sustainable forests in the area.
Specific goals
- Determine the composition, density of tree species, N/D distribution, biodiversity, spatial relationships of the same and different species.
- Analyze and compare statistical indicators of forest structure to assess the impact of forest disturbance on forest structure.
- Propose solutions to restore, manage and develop forest resources sustainably.
2.2 Research limitations
- Regarding space: The topic is conducted in two forest states considered primary and secondary in Cuc Phuong National Park.
- Regarding time: Collect field data from November 11, 2016 to March 31, 2017, then process field data and complete the thesis.
2.3. Research content
- Research on forest structure (density, composition, distribution of trees by diameter, species diversity, importance index) of dominant tree species.
- Analysis of spatial relationships between the same and different species of dominant tree species coexisting in two primary and secondary forest states that have been impacted at different levels.
- Proposing some solutions on sustainable forest management and development in Cuc Phuong National Park, Ninh Binh
2.4. Research methods
2.4.1. Document inheritance
Inheriting documents on natural conditions: terrain, climate, hydrology, land, forest resources, economic conditions, social conditions: population, labor, ethnic composition.
Inheriting the report on the status of forest resources and forest management and protection of Cuc Phuong National Park.
2.4.2. Field investigation
2.4.2.1. Preliminary investigation
Conduct a preliminary investigation of the entire research area to grasp the general situation of the research object in terms of terrain, topography, and forest resource characteristics to select locations for establishing OTCs and have directions for the research work.
2.4.2.2. Careful investigation
a. Create a standard cell:
Conduct standard plot establishment using the typical, temporary standard plot (OTC) method on the evergreen broadleaf forest status in the core zone of Cuc Phuong National Park. The standard plot must represent the forest stand under study in terms of ecological conditions, community structure and growth status.
Establish 03 OTCs on 02 forest states (01 OTC in primary state and 02 OTCs in secondary state). The area of each standard plot is 1 ha (100 m × 100 m), the plot location is determined by GPS locator. Each OTC is divided into a grid of 100 measurement sub-plots with an area of 100 m 2 (10 m × 10 m) using wooden stakes and nylon rope. In each measurement sub-plot, the investigation steps are carried out as follows:
- Mark all trees in the measurement box.
- Identify species (for species with unknown names, take samples, take photos and number them).
- Measure the breast height circumference of all trees with D 1.3 ≥ 2.5 cm at 1.3 m using a tape measure with an accuracy of 0.5 cm, thereby determining the breast height diameter.
- Determine the relative position (x, y) of the tree in the measurement plot using a laser distance meter with an accuracy of 0.1 cm and a compass.
All measurement data is recorded according to the following form 2.1:
Form 2.1: Forest tree survey form
Location......... Height......... Date of investigation...........
Forest status......... Slope...... Investigator........
OTC number........ Slope direction..........
TT Metering Cell
Tree status | Tree name | Circumference (cm) | Tree position (m) | Note | ||
X | Y | |||||
1 | 1 | |||||
2 | ||||||
........ | ||||||
2 | ||||||
3 | ||||||
Maybe you are interested!
-
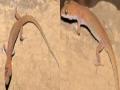
 Study on species diversity and genetic relationships of the family Gekkonidae in some limestone mountain areas in the Lao People's Democratic Republic - 22
 -
 Solutions for managing and exploiting ecotourism in Vietnam's national parks towards sustainable development: Case study of Cuc Phuong National Park - 20
 -
 Developing community tourism in Cuc Phuong National Park - 11
 -
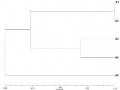 Phylogenetic Tree Showing Relationships of Vsv Species in 5 Study Samples A1, A2, A3, A4 and A5.
 -
 Functions and Tasks of Cuc Phuong National Park
2.4.3. Internal affairs
2.4.3.1. Study on forest structure characteristics
a. Determine the composition and role of tree species in the community
Determine the composition formula according to the number of trees:
+ Step 1: Collect data on the upper tree layer in all OTCs by species in each state and the number of individuals of each species.
+ Step 2: Determine the total number of tree species and total number of individuals in the OTCs of each state.
+ Step 3: Calculate the average number of individuals of a species according to the formula
 =
=  (2.1)
(2.1)
In there:
 : Average number of individuals of each species N: Total number of individuals of the species
m: Total number of species
+ Step 4: Determine the number of species and species names participating in the composition formula. Species with the number of trees ≥  participate in the composition formula.
+ Step 5: Determine the composition coefficient of each species according to the formula:

(2.2)
In there:
Ki is the HSTT of species i
X i is the number of individuals of species i
N is the number of individuals of all species
+ Step 6: Write the composition formula
Species with Ki > 0.5 are written in the composition formula. Species with large composition coefficient are written first, small ones are written later.
Note: When writing the CTTT of species with 0.5≥ Ki<0.9, use the (+) sign; species with Ki<0.5 use the (-) sign.
Determine the composition according to the important index IV% ( Important Value )
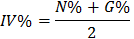 (2.3)
(2.3)
In there:
IV%: The importance index of species in the community N% is the relative density (N%=Ni/N)
G% is the relative cross-sectional area of the tree trunk (G%=Gi/G) Ni and Gi are the density and total cross-sectional area of species i
Based on the IV% results above:
+ If a species has IV% ≥ 5%, that species has ecological significance in the community.
+ If the group has less than 10 species with ΣIV% ≥40%, it will be the dominant species group and that species group will be used to name the community.
2.4.3.2. Biodiversity of the community
To compare the diversity of large trees, the topic uses the following two diversity indices:
This:
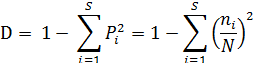
a. Simpson's species diversity index (D). This index is used to assess the diversity of species in a community. The D index is calculated according to the formula:
(2.4)
In there:
S: Number of tree species encountered
N: Total number of individuals of tree species
P i : is the relative abundance of species i;
Pi = where  n i is the number of individuals of the ith species ( i = 1 ÷ S ).
b. Shannon – Weiner H' index. The index is used to measure the diversity of tree species for each forest state. The H' index is calculated according to the formula:
H' = - ∑[(ni/N) * log(ni/N)] (2.5)
In there:
N: Total number of trees in the standard plot ni: Number of trees of species i
2.4.3.3. Spatial relationships between same and different species of forest trees
Spatial point pattern analysis methods have been proposed to understand the arrangement of points in space (Ripley 1976; Stoyan &
Stoyan 1994[24]; Diggle 2003). For example, based on the location of the tree (x,y coordinates) and using the Ripley' K function or the pair-correlation function to describe the properties of the point pattern over a range of distances (Stoyan & Stoyan 1994[24]; Illian et al. 2008). In these methods, the null model is used to describe the null hypothesis of the point pattern and after the simulation process is compared with the observed data (Diggle 2003; Wiegand & Moloney 2004). The deviation between the experimental data and the null hypothesis is used to describe the pattern of the data and predict the processes or mechanisms that have adjusted the observed model.
Pairwise correlation function
The pairwise correlation function g(r) describes the spatial arrangement of points in a range of distances (Stoyan & Stoyan 1994)[24]. Based on the distance between pairs of points, the function g(r) describes the normalized density at a given distance r and is the expected density of points at a distance r from any point (Stoyan & Stoyan 1994)[24]. For a single type of point (e.g., the same tree species or a group of trees), we have the univariate pairwise correlation function - g11(r), which is also the derivative of the Ripley' K function (Ripley 1976):
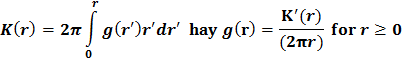
Thus, g11(r) = 1 indicates a completely random distribution, g11(r) > 1 indicates a clustered distribution, g11(r) < 1 indicates a uniform distribution at distance r. The bivariate correlation function g12(r) is used to analyze the spatial relationship between two different groups of points (for example, two different tree species). g12(r) is the expected density of points in group 2 at distance r from any point in group 1. g12(r) = 1 indicates that the relationship is independent (no interaction), g12(r) > 1 indicates that the relationship is reciprocal, and g12(r) < 1 indicates that the relationship is competitive at distance r.
Null model (Theoretical model – null model)
Complete spatial randomness (CSR): is a model with the assumption that there are no interactions between points in the model. Heterogeneous environments (e.g., exposed rocks, creeks, streams, etc.) will affect the spatial distribution of trees. We tested habitat homogeneity based on the spatial distribution of all mature trees (dbh ≥ 15cm), because mature trees have the ability to cover all available areas and have undergone natural selection. Thus, the quality of heterogeneous habitats will be reflected through the heterogeneous distribution of mature trees (Getzin et al. 2008)[18].
Independence: used as a null model to test the relationship between two different tree species. It is assumed that the point models of the two tree species are generated by two different processes and during the simulation the entire second point model will be moved randomly around the first point model. Thus, there is no interaction between the two types of points and there is no interaction between the two models.
Weak on all 03 OTCs Spatial relationship of tree species within species: using non-CSR model with function g11(r) to study the spatial distribution of main tree species
Interspecific spatial relationships of tree species: apply non-independence model to function g12(r) to study pairwise spatial relationships of major tree species on each OTC.
In all spatial point model analyses, 199 Monte Carlo simulations were performed and the 5th largest and 5th smallest values were used to construct approximately 95% confidence intervals. The statistically significant difference from the null hypothesis is that the experimental model falls outside the confidence interval. All of the above analyses were performed using Programita software (http://programita.org/)
Chapter 3
NATURAL - SOCIO-ECONOMIC CONDITIONS OF THE STUDY AREA
3.1. Natural conditions
3.1.1. Geographical location
The study area includes the entire area of 22,200 ha of Cuc Phuong National Park and about 15,000 ha of surrounding localities in the buffer zone. Cuc Phuong is located on the border of 3 provinces: Ninh Binh, Hoa Binh and Thanh Hoa. The study area is estimated to be 50 km long and 30 km wide. The geographical coordinates of Cuc Phuong National Park are from 20 14' to 20 24' north latitude and 105 29' to 105 44' east longitude.
Figure 3.1: Map of Cuc Phuong National Park
3.1.2. Terrain
Cuc Phuong is located in the southeast of the Tam Diep mountain range, a limestone mountain range running from Son La province in the northwest. This limestone mountain range has the advantage of being a natural karst type, formed in the ocean about 200 years ago.