- If the genetic similarity coefficient between samples or species is > 0.92, they are considered to be very close genetically and can be considered one; it is very difficult to distinguish them genetically.
- If the genetic similarity coefficient < 0.89 is considered to be genetically different, it is possible to distinguish between the studied samples.
- If the genetic similarity coefficient is from 0.75÷0.85, they are considered genetically close but have significant differences.
- If the similarity coefficient is < 0.60, there are clear differences between species and it is easy to distinguish between them;
Maybe you are interested!
-

 Phylogenetic Tree of Nucleotide Sequence of Gen M of CC Strain IA/h5N1 Clade 7 (Established by Neighbo-Joining Analysis Using Mega 5 Software, Gi T
 -
 Research on the treatment of seafood wastewater by electrocoagulation method combined with USBF - 19 tank
 -
 Chart Showing Growth in Deposits and Lending of Commercial Banks in Ho Chi Minh City in the First 7 Months of the Year.
 -
 Guarantee in loan relationships at credit institutions - 1
 -
 Study on natural regeneration characteristics of Lim xet tree species Peltophorum tonkinensis A.Chev in Lam Binh district, Tuyen Quang province - 13
- If the similarity coefficient is < 0.35, there are genetic differences between the samples;
- If the similarity coefficient is < 0.2, the two samples are very different genetically and can be easily distinguished as two completely different genetically distinct species.
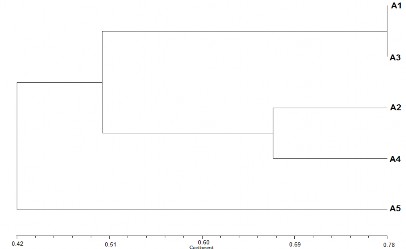
Figure 3.18. Phylogenetic tree showing the relationship of the microorganisms in the 5 study samples A1, A2, A3, A4 and A5.
The results presented in Figure 3.18 show that the similarity coefficient of the 5 studied samples ranged from 0.42 to 0.78. The phylogenetic tree was divided into 2 branches, the first branch was the microbial community of sample A5 (with a similarity coefficient of 0.42), which was genetically very different from the microbial communities of the remaining samples (A1, A2, A3 and A4). The second branch was divided into 2 sub-branches, the first sub-branch was the microbial communities of samples A1 and A3 (with a similarity coefficient of 0.78) which were considered quite close and similar but still had genetic differences and could be
distinguishable. The second sub-branch is separated from the two small branches which are the microbial communities of samples A2 and A4 (with similarity coefficient < 0.69) and have clear differences and can be easily distinguished between the samples.
Thus, the study analyzed the genetic diversity of DNA by using the DNA denaturation electrophoresis technique with the primer pair p338F and p518R of 5 research samples. The microbial communities of these 5 samples all had high genetic diversity. The microbial communities of samples A1 and A3 had a closer genetic relationship than the microbial communities of the remaining samples A2, A4 and A5 (the highest similarity coefficient was 0.78). Sample A5 had a much different microbial community compared to samples A1, A2, A3 and A4 (the lowest similarity coefficient was 0.42). Samples A1 and A3 had quite similar microbial populations. The results of the genetic polymorphism analysis of the experimental samples A1, A2, A3, A4 and A5 were similar to the analysis of the diversity indexes H' and J'.
Conclude:
- The microbial community in formula A5 had a different diversity compared to the remaining formulas, with a similarity coefficient of 0.42, genetically different from the microbial community of the remaining samples (A1, A2, A3 and A4).
- Samples A1 and A3 have quite similar microbial populations with the highest similarity coefficient among the 5 treated samples being 0.78.
- Based on the Shannon diversity index H' and the corresponding Pielou index J', the diversity of microorganisms in all 5 experimental formulas gradually decreased in the direction A5= A3>A1>A4>A2. In which, the microorganisms in samples A3 and A5 are almost similar because they have the same index H' of 0.359 and J' of 0.113 and are much more diverse than samples A1 (H'- 0.327; J'- 0.103), A4 (H'- 0.260; J' - 0.082) and A2 (H'- 0.207; J'- 0.065). Two
Samples A3 and A5 had 5 common species of microorganisms for both formulas. In addition, in both samples A3 and A5, there were also 2 more different species of microorganisms in these 2 experimental formulas.
- Sample A1 and sample A3 have the most similar Band positions on the DGGE electrophoresis compared to the remaining samples, showing that the VSV population in samples A1 and A3 are relatively similar. However, sample A3 has 2 more bands at different positions, which means that
The microorganism population in sample A3 was more diverse and contained two additional microorganism species compared to sample A1.
From the results of the analysis of the diversity of microorganisms above, it was shown that in the experimental formulas (A1, A2, A3) when adding the microbial product Sagi Bio 2, there was a common appearance of some microorganisms that appeared together in Band B1.
In experimental formulas A1 and A3, there are similarities in Band positions, because the conditions are similar such as being supplied with air, supplemented with Sagi Bio2 microbiological preparation, only the microbiological carrier material is different: A1 is improved EBB material and A3 is a sponge. Therefore, Band 5 only appears in both of these experimental formulas.
In formula A5, there is the greatest diversity of microorganisms compared to the experimental formulas, which can be explained by the fact that wastewater contains many groups of microorganisms. When they encounter suitable environmental conditions, they will grow and develop, so the diversity of microorganisms is high. In samples A1, A2 and A3, it may be because the strains of microorganisms added from the Sagi Bio 2 microbial product inhibited or competed for nutrients with the microorganisms available in wastewater, thus leading to some microorganisms being unable to develop.
3.2.5. Experimental results of using improved EBB for wastewater treatment in the laboratory
3.2.5.1. Results of evaluating COD treatment performance of improved EBB material
To evaluate the effect of influent water flow rate on COD removal capacity was studied by varying the influent flow rate to 0.5 L/hr; 1 L/hr; 2 L/hr; 3 L/hr; 4 L/hr and 5 L/hr. The results obtained are presented in Figure 3.19
– 3.24 .
(i) With flow rate of 0.5 liters/hour
500
COD concentration, mg/L
450
400
350
300
250
200
150
100
50
0
COD in COD out COD treatment efficiency


0 5 10 15 20
Time, date
100
Processing efficiency %
90
80
70
60
50
40
30
20
10
0
Figure 3.19. COD treatment efficiency with flow rate of 0.5 L/hour
The results of COD treatment efficiency evaluation with an inlet flow rate of 0.5 L/hour are shown in Figure 3.19. The inlet COD concentration ranged from 200 mg/L to 350 mg/L, the average value was 295 mg/L, and the retention time in the system was 24 hours. At the flow rate of 0.5 L/hour, the COD treatment efficiency of the system had an average value of 84%, the highest COD treatment efficiency was 98%, and the lowest was 65%. The experimental period lasted 20 days to monitor the stability of the system. Initially, the COD treatment efficiency was not high, but on the third day of the experiment, the COD treatment efficiency began to reach a high level and remained relatively stable throughout the experiment. The output COD was relatively stable and had an average value of about 41 mg/L.
(ii) With flow rate of 1 L/hour
COD concentration, mg/L
500
450
400
350
300
250
200
150
100
50
0
COD in COD out COD treatment efficiency


0 5 10 15 20
Time, date
Figure 3.20. COD treatment efficiency with flow rate of 1 L/hour
100
Processing efficiency %
90
80
70
60
50
40
30
20
10
0
The results of Figure 3.20 show that, at a flow rate of 1 L/hour, corresponding to the retention time
After 12 hours, the COD treatment efficiency through the system has an average value of 77%. The lowest COD treatment efficiency is 75%, the highest is 80%. The average output COD value is about 59 mg/L. Similar to the experiment with the flow rate of 0.5 L/hour, the experimental operation time lasts 20 days to monitor the stability of the system. The COD treatment efficiency decreases when increasing the inlet flow rate to 1 L/hour compared to the 0.5 L/hour mode due to the reduction of water retention time in the system, the contact time between the material and microorganisms in the system with the pollutant is shorter.
(iii) With flow rate of 2 L/hour
1400
COD concentration, mg/L
1200
1000
800
600
400
200
0
COD in COA out COD treatment efficiency


0 2 4 6 8 10 12 14 16 18 20
Time, date
Figure 3.21. COD treatment efficiency with flow rate of 2 L/hour
100
Processing efficiency %
90
80
70
60
50
40
30
20
10
0
Figure 3.22 shows that, at a flow rate of 2 L/hour, corresponding to a retention time of 6 hours, the COD treatment efficiency through the system has an average value of 72%. The highest COD treatment efficiency is 83%, the lowest is 68%. The average output COD value is about 60 mg/L. Although the COD treatment efficiency decreased, the system still maintained stability throughout the 20-day experimental period.
(iv) With flow rate of 3 L/hour
Figure 3.22 shows that, at a flow rate of 3 L/hour, corresponding to a retention time of 4 hours, the COD treatment efficiency through the system has an average value of 73%. The highest COD treatment efficiency is 81%, the lowest is 67%. The average output COD value is about 60 mg/L. It can be clearly seen that at a flow rate of 3 L/hour, the COD treatment efficiency is equivalent to the treatment efficiency of a flow rate of 2 L/hour. This result shows that the reduction in retention time from 6 to 4 hours does not greatly affect the decomposition process of organic matter of the material.
Improved EBB data.
500
COD concentration, mg.l
450
400
350
300
250
200
150
100
50
0
COD in COD out COD treatment efficiency


0 2 4 6 8 10 12 14 16
Time, date
Figure 3.22. COD treatment efficiency with flow rate of 3 L/hour
100
Processing efficiency %
90
80
70
60
50
40
30
20
10
0
(v) With flow rate of 4 L/hour
500
450
COD concentration. mg/L
400
350
300
250
200
150
100
50
0
COD in COD out COD treatment efficiency


0 2 4 6 8 10 12 14 16
Time, date
Figure 3.23. COD treatment efficiency with flow rate of 4 L/hour
100
Processing efficiency %
90
80
70
60
50
40
30
20
10
0
Figure 3.23 shows that, at a flow rate of 4 L/hour, corresponding to a retention time of 3 hours, the average COD treatment efficiency through the system is 35%. The highest COD treatment efficiency is 40%, the lowest is 20%. The average output COD value is about 167 mg/L.
Increasing the water flow to 4 L/hour, the COD treatment efficiency decreased significantly compared to previous modes. This shows that when switching to this mode, the short retention time is not enough time for the COD treatment process of microorganisms in the improved EBB material.
(vi) With flow rate of 5 L/hour
500
COD concentration, mg/L
450
400
350
300
250
200
150
100
50
0
COD in COD out XL Performance


0 2 4 6 8 10 12 14 16 18
Time, date
Figure 3.24. COD treatment efficiency with flow rate of 5 L/hour
100
90
Processing efficiency %
80
70
60
50
40
30
20
10
0
Figure 3.24 shows that, at the flow rate of 5 L/hour, corresponding to the retention time of 2.4 hours, the COD treatment efficiency through the system is relatively low, with an average value of 11%. The highest COD treatment efficiency is 16%, the lowest is 7%. The average output COD value is about 235 mg/L. In this experimental mode, the COD treatment efficiency is very low, due to the high inlet flow rate leading to a short water retention time. This result is completely consistent with the theory: when the flow rate increases, the retention time is short, leading to a short time for microorganisms to decompose pollutants, so the COD treatment efficiency is not high.
The study of the influence of inlet flow rate on COD treatment efficiency was conducted for a period of more than 100 days. The inlet flow rate has a great influence on COD treatment efficiency, COD treatment efficiency gradually decreases when the inlet flow rate increases. The inverse relationship between inlet flow rate and treatment efficiency is due to the contact time between the solute and the adsorbent material. At high inlet flow rate, the contact time decreases, the time for COD diffusion into the pores of the improved EBB material and the time for adsorption to the surface sites of the material decreases. On the contrary, when the inlet flow rate is small, the contact time increases, diffusion in the improved EBB material becomes more effective due to the larger mass transfer area. In this study, COD treatment efficiency follows the order: 0.5 L/hour > 1.0 L/hour > 2.0 L/hour > 3 L/hour > 4.0 L/hour
> 5.0 L/hour. In the first two modes, the wastewater flow is 0.5 L/hour and 1 L/hour, the retention time is 24 hours and 12 hours respectively, the COD treatment efficiency is relatively high, equivalent to 84
% and 77%. The results at 2 L/hr and 3 L/hr showed that the COD removal efficiency ranged from 35% to 72% at retention times of 6 and 4 hours. At 4 L/hr and 5 L/hr, the COD removal efficiency decreased significantly. COD removal in this system occurred by both adsorption and biodegradation mechanisms.
3.2.5.2. Results of evaluating the ammonia treatment performance of improved EBB material
(i) With flow rate mode 0.5 L/hour
The concentration of NH 4 + inflow fluctuates between 30÷65 mg/L. At the flow rate of 0.5 L/hour ( Figure 3.25 ) corresponding to the retention time of 24 hours, the average Ammonium treatment efficiency of the system is 72%, the highest Ammonium treatment efficiency is 82%, the lowest is 66%. The average Ammonium output value is 12 mg/L.


Ammonium in Ammonium out Ammonium treatment efficiency
Ammonium concentration, mg/L
90 90
Processing efficiency %
80 80
70 70
60 60
50 50
40 40
30 30
20 20
10 10
0 0
0 5 10 15 20
Time, date
Figure 3.25. Ammonium treatment efficiency with flow rate of 0.5 L/hour
The experimental period lasted 20 days to monitor the stability of the system. Ammonium fluctuated greatly but the system operated relatively stably and always maintained a high treatment efficiency. In this mode, the contact time was large enough so that Ammonium was retained and adsorbed at different locations of the improved EBB material.
(ii) With flow rate mode 1 L/hour