- Rights and entitlements linked to access to systems : rights and entitlements to use critical resources and access urban systems need to be clear. Institutions that differentially restrict rights and entitlements can limit access to systems or services and thus reduce resilience for marginalized groups.
- Decision-making : decision-making, especially when it comes to urban development and urban system management, should adhere to the widely accepted principles of good governance: transparency, accountability and responsiveness. This includes recognition of the most affected groups and ensuring that they have a legitimate stake in decision-making.
- Information flow: households, businesses, community organisations and decision-making bodies should be provided with ready access to reliable and meaningful information to enable assessment of risks and vulnerabilities, and to access options for adaptation.
- The application of new knowledge : institutions facilitate generations, exchange
exchange and apply new knowledge to enhance resilience
Maybe you are interested!
-

 Evaluation of Research Situation and Issues Raised for the Thesis
 -
 Methods of Organizing Life Values Education Activities
 -
 Evaluation of Online Marketing Activities of Philip Entertainment Media and Entertainment Company Limited - 1
 -
 Management Status of Tcm Results Evaluation Through NCBH Form Table 2.9: Current Status of Evaluation of Professional Team Performance Results Through Form
 -
 Methods of Exploiting Geographical Knowledge from Maps
An important right that can enhance resilience is the right of groups to self-organize and engage in collective choice mechanisms [Tyler and Markus, 2012 citing other authors] for the purpose of responding to climate change events (e.g. to improve drainage systems, or to deliver training for disaster preparedness).
2.3. Research method
2.3.1 Secondary data collection method
Relevant information and documents such as information on hydrometeorology, legal documents related to climate change of the province/city, development plans, socio-economic development planning; urban development planning; programs and projects related to climate change; studies related to climate change ; reports analyzing climate change trends such as temperature, rainfall, extreme phenomena, and other
Information on resources and environment; Annual reports on agricultural production in terms of area, productivity, crop calendar, rice and corn varieties - have been collected at the following relevant agencies:
Steering Committee for Disaster Prevention and Control and Search and Rescue of Lao Cai province and Lao Cai city.
Lao Cai Provincial Statistical Office; Lao Cai City Statistical Office
Departments/sectors of Lao Cai province: Department of Agriculture and Rural Development; Department of Natural Resources and Environment; Department of Construction; Department of Transport...
Lao Cai Hydrometeorological Station.
2.3.2 Primary data collection methods
a) Investigation and survey methods
This method is used to collect practical information, confirming the accuracy of the collected information. The study conducted a survey in 01 representative commune of the assessment area. The method uses a rapid assessment tool with community participation to collect accurate information from the community, people's aspirations on the situation of natural disasters, socio-economics and adaptability. To implement this method: (1) The study collected information on natural conditions, socio-economics, urban planning and infrastructure, natural disaster developments, climate change, and TDBTT in Lao Cai city and Cam Duong commune; (2) Organized community group discussions (Resettlement groups, Vulnerable groups, Poor groups, Ethnic minorities); (3) Interviewed 17 households/individuals from many social sectors, focusing on the elderly and village chiefs.
Some techniques applied in the process of surveying and investigating specifically include:
- Organizational analysis (Venn diagram): Through discussion groups at commune and ward levels to learn about organizations involved in climate change adaptation activities at the local level to examine their perceptions of the role and effectiveness of relevant organizations in supporting people to adapt to climate change.
- Historical information : Discuss with a group of people who have lived in the area for a long time to recall past extreme weather events/natural disasters (no time limit). Historical information is collected about the types of natural disasters that have occurred in the area, the time of the disaster, the cause, and the damage/consequences.
- Cross-sectional survey: used to survey the entire area to study the landscape, the interaction between the natural environment and human activities in terms of space and time. The cross-sectional diagram shows more clearly the cause (natural or human) of damage when there is a natural disaster .
- Crop calendar: This method is mainly used in communes/wards with many agricultural activities such as Cam Duong commune... organizing groups including neighborhood leaders, farmers' associations, and women to participate in creating crop calendars and natural disaster calendars. This calendar shows the types of crops, planting and harvesting times, and times of natural disasters. This crop calendar also shows the times when crops/agricultural production activities are vulnerable to natural disasters.
- Directed interview: this tool is used to conduct group and individual interviews with pre-prepared sets of questions. Group interviews are mainly to learn about the local socio-economic and environmental situation, the current status and trends of natural disasters, community adaptation activities, and policies to support prevention and adaptation. Individual interviews are conducted with people directly affected by natural disasters to learn about government support and people's aspirations.
- Mapping: Create a spatial overview map of key features in the assessment area (by village/residential group). Facilitate information exchange and encourage people to participate in discussions on important community issues.
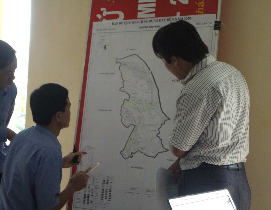
Figure 2.6a. Using cross-sectional diagrams in assessing TDBTT in Cam Duong commune, Lao Cai city
Figure 2.6b. Using the map overlap method in assessing the TDBTT of Lao Cai city
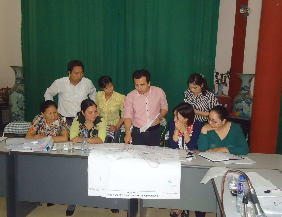
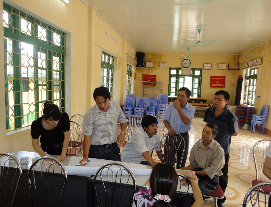
Figure 2.6c. Using the map overlap method
Figure 2.6. Some methods used in evaluating TDBTT
b) Key information interview method
This method is applied to information that cannot be collected from the above methods. Conduct interviews with a number of officials from agencies, departments, branches, political and social organizations and localities in Lao Cai city to collect and verify additional information on policies and institutions related to the industry and field.
2.4. Time scope of the research topic
The study focuses on analyzing documents about Lao Cai city, including information on hydrometeorology and natural disasters in the city from 1994 to 2013;
Research and study the impact of climate change and natural disasters in Cam commune
Road.
CHAPTER 3
RESEARCH RESULTS AND DISCUSSION
This study focuses on analyzing the TDBTT with climate change of Cam Duong in the following aspects: (a) Infrastructure; (b) Livelihoods (production, housing); (c) Capacity (Information, organization, policy). Based on the TDBTT analysis, the study makes some recommendations to enhance the resilience of Cam Duong commune, Lao Cai city.
3.1. Manifestations of climate change
3.1.1. Temperature
The temperature difference in Cam Duong commune and the city is not large. The average temperature is 22.8 0 C with an annual temperature fluctuation amplitude of 11 o C. The average temperature of the coldest month is 16 o C. The hottest months of the year are June, July and September.
8. In 2007, the average temperature reached 23.65 0 C because the average air temperature in the months of April, May, June, July, August, and September were all higher than the average temperature of the year.
The temperature trend of Lao Cai city in the period 1994 - 2013 had a more sudden increase with an increase of about 0.2-0.25 0 C/decade and had many unusual manifestations (Figure 3.1).
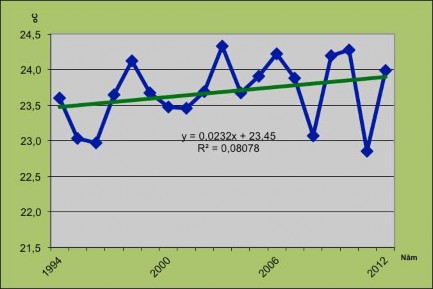
Figure 3.1. Average temperature trend of Lao Cai city in the period 1994-2013
Source: Lao Cai Hydrometeorological Center
Heat waves tend to appear more frequently, maximum temperatures appear more frequently, both at approximately and reaching historical levels. There have been and are still unusual heat waves, the time of appearance is much different from the annual rule. There are some records of severe to extremely severe heat waves, the later records surpass the previous records.
Although there is an increasing trend, there are also years when the average temperature increases sharply or decreases suddenly. The years 1998, 2003 and 2011 were recorded as years with high average temperatures.
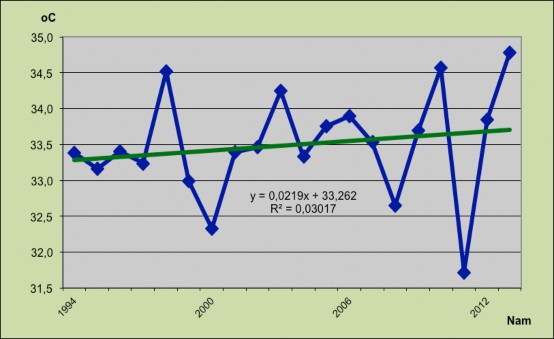
Figure 3.2. Trend of maximum temperature in Lao Cai city during the period 1994 - 2013
Source: Lao Cai Province Center for Hydro-Meteorological Forecasting
During the summer, heat waves are prolonged, severe to extremely severe. For example, the heat wave in May 2012, with a maximum temperature of 40.3°C lasting continuously for 7 days, was considered the hottest heat wave in the past 55 years .
Winters tend to warm and unusually warm winters have occurred (Figure 3.3). The average temperature is unusually high, with some years of hot weather.
came very early like the heat wave at the end of February 2010. This is the first time recorded
The heat wave hits in February with temperatures reaching 35°C.
The frequency and duration of severe cold have decreased compared to previous decades. However, there has been an increase in extreme weather phenomena, which is that these abnormally warm spells are interspersed with severe cold spells. For example, the cold spell in January-February 2008 lasted for 40 days, with the average temperature in Lao Cai dropping to 7.6°C, causing thousands of livestock and poultry to freeze to death.
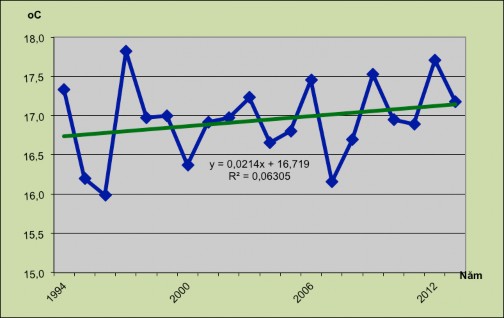
Figure 3.3. Trend of minimum temperature in Lao Cai city during the period 1994 - 2013
Source: Lao Cai Province Center for Hydro-Meteorological Forecasting
In recent times, according to assessments, many minimum and maximum temperature values have been broken in terms of rules and time. Extreme weather phenomena in winter have also occurred more unusually than before, with severe cold coming early (in November) or ending late (in March). The situation of winter shortening and summer lengthening is taking place, the rule of four seasons, spring, summer, autumn and winter, is broken. Currently, weather conditions are changing in a trend of leaving only two hot and cold seasons, spring and autumn sometimes appear but with a short time and are not as clear as before.
3.1.2. Rainfall
The average rainfall of Lao Cai city is about 1620-1,720mm. Monitoring data at the Lao Cai city meteorological station from 1994 to 2013 shows that the rainfall trend in the past 20 years has tended to decrease in volume, but increase in frequency and intensity (Figure 3.4). The distribution of rainfall between the dry and rainy seasons has shifted towards decreasing in the dry season and increasing in the rainy season. Periods of little or no rain last long (up to 40-50 days), and unusually heavy rains cause floods in winter. The rainfall on November 30, 2011 reached 103.4mm.
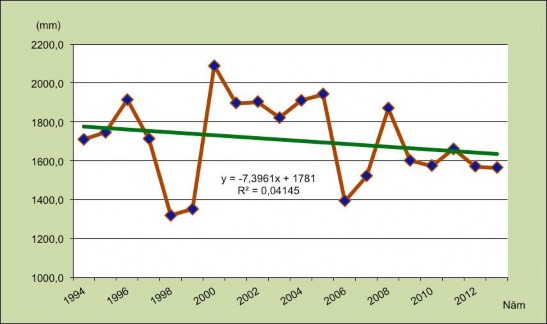
Figure 3.4. Total annual rainfall in Lao Cai city during the period 1994 - 2013
Source: Lao Cai Province Center for Hydro-Meteorological Forecasting
During the rainy season from April to September, rainfall accounts for about 82% of the total annual rainfall and fluctuates between 1,380-1,400mm. The year 2000 was identified as the year with the lowest rainfall in the rainy season, reaching only about 1,030mm. 2007 and 2012 were also recorded as years with low rainfall, about
1,210 mm and 1,260 mm. Rainfall in the rainy season in 2001 and 2005 was higher than average, reaching 1,530 mm and 1,692 mm respectively.