1g Dry sample
6 0 C
24h
50ml 0.5M HCl
Centrifuge 2000
(rpm)
Decant the above solution.
Extract
Filter (0.45 µm)
Extract
5.5 ml CH 2 Cl 2
shake 15 minutes
Organic phase
10ml n-hexane (3 times)
Water phase
5ml
CH 2 Cl 2
(2 times)
Aqueous extract
Extract Aqueous Phase
shake 5 minutes
shake 5 minutes
DPCSV
LiClO 4 /EtOH HCl
Identify DMDSe
cool 6 0 C
DPCSV
Se-Cyst
Se(IV)
Figure 3.81: Schematic diagram of extraction and determination of some forms of selenium in seafood samples
3.6.2.2. Application of real sample analysis
Weigh accurately 1g of freeze-dried sample, add 50ml of 0.5M HCl and extract at a temperature of about 60C . After 24 hours, take the sample out and pour it into a 50ml centrifuge tube, centrifuge for 20 minutes at 2000 rpm. Decant the solution and filter through a 0.45µm filter to obtain the extract. Add 5.5ml of dichloromethane to the extract, shake for 15 minutes and leave it in the refrigerator to wait for the layers to separate. Separate the organic phase (CH 2 Cl 2 phase ) and the water phase. Continue to process the phases as follows:
- Organic phase
Take 5ml of the organic phase extract, add 0.3ml of 2M HCl, 1ml of 2M LiClO 4 /EtOH and make up to 10ml with ethanol. Cool the mixture to about 60C. Using the optimal measurement conditions given in Table 3.28, perform the quantification by the standard addition method.
To study the recovery of DMDSe, prepare the sample similarly but add 50µl of DMDSe 1000µg/l to each initial sample, then in 50ml of HCl solution to extract the sample, the concentration of DMDSe added is 1.0µg/l. Extraction and quantification are carried out similarly to real samples. The results obtained (see appendix) are used to calculate the recovery according to the formula (*).
- Mix water
Take all the aqueous extract, add 10ml of n-hexane and shake for 5 minutes (3 times) to remove fat. Separate the n-hexane phase, collect the aqueous extract, continue to add 5ml of CH 2 Cl 2 and shake for 5 minutes (2 times) to remove protein. Separate the CH 2 Cl 2 phase, collect the aqueous extract. Pipette 1ml of the aqueous extract into a 10ml volumetric flask, add 1ml of 1M HCl and make up to the mark with ultrapure distilled water. Using the optimal recording conditions given in Table 3.14, perform quantification by the standard addition method.
To study the recovery of Se-Cyst, prepare the sample similarly but add 100µl of Se-Cyst 100,000µg/l to each initial sample, then in 50ml of HCl solution to extract the sample, the concentration of Se-Cyst added is 200µg/l. Proceed with extraction and determination.
similar quantity to the real sample. The research results obtained (see appendix),
used to calculate recovery according to formula (*).
The sample analysis results are shown in figures 3.82 to 3.90.
* Potato fish sample
DMDSe
c = 3.733 µg/L
+/- 0.006 µg/L (0.16%)
- 60.0n
- 50.0n
- 40.0n
- 30.0n
- 20.0n
- 10.0n
3.7e-006
0
-4 .00e --62 .00e -6 0 2 .00e-64.00 e-66.00e-6
c (g/L)
- Organic phase
I (A)
Figure 3.82: DPCSV curve and additional standard graph to determine DMDSe form in Khoai fish sample
We repeated the extraction with 5.5 ml of dichloromethane again and measured DPCSV to determine the form of DMDSe (Figure 3.83). The research results showed that, although the electrolysis enrichment time was increased, the DMDSe peak still did not appear.
Figure 3.83: DPCSV curve to determine DMDSe form in Khoai fish sample (second extraction)
- Mix water
Se-cyst
c = 21.045 µg/L
+/- 1.034 µg/L (4.91%)
-2.00e-5-1.00e-5 0 1.00e-52.00e-53.00e-5
c (g/L)
The research results showed that the Khoai fish sample was fatter than other seafood samples, so we had to extract it 4 times with n-hexane to remove the fat.
-50.0n
-40.0n
-30.0n
-20.0n
-10.0n
-2.1e-005
0 |
Maybe you are interested!
-

 Illustration of Linkage Forms of Textile and Garment Enterprises in Textile and Garment Industry in China
 -
 Internship report at Vietnam Institute of Industrial Chemistry - 1
 -
 Dpcsv Curve And Standard Addition Graph For Determination Of Selenium Form In Aqueous Phase After Defatting With 5ml N-Hexane (1 Time)
 -
 Impact of promotional forms on the business activities of Mobifone mobile telecommunications services of VNPT Posts and Telecommunications Group - 17
 -
 Determination of Charges for Murder in Special Circumstances
I (A)
Figure 3.84: DPCSV curve and standard addition graph to determine Se-Cyst form in Khoai fish sample
On the DPCSV line, the Se-Cyst peak is very clear while the Se(IV) peak has a small intensity next to the Se-Cyst peak. Therefore, we measured Se(IV) separately with a more negative electrolysis potential (-0.3V) than when measuring together (-0.2V) to observe a clearer and more beautiful spectrum. The research results are shown in Figure 3.85.
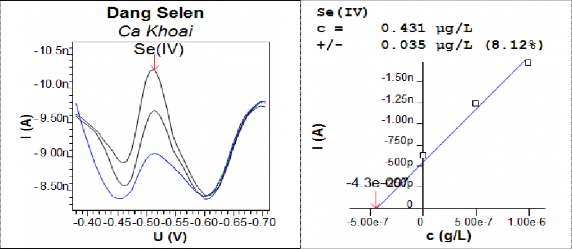
Figure 3.85: DPCSV curve and standard addition graph to determine the Se(IV) form in the Khoai fish sample
* Tiger shrimp sample
- Organic phase
Figure 3.86: DPCSV curve and additional standard graph to determine DMDSe form in Black Tiger shrimp sample
We repeated the extraction with 5.5 ml of dichloromethane again and measured DPCSV to determine the form of DMDSe. The results were similar to the case of the Khoai fish sample, although the electrolysis time was increased to enrich, the DMDSe peak still did not appear.
- Mix water
Se-cyst
c = 13.394 µg/L
+/- 1.383 µg/L (10.33%)
-30.0n
-20.0n
-10.0n
-1.3e-005
0
-1.00e-5
0
c (g/L)
1.00e-5 2.00e-5
I ( A )
Figure 3.87: DPCSV curve and additional standard graph to determine Se-Cyst form in Black Tiger shrimp sample
For the Se(IV) form, as in the case of the fish, separate measurements must be made with the electrolysis potential set more negative (-0.3V) than when measuring together (-0.2V). The results are shown in Figure 3.88.
Figure 3.88: DPCSV curve and standard addition graph to determine Se(IV) form in Black Tiger shrimp sample
* Model
- Organic phase
Figure 3.89: DPCSV curve and additional standard graph to determine DMDSe form in Ink sample
We repeated the extraction with 5.5 ml of dichloromethane again and measured the DPCSV to determine the form of DMDSe. The results were similar to the case of the Khoai fish and Su shrimp samples. Although the electrolysis time was increased, the DMDSe peak still did not appear. Because the DMDSe content in the sample extract was still low, although it was enriched in the organic phase, the content was still lower than the detection limit.
Se-cyst
c = 31.567 µg/L
+/- 2.308 µg/L (7.31%)
-10.0n
-8.00n
-6.00n
-4.00n
-2.00n
-3.2e-005
0
-3.00e-5 -2.00e-5 -1.00e-5 0 1.00e-5
c (g/L)
- Mix water
I (A)
Figure 3.90: DPCSV curve and additional standard graph to determine the Se-Cyst form in the Ink sample
The research results show that: On the DPCSV curve, only the Se-Cyst peak appears, there is no Se(IV) peak signal.
The summary of quantitative results of some forms of selenium in seafood samples is presented in Table 3.52.
Table 3.52: Results of determining the content of some forms of selenium in seafood samples by the dissolved voltammetry method
Selenium form
Sample
Se(IV) | Se-Cyst | DMDSe | Total selenium content (pp DPCSV) (µg/g) | |||
TB content (µg/g) | TB content (µg/g) | Rev (%) | TB content (µg/g) | Rev (%) | ||
Potato Fish | 0.143 | 10,596 | 92.33 | 0.042 | 88.26 | 51.81 |
Tiger Prawn | 0.166 | 6,269 | 85.44 | 0.028 | 82.79 | 15.16 |
Squid | 0.000 | 15,494 | 91.37 | 0.051 | 81.42 | 42.37 |
The results of the study show that in the analyzed samples, the content of Se-Cyst is the largest, followed by Se(IV) and the DMDSe form is the smallest. The content of Se-Cyst and DMDSe forms in squid is the largest, followed by fish and the smallest is in tiger prawn. Meanwhile, the total selenium content of fish is the largest, followed by squid and the smallest is tiger prawn. However, for squid samples, although the total selenium content is large, Se(IV) form was not found in the sample.
In summary : The DPCSV method can determine some electrochemically active selenium forms such as: Se(IV), Se-Cyst, DMDSe in seafood. Compared with some other methods such as HPLC-ICP-MS, HPLC-HG-AFS, the DPCSV method is not as advantageous as it cannot simultaneously determine more selenium forms including electrochemically active forms (Se(IV), Se-Cyst) as well as electrochemically inactive forms (Se(VI), SeMet, SeEt, TMSe, selencystein, etc.) with very low detection limits of ng/l. However, by the DPCSV method with a pre-treatment stage using liquid-liquid extraction technique to enrich DMDSe forms into the organic phase using CH 2 Cl 2 solvent , it is possible to determine DMDSe forms that the above methods cannot determine. To determine DMDSe as well as some other volatile selenium forms, a combination of GC-MS methods is required.