CHAPTER 3. RESULTS AND DISCUSSION
3.1. Results of assessment of input wastewater characteristics
3.1.1. Results of research on water sample preparation process.
Because the research wastewater is an artificial wastewater source prepared from industrial chemicals, it requires a wastewater preparation stage through multiple mixings to find the most suitable dosage for the subsequent operation. The experiment was carried out on a measuring cup with a volume of 1 L, the amount of chemicals was calculated hypothetically according to theory and adjusted accordingly after each analysis. The results of the wastewater preparation experiment adjusting the COD and NH 4 + parameters are shown in Table 2.
Table 2. Results of wastewater preparation experiments
Amount of chemicals used (per 1 L of water)
COD (mg/L) | NH 4 + (mg/L) | ||
Industrial alcohol (ml) | NH 4 Cl (g) | ||
0.62 | 0.446 | 1001.0 | 123.2 |
0.60 | 0.550 | 952.1 | 146.0 |
0.58 | 0.553 | 923.6 | 148.6 |
0.56 | 0.555 | 899.7 | 152.3 |
0.56 | 0.555 | 905.0 | 153.4 |
0.56 | 0.555 | 896.3 | 151.0 |
Maybe you are interested!
-

 Management Status of Tcm Results Evaluation Through NCBH Form Table 2.9: Current Status of Evaluation of Professional Team Performance Results Through Form
 -
 Evaluation Results of Quality Indicators and Importance of Each Indicator
 -
 Evaluation of Land Use Rights Mortgage Results at Vietnam Bank for Agriculture and Rural Development, Dien Bien Province Branch
 -
 Evaluation of Research Results of Research Projects on Organizational Implementation and Directions for Perfecting Legal Regulations on Rights Protection
 -
 Evaluation of Financial Analysis Results at Intech Technology Investment Group Joint Stock Company
In addition to the main pollution parameters of COD and NH4 + , during the wastewater preparation process, it is necessary to add soda to increase the pH of the input wastewater, creating optimal conditions for the nitrification process to take place thoroughly. In addition, it is also necessary to add phosphorus nutrition for microorganisms so that the treatment process achieves maximum efficiency.
The best. During the experiment, the pH adjustment using industrial soda Na 2 CO 3 was tested many times. The pH of wastewater without adding soda usually fluctuates between 7.0 - 7.2 and needs to be adjusted between 7.8 - 8.5. After many times of adjusting the pH with different doses of Na 2 CO 3 , the result was: it is necessary to add about 5 ml of 100 g/L Na 2 CO 3 solution to each 1 L of wastewater to stabilize the pH of the wastewater in the range of 8.0 - 8.5. For phosphorus, based on the experimental ratio C:N:P = 100:5:1 optimal for aerobic biological treatment, depending on the concentration of NH 4 + , phosphorus is added with KH 2 PO 4 salt as appropriate. In most batches, for an NH 4 + concentration of 150 mg/l, approximately 1 ml of 100 g/l KH 2 PO 4 solution will be added for each liter of batch wastewater.
3.1.2. Results of the evolution of pollutant components in wastewater
After finding the appropriate amount of chemicals to use for mixing wastewater, continue to monitor the evolution of the pollutant components in the wastewater over time. The reason for monitoring the evolution of the pollutant components is because the wastewater storage conditions are not well met (no lid for the wastewater tank), moreover, the nature of the organic component in the wastewater is industrial alcohol, when exposed to air, it will easily evaporate. The evolution of the COD component in the wastewater is shown in Figure 4.
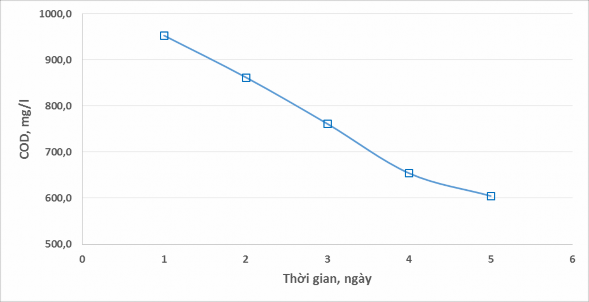
Figure 4. Evolution of COD composition in wastewater
Based on the figure, we can easily see that the COD value of the mixed wastewater sample has a clear change every day and specifically has a tendency to decrease steadily. After about 5 days, the COD value has decreased from 953.0 mg/l on the first day to 604.8 mg/l on the 5th day, the average amount of organic matter each day decreases by about 10% compared to the initial amount. The reason for the change in COD value in wastewater every day is that the wastewater tank is not carefully covered, allowing ethanol to easily evaporate and escape into the environment.
Figure 5 shows the evolution of NH 4 + composition in the wastewater phase.
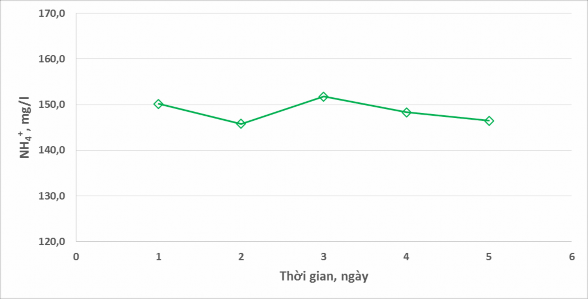
Figure 5. Evolution of NH 4 + composition in wastewater
For NH 4 + concentration , there was almost no change over the days ( 150 mg/l). Based on the analysis results shown in Figure 5, the reason for the small fluctuation in NH 4 + concentration is due to errors in the sampling and analysis process each day. Obviously, NH 4 Cl is not a chemical that can easily evaporate and decompose under normal conditions, so the concentration of NH 4 + in wastewater does not change over time.
The evolution of pH parameters in wastewater is shown in Figure 6.
From Figure 6, it can be seen that the pH value does not tend to change over time. After 5 days of monitoring, the pH value of the wastewater remains stable (8.0 - 8.2).
This can be explained by the fact that organic matter in wastewater is ethanol that cannot be hydrolyzed to create an alkaline or acidic environment, thereby affecting the pH of wastewater.
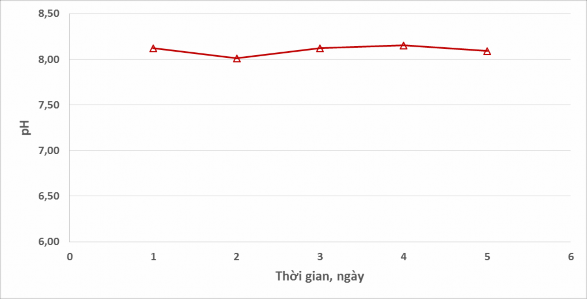
Figure 6. pH value evolution of wastewater
From the research results on the characteristics and evolution of wastewater mentioned above, it was decided that during the daily experiment, wastewater would be continuously mixed with a sufficient amount (in the start-up mode, 30 L is mixed each day and in the 2 modes 1; 2, only 20 L is mixed each day) to avoid wasting chemicals as well as clean water resources, while minimizing changes in pollution parameters, especially COD.
3.2. Research results on the effect of aeration cycle - aeration stop on the efficiency of organic matter and nitrogen treatment
3.2.1. Organic matter treatment efficiency
The fluctuations of COD parameters inlet, outlet and treatment efficiency at the condition of ratio (COD/T – N) > 3 of the alternating aeration – aeration-stop cycle are shown in Figure 7.
The results in Figure 7 show that the influent COD fluctuates in the range of 650 – 1500 mg/l, while the effluent COD is more stable and fluctuates in a small range of 20 – 150 mg/l, almost independent of the aeration – stop cycles.
different aeration modes. COD treatment efficiency in all three modes is stable and reaches between 85 - 98%. This result proves that changing the aeration cycle - stopping aeration does not affect COD treatment efficiency, because the nature of organic matter in the input wastewater is industrial alcohol C 2 H 5 OH - a form of organic matter that is very easy to decompose and also evaporates over time.
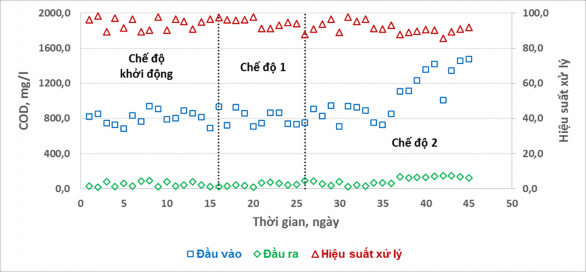
Figure 7. Effect of aeration cycle – aeration stop on COD treatment efficiency
Comparison of the results of this study with other related studies is shown in Table 3.
Table 3. Comparison of COD treatment efficiency between different studies
Author
Processing efficiency (%) | Processing cycle (hours) | |
Tran Thi Thu Lan (2013) | 80 – 88 | 12 |
Kousei Sasaki (1994) | 95 | 2 |
Yang PY (1999) | 98 | 6 |
This study | 93 | 6 |
3.2.2. Nitrogen treatment efficiency
a. Ammonium treatment efficiency
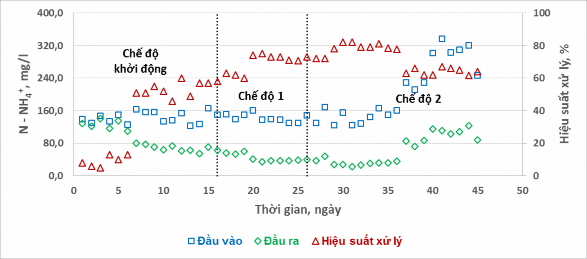
The concentration of NH 4 + in the influent wastewater, in the treated wastewater and the treatment efficiency of N – NH 4 + in the two experimental modes are shown in Figure 8.
Figure 8. Inlet and outlet N – NH 4 + concentrations and treatment efficiency in different modes
Based on the chart, it can be seen that different alternating aeration-stop aeration cycles have a clear effect on the N-NH4+ treatment efficiency . In the start-up mode, the N-NH4+ treatment efficiency from the first days was very low, almost impossible to treat. In the first 3 days, the treatment efficiency only reached 5-8%. The reason for not being able to treat N-NH4 + in the wastewater of the experimental system is thought to be that the pH in the reactor was too low at 5.5-6.0, which did not create optimal conditions for the nitrification process. Therefore, in the later experimental process, attention was paid to adjusting the pH of the influent wastewater and in the reactor. In the next 3 days (days 4 to 6), although the pH was adjusted appropriately, the treatment efficiency remained almost unchanged, only reaching 10-12%. The next cause identified here is the lack of phosphorus nutrients for the microbial treatment process, the sludge has difficulty settling. Therefore, in the following days, phosphorus was added to the input wastewater. From the 7th day after simultaneously adjusting the pH and adding phosphorus, the N – NH 4 + treatment efficiency achieved showed signs of improvement.
+
The efficiency was 46 – 60% better. Although the treatment efficiency had increased significantly compared to the first days of operation, the results were not really high. This can be explained by the fact that the aeration time in the start-up mode was still not enough for the nitrification process to occur completely (90 minutes). From there, the experimental mode was later changed to 6 hours/working cycle with the aeration time increased by 3 hours and 4 hours respectively. After the mode change, it is easy to see through the graph that the N – NH 4 + treatment efficiency has been significantly improved. The N – NH 4 treatment efficiency in mode 1 fluctuated between 60 – 75% while mode 2 achieved better results of 72 – 82% (with the same NH 4 + load ).
b. T – N treatment efficiency
The inlet and outlet T – N concentrations and T – N treatment efficiencies of the experimental regimes are shown in Figure 9.
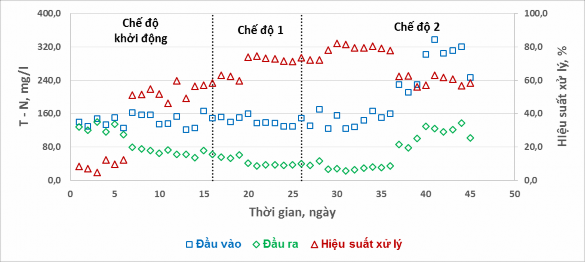
Figure 9. T – N treatment efficiency in different experimental modes
The results in Figure 9 show that different aeration-stop cycles affect the T-N treatment efficiency. In the start-up mode, the T-N treatment efficiency reached 47-60% on stable days, and in the first days of operation without pH adjustment and phosphorus addition, the treatment efficiency was very low. When switching to mode 1, the T-N treatment efficiency increased significantly, fluctuating between 60-75%. This can be explained by the fact that the aeration time in mode 1 is longer than the start-up mode (3 hours and 1.5 hours), the water retention time is longer (2 days and 1 day), so the treatment efficiency is better. Treatment efficiency achieved
Mode 2 is more promising (72 – 82% when compared with the same load) because the aeration time in mode 2 is longer than in mode 1 (4 hours and 3 hours), so the nitrification process is more effective.
Comparison of the results of this study with other related studies is shown in Table 4.
Table 4. Comparison of T – N treatment efficiency with other studies
Author
Processing efficiency (%) | Processing cycle (hours) | |
Tran Thi Thu Lan (2013) | 99.0 | 12 |
Kousei Sasaki (1994) | 89.4 | 2 |
Yang PY (1999) | 92.4 | 6 |
Koottatep S. (1994) | 45.0 | 12 |
Katsuto Inomae (1987) | 81.0 | 0.75 |
This study | 78.1 | 12 |
c. Nitrate and nitrite transformation of the process
The changes in total nitrate and nitrite concentrations in the experimental system under the two regimes are shown in Figure 10.
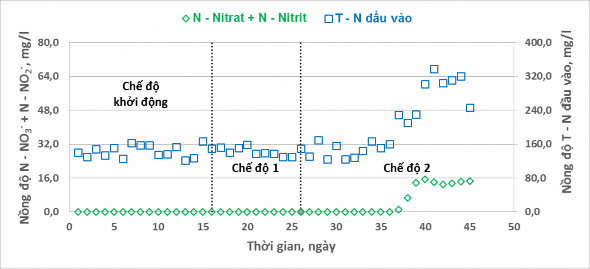
Figure 10. Nitrite and nitrate conversion in different modes