The 6th Party Congress introduced the term “social policy” for the first time, placing the correct position and role of social policy: “social policy covers all aspects of human life; working and living conditions, education and culture, family relations, class relations, ethnic relations”.
However, it was not until 1991, in the Platform for National Construction in the Transitional Period to Socialism , approved by the 7th Party Congress, that the issue of combining economic growth with social progress and equity was placed in the content and direction of social policy. The Platform clearly stated: "Correct social policy for human happiness is a great driving force to promote all creative potentials of the people in the cause of building socialism."
The main direction of social policy is : promoting the human factor on the basis of ensuring fairness and equality in the rights and obligations of citizens; combining well economic growth with social progress; between material life and spiritual life; between meeting immediate needs and caring for long-term interests; between individuals and collectives and the social community. Social policy ensures and continuously improves the material life of all members of society in terms of food, accommodation, travel, study, rest, medical treatment, and physical improvement.
The 7th Congress document further emphasized: “The goal of social policy is consistent with the goal of economic development, aiming to promote the strength of the human factor and for the people. Harmoniously combine economic development with cultural and social development, between economic growth and social progress; between material life and spiritual life of the people. Consider economic development as the premise and basis for implementing social policies, and good implementation of social policies is the driving force for economic development”.
The 8th Congress marked a new development in theoretical awareness and practical guidance on economic growth combined with social justice, clearly expressed in 5 viewpoints for planning the social policy system.
- Economic growth must be associated with progress and social justice in every step of the development process. Social justice must be reflected in the reasonable distribution of means of production and in the distribution of production results, in the
create conditions for everyone to have the opportunity to develop and make good use of their abilities.
- Implement many forms of distribution, mainly based on labor results and economic efficiency, while distributing based on the contribution of other resources to production and business results and distributing through social welfare, along with a reasonable savings policy, ensuring the rights of workers.
- Encourage legal enrichment while actively eliminating hunger and reducing poverty. Gradually narrow the gap in development level and living standards between regions, ethnic groups and population classes.
- Promote the good traditions of "repaying gratitude", "remembering the source of water", and being kind and loyal.
- All social policy issues are resolved in the spirit of socialization. The State plays a core role, while mobilizing every citizen, business, social organization, individual and foreign organizations to participate in solving social issues.
Continuing that spirit, at the 9th Party Congress, the viewpoint of combining economic growth with social justice was clearly stated: “Our Party's economic policy is: to promote industrialization and modernization, build an independent and self-reliant economy, turn our country into an industrialized country; prioritize the development of productive forces, while building socialist-oriented production relations; highly promote internal strength, while mobilizing external resources and proactively integrating into the international economy for rapid, effective and sustainable development; economic growth goes hand in hand with cultural development, gradually improving the material and spiritual life of the people, realizing social progress and justice, protecting and improving the environment, combining socio-economic development with strengthening security and national defense”. The Congress also continued to affirm the goal: "Continue the cause of innovation, promote industrialization and modernization, for the goal of a rich people, strong country, fair, democratic, civilized society, and steadily move towards socialism."
The 10th Party Congress clearly stated the general goals and directions for the 5 years 2006 - 2010 as: " Improving the leadership capacity and fighting strength of the Party, promoting the strength of the entire nation, comprehensively promoting the renovation process, mobilizing and making good use of all resources for the industrialization and modernization of the country; developing culture; implementing social progress and equity; strengthening national defense and security, expanding foreign relations; proactively and actively integrating into the international economy; maintaining political and social stability; soon bringing our country out of underdevelopment; creating a foundation for our country to basically become a modern industrialized country by 2020. " The Congress continued to affirm: " Implementing social progress and equity in every step and every development policy. Economic growth goes hand in hand with the development of culture, health care, education... effectively solving social issues for the goal of human development. "
2.2. Economic growth and social equity in Vietnam from 1986 to present
2.2.1. Overview of economic growth
2.2.1.1. Achievements
- On economic growth rate and per capita income:
One of the outstanding achievements of the Vietnamese economy during the renovation period is the high and quite stable economic growth rate. If in the pre-renovation period from 1976 - 1985, the average annual economic growth rate was about 2%, then after the renovation, the average annual growth rate was recorded as 4.5% in the period 1986 - 1990, 8.4% in the period 1991-1997, and still reached 7.23% in the period 1998-2008 even though the economy was affected by the Asian economic crisis, SARS epidemic, natural disasters... Vietnam's economic growth rate is equal to that of Korea and second only to China.
Chart 1: Vietnam's economic growth rate during the renovation period
speed(%)
Economic growth rate (%) | ||||
10 | 9.5 9.3 | |||
8 6 4 | 6.5 6 4.6 5.1 3.4 | 8.6 8.1 8.8 8.2 8.8 6.7 7 5.8 4.8 | 7.8 8.4 8.2 8.5 7.3 6.23 | |
2 | 2.7 | |||
0 | ||||
1986 1987 1988 1989 1990 1991 | 1992 1993 1994 1995 1996 1997 1998 1999 2000 2001 2002 | 2003 2004 2005 2006 2007 2008 | ||
Economic growth rate | ||||
Maybe you are interested!
-
![Pre-tax Profit of Bidv Tien Giang in the Period 2011-2015
zt2i3t4l5ee
zt2a3gsnon-credit services, joint stock commercial bank
zt2a3ge
zc2o3n4t5e6n7ts
At that time, the Branch had to set aside a provision for credit risks, which reduced the Branchs income.
Chart 2.2. Pre-tax profit of BIDV Tien Giang in the period 2011-2015
Unit: Billion VND
140
120
100
80
60
40
20
0
63.3
80.34
89.29
110.08
131.99
2011 2012 2013 2014 2015
Profit before tax
(Source: Report on the implementation of the annual business plan of the General Planning Department of BIDV Tien Giang [24])
However, through chart 2.2, it can be seen that BIDV Tien Giangs profit is still increasing continuously, and its operating efficiency is currently leaking. This is a contribution of non-credit services, and this service segment will be increasingly focused on growth by BIDV Tien Giang to ensure the highest profit safety because credit activities have many potential risks. At the same time, focusing on developing non-credit services is consistent with one of the contents of restructuring the financial activities of credit institutions in the project Restructuring the system of credit institutions in the period 2011-2015 approved by the Prime Minister in Decision No. 254/QD-TTg dated March 1, 2012 [14]: Gradually shifting the business model of commercial banks towards reducing dependence on credit activities and increasing income from non-credit services.
2.2. Current status of non-credit service development at BIDV Tien Giang.
2.2.1. BIDV Tien Giang has deployed the development of non-credit services in recent times.
Along with the development of the Head Office, BIDV Tien Giangs products and services are constantly improved and deployed in a diverse manner to ensure provision for many different customer groups in the area: individual customers, corporate customers, and financial institutions. Typical services are as follows: Payment services, treasury services, guarantee services, card services, trade finance, other services: Western Union, insurance commissions, consulting services, foreign exchange derivatives trading, e-banking services,...
2.2.1.1. Payment services:
In accordance with the Prime Ministers Project to promote non-cash payments in Vietnam [15], banks in Tien Giang province have continuously developed payment services to reduce customers cash usage habits through card services and electronic banking services such as: salary payment through accounts, focusing on developing card acceptance points, developing multi-purpose cards, paying social insurance by transfer, paying bills through banks, etc.
Chart 2.3. Net income from payment services in the period 2011-2015
Unit: Million VND
6000
5000
4000
3000
2000
1000
0
3922 4065
4720 5084 5324
2011 2012 2013 2014 2015
Net income from payment services
(Source: Report on the implementation of the annual business plan of the General Planning Department of BIDV Tien Giang [24])
Along with the technological development of the entire system, BIDV Tien Giang has a payment system with a fairly stable transaction processing speed, bringing many conveniences to customers. The results of observing chart 2.3 show that the income from payment services that the Branch has achieved has grown over the years but the speed is not high and the products are not outstanding compared to other banks. Domestic payment products such as: Online bill payment, electricity bills, water bills, insurance premiums, cable TV bills, telecommunications fees, airline tickets, etc. bring many conveniences to customers. Regarding international payment, this is an indispensable activity for foreign economic activities, BIDV Tien Giang is providing international payment methods for small enterprises producing agriculture, aquatic food and seafood that have credit relationships with banks in industrial parks in Tien Giang province such as: money transfer, collection, L/C payment.
2.2.1.2. Treasury services:
BIDV Tien Giang always focuses on ensuring treasury safety and currency security, always complies with legal regulations, and minimizes risks in operations such as: counting and collecting money from customers, receiving and delivering internal transactions, collecting from the State Bank (SBV) or other credit institutions, receiving ATM funds, bundling money, etc. BIDV Tien Giangs treasury service management department is always fully equipped with modern machinery and equipment such as: money transport vehicles, fire prevention tools, money counters, money detectors, magnifying glasses, etc. to ensure absolute safety in treasury operations, immediately identifying real and fake money and other risks that may affect people and assets of the bank and customers. In addition, implementing regulation 2480/QC dated October 28, 2008 between the State Bank of Tien Giang province and the Provincial Police on coordination in the fight against counterfeit money, in the 3-year review of implementation, BIDV Tien Giang discovered, seized and submitted to the State Bank of Tien Giang province 475 banknotes of various denominations and was commended by the Provincial Police and the State Bank of Tien Giang province [17].
Chart 2.4. Net income from treasury services in the period 2011-2015
Unit: Million VND
350
300
250
200
150
100
50
0
105 122
309 289 279
2011 2012 2013 2014 2015
Net income from treasury services
(Source: Report on the implementation of the annual business plan of the General Planning Department of BIDV Tien Giang [24])
However, as shown in Figure 2.4, income from treasury operations is not high and fluctuates. Specifically, in the period 2011-2013, net income increased and increased most sharply in 2013, then in the period 2013-2015, there was a downward trend. This fluctuation is due to the fact that fees collected from treasury services are often very low and can even be waived to attract customers to use other services.
2.2.1.3. Guarantee and trade finance services:
BIDV Tien Giang, thanks to the advantages of the province and the favorable location of the Branch, has continuously focused on developing income from guarantee services and trade finance.
Chart 2.5. Net income from guarantee and trade finance services in the period 2011-2015
Unit: Million VND
14000
12000
10000
8000
6000
4000
2000
0
5193 5695
2742 3420
8889
3992
11604 12206
5143 5312
2011 2012 2013 2014 2015
Net income from guarantee services Net income from Trade Finance
(Source: Report on the implementation of the annual business plan of the General Planning Department of BIDV Tien Giang [24])
Through chart 2.5, we can see that BIDV Tien Giangs income from guarantee services and trade finance has grown over the years. The reason is: Among BIDV Tien Giangs corporate customers, the construction industry is the industry with the highest proportion of customers after the trading industry, this is a group of customers with potential to develop guarantee services. The second group of customers is corporate customers in the fields of agricultural production, livestock and seafood processing with high import and export turnover in the area.
are the target of trade finance development. In addition, BIDV Tien Giang also focuses on continuously developing these customer groups to increase revenue for many other products and services in the future.
2.2.1.4. Card and POS services:
As a service that BIDV Tien Giang has recently developed strongly, it can be said that this is a very potential market and has the ability to develop even more strongly in the future. Card services with outstanding advantages such as fast payment time, wide payment range, quite safe, effective and suitable for the integration trend and the Project to promote non-cash payments in Vietnam. Cards have become a modern and popular payment tool. BIDV Tien Giang early identified that developing card services is to expand the market to people in society, create capital mobilized from card-opened accounts, contribute to diversifying banking activities, enhance the image of the bank, bring the BIDV Tien Giang brand to people as quickly and easily as possible. BIDV Tien Giang is currently providing card types such as: credit cards (BIDV MasterCard Platinum, BIDV Visa Gold Precious, BIDV Visa Manchester United, BIDV Visa Classic), international debit cards (BIDV Ready Card, BIDV Manu Debit Card), domestic debit cards (BIDV Harmony Card, BIDV eTrans Card, BIDV Moving Card, BIDV-Lingo Co-branded Card, BIDV-Co.opmart Co-branded Card). These cards can be paid via POS/EDC or on the ATM system. In addition, with debit cards, customers can not only withdraw money via ATMs but also perform utilities such as mobile top-up, online payment, money transfer,... through electronic banking services.
In order to attract customers with card services, BIDV Tien Giang has continuously increased the installation of ATMs. As of December 31, 2015, BIDV Tien Giang has 23 ATMs combined with 7 ATMs in the same system of BIDV My Tho, so the number of ATMs is quite large, especially in the center of My Tho City, but is not yet fully present in the districts. Basic services on ATMs such as withdrawing money, checking balances, printing short statements,... BIDV ATMs accept cards from banks in the system.
Banknetvn and Smartlink, cards branded by international card organizations Union Pay (CUP), VISA, MasterCard and cards of banks in the Asian Payment Network. From here, cardholders can make bill payments for themselves or others at ATMs, by simply entering the subscriber number or customer code, booking code that service providers notify and make bill payments.
Chart 2.6. Net income from card services in the period 2011-2015
Unit: Million VND
3500
3000
2500
2000
1500
1000
500
0
687
1023
1547
2267
3104
2011 2012 2013 2014 2015
Net income from card services
(Source: Report on the implementation of the annual business plan of the General Planning Department of BIDV Tien Giang [24])
Through chart 2.6, it can be seen that BIDV Tien Giangs card service income is constantly growing because the Branch focuses on developing businesses operating in industrial parks, which are the source of customers for salary payment products, ATMs, BSMS. Specifically, there are companies such as Freeview, Quang Viet, Dai Thanh, which are businesses with a large number of card openings at the Branch, contributing to the increase in card service fees [25].
Table 2.6. Number of ATMs and POS machines in 2015 of some banks in Tien Giang area.
Unit: Machine
STT
Bank name
Number of ATMs
Cumulative number of ATM cards
POS machine
1
BIDV Tien Giang
23
97,095
22
2
BIDV My Tho
7
21,325
0
3
Agribank Tien Giang
29
115,743
77
4
Vietinbank Tien Giang
16
100,052
54
5
Dong A Tien Giang
26
97,536
11
6
Sacombank Tien Giang
24
88,513
27
7
Vietcombank Tien Giang
15
61,607
96
8
Vietinbank - Tay Tien Giang Branch
6
46,042
38
(Source: 2015 Banking Activity Data Report of the General and Internal Control Department of the Provincial State Bank [21])
Through table 2.6, the author finds that the number of ATMs of BIDV Tien Giang is not much, ranking fourth after Agribank Tien Giang, Dong A Tien Giang, Sacombank Tien Giang. The number of POS machines of BIDV Tien Giang is very small, only higher than Dong A Tien Giang and BIDV My Tho in the initial stages of merging the BIDV system. Besides, BIDV Tien Giang has a high number of cards increasing over the years (table 2.7) but the cumulative number of cards issued up to December 31, 2015 is still relatively low compared to Agribank, Vietcombank, Dong A (table 2.6).
div.maincontent .content_head3 { color: black; font-family:Times New Roman, serif; font-style: normal; font-weight: bold; text-decoration: none; font-size: 14pt; }
div.maincontent .p { color: black; font-family:Times New Roman, serif; font-style: normal; font-weight: normal; text-decoration: none; font-size: 14pt; margin:0pt; }
div.maincontent p { color: black; font-family:Times New Roman, serif; font-style: normal; font-weight: normal; text-decoration: none; font-size: 14pt; margin:0pt; }
div.maincontent .s1 { color: black; font-family:Courier New, monospace; font-style: normal; font-weight: normal; text-decoration: none; font-size: 14pt; }
div.maincontent .s2 { color: black; font-family:Times New Roman, serif; font-style: italic; font-weight: normal; text-decoration: none; font-size: 13pt; }
div.maincontent .s3 { color: black; font-family:Times New Roman, serif; font-style: italic; font-weight: bold; text-decoration: none; font-size: 14pt; }
div.maincontent .s4 { color: black; font-family:Times New Roman, serif; font-style: italic; font-weight: normal; text-decoration: none; font-size: 14pt; }
div.maincontent .s5 { color: black; font-family:Times New Roman, serif; font-style: normal; font-weight: normal; text-decoration: none; font-size: 14pt; }
div.maincontent .s6 { color: black; font-family:Times New Roman, serif; font-style: normal; font-weight: bold; text-decoration: none; font-size: 14pt; }
div.maincontent .s7 { color: black; font-family:Times New Roman, serif; font-style: normal; font-weight: normal; text-decoration: none; font-size: 13.5pt; }
div.maincontent .s8 { color: black; font-family:Arial, sans-serif; font-style: normal; font-weight: normal; text-decoration: none; font-size: 9pt; }
div.maincontent .s9 { color: black; font-family:Arial, sans-serif; font-style: normal; font-weight: normal; text-decoration: none; font-size: 9pt; vertical-align: -2pt; }
div.maincontent .s10 { color: black; font-family:Arial, sans-serif; font-style: normal; font-weight: normal; text-decoration: none; font-size: 9pt; vertical-align: 5pt; }
div.maincontent .s11 { color: black; font-family:Arial, sans-serif; font-style: normal; font-weight: normal; text-decoration: none; font-size: 9pt; vertical-align: -5pt; }
div.maincontent .s12 { color: black; font-family:Arial, sans-serif; font-style: normal; font-weight: normal; text-decoration: none; font-size: 9pt; vertical-align: -3pt; }
div.maincontent .s13 { color: black; font-family:Arial, sans-serif; font-style: normal; font-weight: normal; text-decoration: none; font-size: 9pt; vertical-align: -4pt; }
div.maincontent .s14 { color: black; font-family:Arial, sans-serif; font-style: normal; font-weight: normal; text-decoration: none; font-size: 7.5pt; }
div.maincontent .s15 { color: black; font-family:Times New Roman, serif; font-style: italic; font-weight: normal; text-decoration: none; font-size: 14pt; }
div.maincontent .s16 { color: black; font-family:Arial, sans-serif; font-style: normal; font-weight: normal; text-decoration: none; font-size: 10.5pt; }
div.maincontent .s17 { color: black; font-family:Arial, sans-serif; font-style: normal; font-weight: normal; text-decoration: none; font-size: 9.5pt; }
div.maincontent .s18 { color: black; font-family:Arial, sans-serif; font-style: normal; font-weight: normal; text-decoration: none; font-size: 10.5pt; vertical-align: -1pt; }
div.maincontent .s19 { color: black; font-family:Arial, sans-serif; font-style: normal; font-weight: normal; text-decoration: none; font-size: 10.5pt; vertical-align: -5pt; }
div.maincontent .s20 { color: black; font-family:Arial, sans-serif; font-style: normal; font-weight: normal; text-decoration: none; font-size: 10.5pt; vertical-align: -2pt; }
div.maincontent .s21 { color: black; font-family:Arial, sans-serif; font-style: normal; font-weight: normal; text-decoration: none; font-size: 10pt; }
div.maincontent .s22 { color: black; font-family:Calibri, sans-serif; font-style: normal; font-weight: normal; text-decoration: none; font-size: 10.5pt; }
div.maincontent .s23 { color: black; font-family:Calibri, sans-serif; font-style: normal; font-weight: normal; text-decoration: none; font-size: 10.5pt; vertical-align: -3pt; }
div.maincontent .s24 { color: black; font-family:Calibri, sans-serif; font-style: normal; font-weight: normal; text-decoration: none; font-size: 10.5pt; vertical-align: -5pt; }
div.maincontent .s25 { color: black; font-family:Times New Roman, serif; font-style: normal; font-weight: normal; text-decoration: none; font-size: 10.5pt; }
div.maincontent .s26 { color: black; font-family:Calibri, sans-serif; font-style: normal; font-weight: normal; text-decoration: none; font-size: 10.5pt; vertical-align: -4pt; }
div.maincontent .s27 { color: black; font-family:Calibri, sans-serif; font-style: normal; font-weight: normal; text-decoration: none; font-size: 10.5pt; vertical-align: -6pt; }
div.maincontent .s28 { color: black; font-family:Calibri, sans-serif; font-style: normal; font-weight: normal; text-decoration: none; font-size: 10.5pt; vertical-align: -1pt; }
div.maincontent .s29 { color: black; font-family:Calibri, sans-serif; font-style: normal; font-weight: normal; text-decoration: none; font-size: 11.5pt; }
div.maincontent .s30 { color: black; font-family:Calibri, sans-serif; font-style: normal; font-weight: normal; text-decoration: none; font-size: 11pt; }
div.maincontent .s31 { color: black; font-family:Times New Roman, serif; font-style: normal; font-weight: normal; text-decoration: none; font-size: 11pt; }
div.maincontent .s32 { color: black; font-family:.VnTime, sans-serif; font-style: normal; font-weight: normal; text-decoration: none; font-size: 14pt; }
div.maincontent .s33 { color: black; font-family:Cambria, serif; font-style: normal; font-weight: normal; text-decoration: none; font-size: 10.5pt; }
div.maincontent .s34 { color: black; font-family:Cambria, serif; font-style: normal; font-weight: normal; text-decoration: none; font-size: 10.5pt; vertical-align: -4pt; }
div.maincontent .s35 { color: black; font-family:Arial, sans-serif; font-style: normal; font-weight: normal; text-decoration: none; font-size: 11.5pt; }
div.maincontent .s36 { color: black; font-family:Arial, sans-serif; font-style: normal; font-weight: bold; text-decoration: none; font-size: 14pt; }
div.maincontent .s37 { color: black; font-family:Times New Roman, serif; font-style: normal; font-weight: bold; text-decoration: none; font-size: 13pt; }
div.maincontent .s38 { color: black; font-family:Times New Roman, serif; font-style: normal; font-weight: normal; text-decoration: none; font-size: 13pt; }
div.maincontent .s39 { color: black; font-family:Times New Roman, serif; font-style: normal; font-weight: normal; text-decoration: none; font-size: 15pt; }
div.maincontent .s40 { color: black; font-family:Times New Roman, serif; font-style: normal; fo](https://tailieuthamkhao.com/uploads/2022/06/06/dich-vu-phi-tin-dung-tai-ngan-hang-thuong-mai-co-phan-dau-tu-va-phat-8-1-120x90.png)
![Pre-tax Profit of Bidv Tien Giang in the Period 2011-2015
zt2i3t4l5ee
zt2a3gsnon-credit services, joint stock commercial bank
zt2a3ge
zc2o3n4t5e6n7ts
At that time, the Branch had to set aside a provision for credit risks, which reduced the Branchs income.
Chart 2.2. Pre-tax profit of BIDV Tien Giang in the period 2011-2015
Unit: Billion VND
140
120
100
80
60
40
20
0
63.3
80.34
89.29
110.08
131.99
2011 2012 2013 2014 2015
Profit before tax
(Source: Report on the implementation of the annual business plan of the General Planning Department of BIDV Tien Giang [24])
However, through chart 2.2, it can be seen that BIDV Tien Giangs profit is still increasing continuously, and its operating efficiency is currently leaking. This is a contribution of non-credit services, and this service segment will be increasingly focused on growth by BIDV Tien Giang to ensure the highest profit safety because credit activities have many potential risks. At the same time, focusing on developing non-credit services is consistent with one of the contents of restructuring the financial activities of credit institutions in the project Restructuring the system of credit institutions in the period 2011-2015 approved by the Prime Minister in Decision No. 254/QD-TTg dated March 1, 2012 [14]: Gradually shifting the business model of commercial banks towards reducing dependence on credit activities and increasing income from non-credit services.
2.2. Current status of non-credit service development at BIDV Tien Giang.
2.2.1. BIDV Tien Giang has deployed the development of non-credit services in recent times.
Along with the development of the Head Office, BIDV Tien Giangs products and services are constantly improved and deployed in a diverse manner to ensure provision for many different customer groups in the area: individual customers, corporate customers, and financial institutions. Typical services are as follows: Payment services, treasury services, guarantee services, card services, trade finance, other services: Western Union, insurance commissions, consulting services, foreign exchange derivatives trading, e-banking services,...
2.2.1.1. Payment services:
In accordance with the Prime Ministers Project to promote non-cash payments in Vietnam [15], banks in Tien Giang province have continuously developed payment services to reduce customers cash usage habits through card services and electronic banking services such as: salary payment through accounts, focusing on developing card acceptance points, developing multi-purpose cards, paying social insurance by transfer, paying bills through banks, etc.
Chart 2.3. Net income from payment services in the period 2011-2015
Unit: Million VND
6000
5000
4000
3000
2000
1000
0
3922 4065
4720 5084 5324
2011 2012 2013 2014 2015
Net income from payment services
(Source: Report on the implementation of the annual business plan of the General Planning Department of BIDV Tien Giang [24])
Along with the technological development of the entire system, BIDV Tien Giang has a payment system with a fairly stable transaction processing speed, bringing many conveniences to customers. The results of observing chart 2.3 show that the income from payment services that the Branch has achieved has grown over the years but the speed is not high and the products are not outstanding compared to other banks. Domestic payment products such as: Online bill payment, electricity bills, water bills, insurance premiums, cable TV bills, telecommunications fees, airline tickets, etc. bring many conveniences to customers. Regarding international payment, this is an indispensable activity for foreign economic activities, BIDV Tien Giang is providing international payment methods for small enterprises producing agriculture, aquatic food and seafood that have credit relationships with banks in industrial parks in Tien Giang province such as: money transfer, collection, L/C payment.
2.2.1.2. Treasury services:
BIDV Tien Giang always focuses on ensuring treasury safety and currency security, always complies with legal regulations, and minimizes risks in operations such as: counting and collecting money from customers, receiving and delivering internal transactions, collecting from the State Bank (SBV) or other credit institutions, receiving ATM funds, bundling money, etc. BIDV Tien Giangs treasury service management department is always fully equipped with modern machinery and equipment such as: money transport vehicles, fire prevention tools, money counters, money detectors, magnifying glasses, etc. to ensure absolute safety in treasury operations, immediately identifying real and fake money and other risks that may affect people and assets of the bank and customers. In addition, implementing regulation 2480/QC dated October 28, 2008 between the State Bank of Tien Giang province and the Provincial Police on coordination in the fight against counterfeit money, in the 3-year review of implementation, BIDV Tien Giang discovered, seized and submitted to the State Bank of Tien Giang province 475 banknotes of various denominations and was commended by the Provincial Police and the State Bank of Tien Giang province [17].
Chart 2.4. Net income from treasury services in the period 2011-2015
Unit: Million VND
350
300
250
200
150
100
50
0
105 122
309 289 279
2011 2012 2013 2014 2015
Net income from treasury services
(Source: Report on the implementation of the annual business plan of the General Planning Department of BIDV Tien Giang [24])
However, as shown in Figure 2.4, income from treasury operations is not high and fluctuates. Specifically, in the period 2011-2013, net income increased and increased most sharply in 2013, then in the period 2013-2015, there was a downward trend. This fluctuation is due to the fact that fees collected from treasury services are often very low and can even be waived to attract customers to use other services.
2.2.1.3. Guarantee and trade finance services:
BIDV Tien Giang, thanks to the advantages of the province and the favorable location of the Branch, has continuously focused on developing income from guarantee services and trade finance.
Chart 2.5. Net income from guarantee and trade finance services in the period 2011-2015
Unit: Million VND
14000
12000
10000
8000
6000
4000
2000
0
5193 5695
2742 3420
8889
3992
11604 12206
5143 5312
2011 2012 2013 2014 2015
Net income from guarantee services Net income from Trade Finance
(Source: Report on the implementation of the annual business plan of the General Planning Department of BIDV Tien Giang [24])
Through chart 2.5, we can see that BIDV Tien Giangs income from guarantee services and trade finance has grown over the years. The reason is: Among BIDV Tien Giangs corporate customers, the construction industry is the industry with the highest proportion of customers after the trading industry, this is a group of customers with potential to develop guarantee services. The second group of customers is corporate customers in the fields of agricultural production, livestock and seafood processing with high import and export turnover in the area.
are the target of trade finance development. In addition, BIDV Tien Giang also focuses on continuously developing these customer groups to increase revenue for many other products and services in the future.
2.2.1.4. Card and POS services:
As a service that BIDV Tien Giang has recently developed strongly, it can be said that this is a very potential market and has the ability to develop even more strongly in the future. Card services with outstanding advantages such as fast payment time, wide payment range, quite safe, effective and suitable for the integration trend and the Project to promote non-cash payments in Vietnam. Cards have become a modern and popular payment tool. BIDV Tien Giang early identified that developing card services is to expand the market to people in society, create capital mobilized from card-opened accounts, contribute to diversifying banking activities, enhance the image of the bank, bring the BIDV Tien Giang brand to people as quickly and easily as possible. BIDV Tien Giang is currently providing card types such as: credit cards (BIDV MasterCard Platinum, BIDV Visa Gold Precious, BIDV Visa Manchester United, BIDV Visa Classic), international debit cards (BIDV Ready Card, BIDV Manu Debit Card), domestic debit cards (BIDV Harmony Card, BIDV eTrans Card, BIDV Moving Card, BIDV-Lingo Co-branded Card, BIDV-Co.opmart Co-branded Card). These cards can be paid via POS/EDC or on the ATM system. In addition, with debit cards, customers can not only withdraw money via ATMs but also perform utilities such as mobile top-up, online payment, money transfer,... through electronic banking services.
In order to attract customers with card services, BIDV Tien Giang has continuously increased the installation of ATMs. As of December 31, 2015, BIDV Tien Giang has 23 ATMs combined with 7 ATMs in the same system of BIDV My Tho, so the number of ATMs is quite large, especially in the center of My Tho City, but is not yet fully present in the districts. Basic services on ATMs such as withdrawing money, checking balances, printing short statements,... BIDV ATMs accept cards from banks in the system.
Banknetvn and Smartlink, cards branded by international card organizations Union Pay (CUP), VISA, MasterCard and cards of banks in the Asian Payment Network. From here, cardholders can make bill payments for themselves or others at ATMs, by simply entering the subscriber number or customer code, booking code that service providers notify and make bill payments.
Chart 2.6. Net income from card services in the period 2011-2015
Unit: Million VND
3500
3000
2500
2000
1500
1000
500
0
687
1023
1547
2267
3104
2011 2012 2013 2014 2015
Net income from card services
(Source: Report on the implementation of the annual business plan of the General Planning Department of BIDV Tien Giang [24])
Through chart 2.6, it can be seen that BIDV Tien Giangs card service income is constantly growing because the Branch focuses on developing businesses operating in industrial parks, which are the source of customers for salary payment products, ATMs, BSMS. Specifically, there are companies such as Freeview, Quang Viet, Dai Thanh, which are businesses with a large number of card openings at the Branch, contributing to the increase in card service fees [25].
Table 2.6. Number of ATMs and POS machines in 2015 of some banks in Tien Giang area.
Unit: Machine
STT
Bank name
Number of ATMs
Cumulative number of ATM cards
POS machine
1
BIDV Tien Giang
23
97,095
22
2
BIDV My Tho
7
21,325
0
3
Agribank Tien Giang
29
115,743
77
4
Vietinbank Tien Giang
16
100,052
54
5
Dong A Tien Giang
26
97,536
11
6
Sacombank Tien Giang
24
88,513
27
7
Vietcombank Tien Giang
15
61,607
96
8
Vietinbank - Tay Tien Giang Branch
6
46,042
38
(Source: 2015 Banking Activity Data Report of the General and Internal Control Department of the Provincial State Bank [21])
Through table 2.6, the author finds that the number of ATMs of BIDV Tien Giang is not much, ranking fourth after Agribank Tien Giang, Dong A Tien Giang, Sacombank Tien Giang. The number of POS machines of BIDV Tien Giang is very small, only higher than Dong A Tien Giang and BIDV My Tho in the initial stages of merging the BIDV system. Besides, BIDV Tien Giang has a high number of cards increasing over the years (table 2.7) but the cumulative number of cards issued up to December 31, 2015 is still relatively low compared to Agribank, Vietcombank, Dong A (table 2.6).
div.maincontent .content_head3 { color: black; font-family:Times New Roman, serif; font-style: normal; font-weight: bold; text-decoration: none; font-size: 14pt; }
div.maincontent .p { color: black; font-family:Times New Roman, serif; font-style: normal; font-weight: normal; text-decoration: none; font-size: 14pt; margin:0pt; }
div.maincontent p { color: black; font-family:Times New Roman, serif; font-style: normal; font-weight: normal; text-decoration: none; font-size: 14pt; margin:0pt; }
div.maincontent .s1 { color: black; font-family:Courier New, monospace; font-style: normal; font-weight: normal; text-decoration: none; font-size: 14pt; }
div.maincontent .s2 { color: black; font-family:Times New Roman, serif; font-style: italic; font-weight: normal; text-decoration: none; font-size: 13pt; }
div.maincontent .s3 { color: black; font-family:Times New Roman, serif; font-style: italic; font-weight: bold; text-decoration: none; font-size: 14pt; }
div.maincontent .s4 { color: black; font-family:Times New Roman, serif; font-style: italic; font-weight: normal; text-decoration: none; font-size: 14pt; }
div.maincontent .s5 { color: black; font-family:Times New Roman, serif; font-style: normal; font-weight: normal; text-decoration: none; font-size: 14pt; }
div.maincontent .s6 { color: black; font-family:Times New Roman, serif; font-style: normal; font-weight: bold; text-decoration: none; font-size: 14pt; }
div.maincontent .s7 { color: black; font-family:Times New Roman, serif; font-style: normal; font-weight: normal; text-decoration: none; font-size: 13.5pt; }
div.maincontent .s8 { color: black; font-family:Arial, sans-serif; font-style: normal; font-weight: normal; text-decoration: none; font-size: 9pt; }
div.maincontent .s9 { color: black; font-family:Arial, sans-serif; font-style: normal; font-weight: normal; text-decoration: none; font-size: 9pt; vertical-align: -2pt; }
div.maincontent .s10 { color: black; font-family:Arial, sans-serif; font-style: normal; font-weight: normal; text-decoration: none; font-size: 9pt; vertical-align: 5pt; }
div.maincontent .s11 { color: black; font-family:Arial, sans-serif; font-style: normal; font-weight: normal; text-decoration: none; font-size: 9pt; vertical-align: -5pt; }
div.maincontent .s12 { color: black; font-family:Arial, sans-serif; font-style: normal; font-weight: normal; text-decoration: none; font-size: 9pt; vertical-align: -3pt; }
div.maincontent .s13 { color: black; font-family:Arial, sans-serif; font-style: normal; font-weight: normal; text-decoration: none; font-size: 9pt; vertical-align: -4pt; }
div.maincontent .s14 { color: black; font-family:Arial, sans-serif; font-style: normal; font-weight: normal; text-decoration: none; font-size: 7.5pt; }
div.maincontent .s15 { color: black; font-family:Times New Roman, serif; font-style: italic; font-weight: normal; text-decoration: none; font-size: 14pt; }
div.maincontent .s16 { color: black; font-family:Arial, sans-serif; font-style: normal; font-weight: normal; text-decoration: none; font-size: 10.5pt; }
div.maincontent .s17 { color: black; font-family:Arial, sans-serif; font-style: normal; font-weight: normal; text-decoration: none; font-size: 9.5pt; }
div.maincontent .s18 { color: black; font-family:Arial, sans-serif; font-style: normal; font-weight: normal; text-decoration: none; font-size: 10.5pt; vertical-align: -1pt; }
div.maincontent .s19 { color: black; font-family:Arial, sans-serif; font-style: normal; font-weight: normal; text-decoration: none; font-size: 10.5pt; vertical-align: -5pt; }
div.maincontent .s20 { color: black; font-family:Arial, sans-serif; font-style: normal; font-weight: normal; text-decoration: none; font-size: 10.5pt; vertical-align: -2pt; }
div.maincontent .s21 { color: black; font-family:Arial, sans-serif; font-style: normal; font-weight: normal; text-decoration: none; font-size: 10pt; }
div.maincontent .s22 { color: black; font-family:Calibri, sans-serif; font-style: normal; font-weight: normal; text-decoration: none; font-size: 10.5pt; }
div.maincontent .s23 { color: black; font-family:Calibri, sans-serif; font-style: normal; font-weight: normal; text-decoration: none; font-size: 10.5pt; vertical-align: -3pt; }
div.maincontent .s24 { color: black; font-family:Calibri, sans-serif; font-style: normal; font-weight: normal; text-decoration: none; font-size: 10.5pt; vertical-align: -5pt; }
div.maincontent .s25 { color: black; font-family:Times New Roman, serif; font-style: normal; font-weight: normal; text-decoration: none; font-size: 10.5pt; }
div.maincontent .s26 { color: black; font-family:Calibri, sans-serif; font-style: normal; font-weight: normal; text-decoration: none; font-size: 10.5pt; vertical-align: -4pt; }
div.maincontent .s27 { color: black; font-family:Calibri, sans-serif; font-style: normal; font-weight: normal; text-decoration: none; font-size: 10.5pt; vertical-align: -6pt; }
div.maincontent .s28 { color: black; font-family:Calibri, sans-serif; font-style: normal; font-weight: normal; text-decoration: none; font-size: 10.5pt; vertical-align: -1pt; }
div.maincontent .s29 { color: black; font-family:Calibri, sans-serif; font-style: normal; font-weight: normal; text-decoration: none; font-size: 11.5pt; }
div.maincontent .s30 { color: black; font-family:Calibri, sans-serif; font-style: normal; font-weight: normal; text-decoration: none; font-size: 11pt; }
div.maincontent .s31 { color: black; font-family:Times New Roman, serif; font-style: normal; font-weight: normal; text-decoration: none; font-size: 11pt; }
div.maincontent .s32 { color: black; font-family:.VnTime, sans-serif; font-style: normal; font-weight: normal; text-decoration: none; font-size: 14pt; }
div.maincontent .s33 { color: black; font-family:Cambria, serif; font-style: normal; font-weight: normal; text-decoration: none; font-size: 10.5pt; }
div.maincontent .s34 { color: black; font-family:Cambria, serif; font-style: normal; font-weight: normal; text-decoration: none; font-size: 10.5pt; vertical-align: -4pt; }
div.maincontent .s35 { color: black; font-family:Arial, sans-serif; font-style: normal; font-weight: normal; text-decoration: none; font-size: 11.5pt; }
div.maincontent .s36 { color: black; font-family:Arial, sans-serif; font-style: normal; font-weight: bold; text-decoration: none; font-size: 14pt; }
div.maincontent .s37 { color: black; font-family:Times New Roman, serif; font-style: normal; font-weight: bold; text-decoration: none; font-size: 13pt; }
div.maincontent .s38 { color: black; font-family:Times New Roman, serif; font-style: normal; font-weight: normal; text-decoration: none; font-size: 13pt; }
div.maincontent .s39 { color: black; font-family:Times New Roman, serif; font-style: normal; font-weight: normal; text-decoration: none; font-size: 15pt; }
div.maincontent .s40 { color: black; font-family:Times New Roman, serif; font-style: normal; fo](data:image/svg+xml,%3Csvg%20xmlns=%22http://www.w3.org/2000/svg%22%20viewBox=%220%200%2075%2075%22%3E%3C/svg%3E) Pre-tax Profit of Bidv Tien Giang in the Period 2011-2015
zt2i3t4l5ee
zt2a3gsnon-credit services, joint stock commercial bank
zt2a3ge
zc2o3n4t5e6n7ts
At that time, the Branch had to set aside a provision for credit risks, which reduced the Branch's income.
Chart 2.2. Pre-tax profit of BIDV Tien Giang in the period 2011-2015
Unit: Billion VND
140
120
100
80
60
40
20
0
63.3
80.34
89.29
110.08
131.99
2011 2012 2013 2014 2015
Profit before tax
(Source: Report on the implementation of the annual business plan of the General Planning Department of BIDV Tien Giang [24])
However, through chart 2.2, it can be seen that BIDV Tien Giang's profit is still increasing continuously, and its operating efficiency is currently leaking. This is a contribution of non-credit services, and this service segment will be increasingly focused on growth by BIDV Tien Giang to ensure the highest profit safety because credit activities have many potential risks. At the same time, focusing on developing non-credit services is consistent with one of the contents of restructuring the financial activities of credit institutions in the project "Restructuring the system of credit institutions in the period 2011-2015" approved by the Prime Minister in Decision No. 254/QD-TTg dated March 1, 2012 [14]: "Gradually shifting the business model of commercial banks towards reducing dependence on credit activities and increasing income from non-credit services".
2.2. Current status of non-credit service development at BIDV Tien Giang.
2.2.1. BIDV Tien Giang has deployed the development of non-credit services in recent times.
Along with the development of the Head Office, BIDV Tien Giang's products and services are constantly improved and deployed in a diverse manner to ensure provision for many different customer groups in the area: individual customers, corporate customers, and financial institutions. Typical services are as follows: Payment services, treasury services, guarantee services, card services, trade finance, other services: Western Union, insurance commissions, consulting services, foreign exchange derivatives trading, e-banking services,...
2.2.1.1. Payment services:
In accordance with the Prime Minister's Project to promote non-cash payments in Vietnam [15], banks in Tien Giang province have continuously developed payment services to reduce customers' cash usage habits through card services and electronic banking services such as: salary payment through accounts, focusing on developing card acceptance points, developing multi-purpose cards, paying social insurance by transfer, paying bills through banks, etc.
Chart 2.3. Net income from payment services in the period 2011-2015
Unit: Million VND
6000
5000
4000
3000
2000
1000
0
3922 4065
4720 5084 5324
2011 2012 2013 2014 2015
Net income from payment services
(Source: Report on the implementation of the annual business plan of the General Planning Department of BIDV Tien Giang [24])
Along with the technological development of the entire system, BIDV Tien Giang has a payment system with a fairly stable transaction processing speed, bringing many conveniences to customers. The results of observing chart 2.3 show that the income from payment services that the Branch has achieved has grown over the years but the speed is not high and the products are not outstanding compared to other banks. Domestic payment products such as: Online bill payment, electricity bills, water bills, insurance premiums, cable TV bills, telecommunications fees, airline tickets, etc. bring many conveniences to customers. Regarding international payment, this is an indispensable activity for foreign economic activities, BIDV Tien Giang is providing international payment methods for small enterprises producing agriculture, aquatic food and seafood that have credit relationships with banks in industrial parks in Tien Giang province such as: money transfer, collection, L/C payment.
2.2.1.2. Treasury services:
BIDV Tien Giang always focuses on ensuring treasury safety and currency security, always complies with legal regulations, and minimizes risks in operations such as: counting and collecting money from customers, receiving and delivering internal transactions, collecting from the State Bank (SBV) or other credit institutions, receiving ATM funds, bundling money, etc. BIDV Tien Giang's treasury service management department is always fully equipped with modern machinery and equipment such as: money transport vehicles, fire prevention tools, money counters, money detectors, magnifying glasses, etc. to ensure absolute safety in treasury operations, immediately identifying real and fake money and other risks that may affect people and assets of the bank and customers. In addition, implementing regulation 2480/QC dated October 28, 2008 between the State Bank of Tien Giang province and the Provincial Police on coordination in the fight against counterfeit money, in the 3-year review of implementation, BIDV Tien Giang discovered, seized and submitted to the State Bank of Tien Giang province 475 banknotes of various denominations and was commended by the Provincial Police and the State Bank of Tien Giang province [17].
Chart 2.4. Net income from treasury services in the period 2011-2015
Unit: Million VND
350
300
250
200
150
100
50
0
105 122
309 289 279
2011 2012 2013 2014 2015
Net income from treasury services
(Source: Report on the implementation of the annual business plan of the General Planning Department of BIDV Tien Giang [24])
However, as shown in Figure 2.4, income from treasury operations is not high and fluctuates. Specifically, in the period 2011-2013, net income increased and increased most sharply in 2013, then in the period 2013-2015, there was a downward trend. This fluctuation is due to the fact that fees collected from treasury services are often very low and can even be waived to attract customers to use other services.
2.2.1.3. Guarantee and trade finance services:
BIDV Tien Giang, thanks to the advantages of the province and the favorable location of the Branch, has continuously focused on developing income from guarantee services and trade finance.
Chart 2.5. Net income from guarantee and trade finance services in the period 2011-2015
Unit: Million VND
14000
12000
10000
8000
6000
4000
2000
0
5193 5695
2742 3420
8889
3992
11604 12206
5143 5312
2011 2012 2013 2014 2015
Net income from guarantee services Net income from Trade Finance
(Source: Report on the implementation of the annual business plan of the General Planning Department of BIDV Tien Giang [24])
Through chart 2.5, we can see that BIDV Tien Giang's income from guarantee services and trade finance has grown over the years. The reason is: Among BIDV Tien Giang's corporate customers, the construction industry is the industry with the highest proportion of customers after the trading industry, this is a group of customers with potential to develop guarantee services. The second group of customers is corporate customers in the fields of agricultural production, livestock and seafood processing with high import and export turnover in the area.
are the target of trade finance development. In addition, BIDV Tien Giang also focuses on continuously developing these customer groups to increase revenue for many other products and services in the future.
2.2.1.4. Card and POS services:
As a service that BIDV Tien Giang has recently developed strongly, it can be said that this is a very potential market and has the ability to develop even more strongly in the future. Card services with outstanding advantages such as fast payment time, wide payment range, quite safe, effective and suitable for the integration trend and the Project to promote non-cash payments in Vietnam. Cards have become a modern and popular payment tool. BIDV Tien Giang early identified that developing card services is to expand the market to people in society, create capital mobilized from card-opened accounts, contribute to diversifying banking activities, enhance the image of the bank, bring the BIDV Tien Giang brand to people as quickly and easily as possible. BIDV Tien Giang is currently providing card types such as: credit cards (BIDV MasterCard Platinum, BIDV Visa Gold Precious, BIDV Visa Manchester United, BIDV Visa Classic), international debit cards (BIDV Ready Card, BIDV Manu Debit Card), domestic debit cards (BIDV Harmony Card, BIDV eTrans Card, BIDV Moving Card, BIDV-Lingo Co-branded Card, BIDV-Co.opmart Co-branded Card). These cards can be paid via POS/EDC or on the ATM system. In addition, with debit cards, customers can not only withdraw money via ATMs but also perform utilities such as mobile top-up, online payment, money transfer,... through electronic banking services.
In order to attract customers with card services, BIDV Tien Giang has continuously increased the installation of ATMs. As of December 31, 2015, BIDV Tien Giang has 23 ATMs combined with 7 ATMs in the same system of BIDV My Tho, so the number of ATMs is quite large, especially in the center of My Tho City, but is not yet fully present in the districts. Basic services on ATMs such as withdrawing money, checking balances, printing short statements,... BIDV ATMs accept cards from banks in the system.
Banknetvn and Smartlink, cards branded by international card organizations Union Pay (CUP), VISA, MasterCard and cards of banks in the Asian Payment Network. From here, cardholders can make bill payments for themselves or others at ATMs, by simply entering the subscriber number or customer code, booking code that service providers notify and make bill payments.
Chart 2.6. Net income from card services in the period 2011-2015
Unit: Million VND
3500
3000
2500
2000
1500
1000
500
0
687
1023
1547
2267
3104
2011 2012 2013 2014 2015
Net income from card services
(Source: Report on the implementation of the annual business plan of the General Planning Department of BIDV Tien Giang [24])
Through chart 2.6, it can be seen that BIDV Tien Giang's card service income is constantly growing because the Branch focuses on developing businesses operating in industrial parks, which are the source of customers for salary payment products, ATMs, BSMS. Specifically, there are companies such as Freeview, Quang Viet, Dai Thanh, which are businesses with a large number of card openings at the Branch, contributing to the increase in card service fees [25].
Table 2.6. Number of ATMs and POS machines in 2015 of some banks in Tien Giang area.
Unit: Machine
STT
Bank name
Number of ATMs
Cumulative number of ATM cards
POS machine
1
BIDV Tien Giang
23
97,095
22
2
BIDV My Tho
7
21,325
0
3
Agribank Tien Giang
29
115,743
77
4
Vietinbank Tien Giang
16
100,052
54
5
Dong A Tien Giang
26
97,536
11
6
Sacombank Tien Giang
24
88,513
27
7
Vietcombank Tien Giang
15
61,607
96
8
Vietinbank - Tay Tien Giang Branch
6
46,042
38
(Source: 2015 Banking Activity Data Report of the General and Internal Control Department of the Provincial State Bank [21])
Through table 2.6, the author finds that the number of ATMs of BIDV Tien Giang is not much, ranking fourth after Agribank Tien Giang, Dong A Tien Giang, Sacombank Tien Giang. The number of POS machines of BIDV Tien Giang is very small, only higher than Dong A Tien Giang and BIDV My Tho in the initial stages of merging the BIDV system. Besides, BIDV Tien Giang has a high number of cards increasing over the years (table 2.7) but the cumulative number of cards issued up to December 31, 2015 is still relatively low compared to Agribank, Vietcombank, Dong A (table 2.6).
div.maincontent .content_head3 { color: black; font-family:"Times New Roman", serif; font-style: normal; font-weight: bold; text-decoration: none; font-size: 14pt; }
div.maincontent .p { color: black; font-family:"Times New Roman", serif; font-style: normal; font-weight: normal; text-decoration: none; font-size: 14pt; margin:0pt; }
div.maincontent p { color: black; font-family:"Times New Roman", serif; font-style: normal; font-weight: normal; text-decoration: none; font-size: 14pt; margin:0pt; }
div.maincontent .s1 { color: black; font-family:"Courier New", monospace; font-style: normal; font-weight: normal; text-decoration: none; font-size: 14pt; }
div.maincontent .s2 { color: black; font-family:"Times New Roman", serif; font-style: italic; font-weight: normal; text-decoration: none; font-size: 13pt; }
div.maincontent .s3 { color: black; font-family:"Times New Roman", serif; font-style: italic; font-weight: bold; text-decoration: none; font-size: 14pt; }
div.maincontent .s4 { color: black; font-family:"Times New Roman", serif; font-style: italic; font-weight: normal; text-decoration: none; font-size: 14pt; }
div.maincontent .s5 { color: black; font-family:"Times New Roman", serif; font-style: normal; font-weight: normal; text-decoration: none; font-size: 14pt; }
div.maincontent .s6 { color: black; font-family:"Times New Roman", serif; font-style: normal; font-weight: bold; text-decoration: none; font-size: 14pt; }
div.maincontent .s7 { color: black; font-family:"Times New Roman", serif; font-style: normal; font-weight: normal; text-decoration: none; font-size: 13.5pt; }
div.maincontent .s8 { color: black; font-family:Arial, sans-serif; font-style: normal; font-weight: normal; text-decoration: none; font-size: 9pt; }
div.maincontent .s9 { color: black; font-family:Arial, sans-serif; font-style: normal; font-weight: normal; text-decoration: none; font-size: 9pt; vertical-align: -2pt; }
div.maincontent .s10 { color: black; font-family:Arial, sans-serif; font-style: normal; font-weight: normal; text-decoration: none; font-size: 9pt; vertical-align: 5pt; }
div.maincontent .s11 { color: black; font-family:Arial, sans-serif; font-style: normal; font-weight: normal; text-decoration: none; font-size: 9pt; vertical-align: -5pt; }
div.maincontent .s12 { color: black; font-family:Arial, sans-serif; font-style: normal; font-weight: normal; text-decoration: none; font-size: 9pt; vertical-align: -3pt; }
div.maincontent .s13 { color: black; font-family:Arial, sans-serif; font-style: normal; font-weight: normal; text-decoration: none; font-size: 9pt; vertical-align: -4pt; }
div.maincontent .s14 { color: black; font-family:Arial, sans-serif; font-style: normal; font-weight: normal; text-decoration: none; font-size: 7.5pt; }
div.maincontent .s15 { color: black; font-family:"Times New Roman", serif; font-style: italic; font-weight: normal; text-decoration: none; font-size: 14pt; }
div.maincontent .s16 { color: black; font-family:Arial, sans-serif; font-style: normal; font-weight: normal; text-decoration: none; font-size: 10.5pt; }
div.maincontent .s17 { color: black; font-family:Arial, sans-serif; font-style: normal; font-weight: normal; text-decoration: none; font-size: 9.5pt; }
div.maincontent .s18 { color: black; font-family:Arial, sans-serif; font-style: normal; font-weight: normal; text-decoration: none; font-size: 10.5pt; vertical-align: -1pt; }
div.maincontent .s19 { color: black; font-family:Arial, sans-serif; font-style: normal; font-weight: normal; text-decoration: none; font-size: 10.5pt; vertical-align: -5pt; }
div.maincontent .s20 { color: black; font-family:Arial, sans-serif; font-style: normal; font-weight: normal; text-decoration: none; font-size: 10.5pt; vertical-align: -2pt; }
div.maincontent .s21 { color: black; font-family:Arial, sans-serif; font-style: normal; font-weight: normal; text-decoration: none; font-size: 10pt; }
div.maincontent .s22 { color: black; font-family:Calibri, sans-serif; font-style: normal; font-weight: normal; text-decoration: none; font-size: 10.5pt; }
div.maincontent .s23 { color: black; font-family:Calibri, sans-serif; font-style: normal; font-weight: normal; text-decoration: none; font-size: 10.5pt; vertical-align: -3pt; }
div.maincontent .s24 { color: black; font-family:Calibri, sans-serif; font-style: normal; font-weight: normal; text-decoration: none; font-size: 10.5pt; vertical-align: -5pt; }
div.maincontent .s25 { color: black; font-family:"Times New Roman", serif; font-style: normal; font-weight: normal; text-decoration: none; font-size: 10.5pt; }
div.maincontent .s26 { color: black; font-family:Calibri, sans-serif; font-style: normal; font-weight: normal; text-decoration: none; font-size: 10.5pt; vertical-align: -4pt; }
div.maincontent .s27 { color: black; font-family:Calibri, sans-serif; font-style: normal; font-weight: normal; text-decoration: none; font-size: 10.5pt; vertical-align: -6pt; }
div.maincontent .s28 { color: black; font-family:Calibri, sans-serif; font-style: normal; font-weight: normal; text-decoration: none; font-size: 10.5pt; vertical-align: -1pt; }
div.maincontent .s29 { color: black; font-family:Calibri, sans-serif; font-style: normal; font-weight: normal; text-decoration: none; font-size: 11.5pt; }
div.maincontent .s30 { color: black; font-family:Calibri, sans-serif; font-style: normal; font-weight: normal; text-decoration: none; font-size: 11pt; }
div.maincontent .s31 { color: black; font-family:"Times New Roman", serif; font-style: normal; font-weight: normal; text-decoration: none; font-size: 11pt; }
div.maincontent .s32 { color: black; font-family:.VnTime, sans-serif; font-style: normal; font-weight: normal; text-decoration: none; font-size: 14pt; }
div.maincontent .s33 { color: black; font-family:Cambria, serif; font-style: normal; font-weight: normal; text-decoration: none; font-size: 10.5pt; }
div.maincontent .s34 { color: black; font-family:Cambria, serif; font-style: normal; font-weight: normal; text-decoration: none; font-size: 10.5pt; vertical-align: -4pt; }
div.maincontent .s35 { color: black; font-family:Arial, sans-serif; font-style: normal; font-weight: normal; text-decoration: none; font-size: 11.5pt; }
div.maincontent .s36 { color: black; font-family:Arial, sans-serif; font-style: normal; font-weight: bold; text-decoration: none; font-size: 14pt; }
div.maincontent .s37 { color: black; font-family:"Times New Roman", serif; font-style: normal; font-weight: bold; text-decoration: none; font-size: 13pt; }
div.maincontent .s38 { color: black; font-family:"Times New Roman", serif; font-style: normal; font-weight: normal; text-decoration: none; font-size: 13pt; }
div.maincontent .s39 { color: black; font-family:"Times New Roman", serif; font-style: normal; font-weight: normal; text-decoration: none; font-size: 15pt; }
div.maincontent .s40 { color: black; font-family:"Times New Roman", serif; font-style: normal; fo
Pre-tax Profit of Bidv Tien Giang in the Period 2011-2015
zt2i3t4l5ee
zt2a3gsnon-credit services, joint stock commercial bank
zt2a3ge
zc2o3n4t5e6n7ts
At that time, the Branch had to set aside a provision for credit risks, which reduced the Branch's income.
Chart 2.2. Pre-tax profit of BIDV Tien Giang in the period 2011-2015
Unit: Billion VND
140
120
100
80
60
40
20
0
63.3
80.34
89.29
110.08
131.99
2011 2012 2013 2014 2015
Profit before tax
(Source: Report on the implementation of the annual business plan of the General Planning Department of BIDV Tien Giang [24])
However, through chart 2.2, it can be seen that BIDV Tien Giang's profit is still increasing continuously, and its operating efficiency is currently leaking. This is a contribution of non-credit services, and this service segment will be increasingly focused on growth by BIDV Tien Giang to ensure the highest profit safety because credit activities have many potential risks. At the same time, focusing on developing non-credit services is consistent with one of the contents of restructuring the financial activities of credit institutions in the project "Restructuring the system of credit institutions in the period 2011-2015" approved by the Prime Minister in Decision No. 254/QD-TTg dated March 1, 2012 [14]: "Gradually shifting the business model of commercial banks towards reducing dependence on credit activities and increasing income from non-credit services".
2.2. Current status of non-credit service development at BIDV Tien Giang.
2.2.1. BIDV Tien Giang has deployed the development of non-credit services in recent times.
Along with the development of the Head Office, BIDV Tien Giang's products and services are constantly improved and deployed in a diverse manner to ensure provision for many different customer groups in the area: individual customers, corporate customers, and financial institutions. Typical services are as follows: Payment services, treasury services, guarantee services, card services, trade finance, other services: Western Union, insurance commissions, consulting services, foreign exchange derivatives trading, e-banking services,...
2.2.1.1. Payment services:
In accordance with the Prime Minister's Project to promote non-cash payments in Vietnam [15], banks in Tien Giang province have continuously developed payment services to reduce customers' cash usage habits through card services and electronic banking services such as: salary payment through accounts, focusing on developing card acceptance points, developing multi-purpose cards, paying social insurance by transfer, paying bills through banks, etc.
Chart 2.3. Net income from payment services in the period 2011-2015
Unit: Million VND
6000
5000
4000
3000
2000
1000
0
3922 4065
4720 5084 5324
2011 2012 2013 2014 2015
Net income from payment services
(Source: Report on the implementation of the annual business plan of the General Planning Department of BIDV Tien Giang [24])
Along with the technological development of the entire system, BIDV Tien Giang has a payment system with a fairly stable transaction processing speed, bringing many conveniences to customers. The results of observing chart 2.3 show that the income from payment services that the Branch has achieved has grown over the years but the speed is not high and the products are not outstanding compared to other banks. Domestic payment products such as: Online bill payment, electricity bills, water bills, insurance premiums, cable TV bills, telecommunications fees, airline tickets, etc. bring many conveniences to customers. Regarding international payment, this is an indispensable activity for foreign economic activities, BIDV Tien Giang is providing international payment methods for small enterprises producing agriculture, aquatic food and seafood that have credit relationships with banks in industrial parks in Tien Giang province such as: money transfer, collection, L/C payment.
2.2.1.2. Treasury services:
BIDV Tien Giang always focuses on ensuring treasury safety and currency security, always complies with legal regulations, and minimizes risks in operations such as: counting and collecting money from customers, receiving and delivering internal transactions, collecting from the State Bank (SBV) or other credit institutions, receiving ATM funds, bundling money, etc. BIDV Tien Giang's treasury service management department is always fully equipped with modern machinery and equipment such as: money transport vehicles, fire prevention tools, money counters, money detectors, magnifying glasses, etc. to ensure absolute safety in treasury operations, immediately identifying real and fake money and other risks that may affect people and assets of the bank and customers. In addition, implementing regulation 2480/QC dated October 28, 2008 between the State Bank of Tien Giang province and the Provincial Police on coordination in the fight against counterfeit money, in the 3-year review of implementation, BIDV Tien Giang discovered, seized and submitted to the State Bank of Tien Giang province 475 banknotes of various denominations and was commended by the Provincial Police and the State Bank of Tien Giang province [17].
Chart 2.4. Net income from treasury services in the period 2011-2015
Unit: Million VND
350
300
250
200
150
100
50
0
105 122
309 289 279
2011 2012 2013 2014 2015
Net income from treasury services
(Source: Report on the implementation of the annual business plan of the General Planning Department of BIDV Tien Giang [24])
However, as shown in Figure 2.4, income from treasury operations is not high and fluctuates. Specifically, in the period 2011-2013, net income increased and increased most sharply in 2013, then in the period 2013-2015, there was a downward trend. This fluctuation is due to the fact that fees collected from treasury services are often very low and can even be waived to attract customers to use other services.
2.2.1.3. Guarantee and trade finance services:
BIDV Tien Giang, thanks to the advantages of the province and the favorable location of the Branch, has continuously focused on developing income from guarantee services and trade finance.
Chart 2.5. Net income from guarantee and trade finance services in the period 2011-2015
Unit: Million VND
14000
12000
10000
8000
6000
4000
2000
0
5193 5695
2742 3420
8889
3992
11604 12206
5143 5312
2011 2012 2013 2014 2015
Net income from guarantee services Net income from Trade Finance
(Source: Report on the implementation of the annual business plan of the General Planning Department of BIDV Tien Giang [24])
Through chart 2.5, we can see that BIDV Tien Giang's income from guarantee services and trade finance has grown over the years. The reason is: Among BIDV Tien Giang's corporate customers, the construction industry is the industry with the highest proportion of customers after the trading industry, this is a group of customers with potential to develop guarantee services. The second group of customers is corporate customers in the fields of agricultural production, livestock and seafood processing with high import and export turnover in the area.
are the target of trade finance development. In addition, BIDV Tien Giang also focuses on continuously developing these customer groups to increase revenue for many other products and services in the future.
2.2.1.4. Card and POS services:
As a service that BIDV Tien Giang has recently developed strongly, it can be said that this is a very potential market and has the ability to develop even more strongly in the future. Card services with outstanding advantages such as fast payment time, wide payment range, quite safe, effective and suitable for the integration trend and the Project to promote non-cash payments in Vietnam. Cards have become a modern and popular payment tool. BIDV Tien Giang early identified that developing card services is to expand the market to people in society, create capital mobilized from card-opened accounts, contribute to diversifying banking activities, enhance the image of the bank, bring the BIDV Tien Giang brand to people as quickly and easily as possible. BIDV Tien Giang is currently providing card types such as: credit cards (BIDV MasterCard Platinum, BIDV Visa Gold Precious, BIDV Visa Manchester United, BIDV Visa Classic), international debit cards (BIDV Ready Card, BIDV Manu Debit Card), domestic debit cards (BIDV Harmony Card, BIDV eTrans Card, BIDV Moving Card, BIDV-Lingo Co-branded Card, BIDV-Co.opmart Co-branded Card). These cards can be paid via POS/EDC or on the ATM system. In addition, with debit cards, customers can not only withdraw money via ATMs but also perform utilities such as mobile top-up, online payment, money transfer,... through electronic banking services.
In order to attract customers with card services, BIDV Tien Giang has continuously increased the installation of ATMs. As of December 31, 2015, BIDV Tien Giang has 23 ATMs combined with 7 ATMs in the same system of BIDV My Tho, so the number of ATMs is quite large, especially in the center of My Tho City, but is not yet fully present in the districts. Basic services on ATMs such as withdrawing money, checking balances, printing short statements,... BIDV ATMs accept cards from banks in the system.
Banknetvn and Smartlink, cards branded by international card organizations Union Pay (CUP), VISA, MasterCard and cards of banks in the Asian Payment Network. From here, cardholders can make bill payments for themselves or others at ATMs, by simply entering the subscriber number or customer code, booking code that service providers notify and make bill payments.
Chart 2.6. Net income from card services in the period 2011-2015
Unit: Million VND
3500
3000
2500
2000
1500
1000
500
0
687
1023
1547
2267
3104
2011 2012 2013 2014 2015
Net income from card services
(Source: Report on the implementation of the annual business plan of the General Planning Department of BIDV Tien Giang [24])
Through chart 2.6, it can be seen that BIDV Tien Giang's card service income is constantly growing because the Branch focuses on developing businesses operating in industrial parks, which are the source of customers for salary payment products, ATMs, BSMS. Specifically, there are companies such as Freeview, Quang Viet, Dai Thanh, which are businesses with a large number of card openings at the Branch, contributing to the increase in card service fees [25].
Table 2.6. Number of ATMs and POS machines in 2015 of some banks in Tien Giang area.
Unit: Machine
STT
Bank name
Number of ATMs
Cumulative number of ATM cards
POS machine
1
BIDV Tien Giang
23
97,095
22
2
BIDV My Tho
7
21,325
0
3
Agribank Tien Giang
29
115,743
77
4
Vietinbank Tien Giang
16
100,052
54
5
Dong A Tien Giang
26
97,536
11
6
Sacombank Tien Giang
24
88,513
27
7
Vietcombank Tien Giang
15
61,607
96
8
Vietinbank - Tay Tien Giang Branch
6
46,042
38
(Source: 2015 Banking Activity Data Report of the General and Internal Control Department of the Provincial State Bank [21])
Through table 2.6, the author finds that the number of ATMs of BIDV Tien Giang is not much, ranking fourth after Agribank Tien Giang, Dong A Tien Giang, Sacombank Tien Giang. The number of POS machines of BIDV Tien Giang is very small, only higher than Dong A Tien Giang and BIDV My Tho in the initial stages of merging the BIDV system. Besides, BIDV Tien Giang has a high number of cards increasing over the years (table 2.7) but the cumulative number of cards issued up to December 31, 2015 is still relatively low compared to Agribank, Vietcombank, Dong A (table 2.6).
div.maincontent .content_head3 { color: black; font-family:"Times New Roman", serif; font-style: normal; font-weight: bold; text-decoration: none; font-size: 14pt; }
div.maincontent .p { color: black; font-family:"Times New Roman", serif; font-style: normal; font-weight: normal; text-decoration: none; font-size: 14pt; margin:0pt; }
div.maincontent p { color: black; font-family:"Times New Roman", serif; font-style: normal; font-weight: normal; text-decoration: none; font-size: 14pt; margin:0pt; }
div.maincontent .s1 { color: black; font-family:"Courier New", monospace; font-style: normal; font-weight: normal; text-decoration: none; font-size: 14pt; }
div.maincontent .s2 { color: black; font-family:"Times New Roman", serif; font-style: italic; font-weight: normal; text-decoration: none; font-size: 13pt; }
div.maincontent .s3 { color: black; font-family:"Times New Roman", serif; font-style: italic; font-weight: bold; text-decoration: none; font-size: 14pt; }
div.maincontent .s4 { color: black; font-family:"Times New Roman", serif; font-style: italic; font-weight: normal; text-decoration: none; font-size: 14pt; }
div.maincontent .s5 { color: black; font-family:"Times New Roman", serif; font-style: normal; font-weight: normal; text-decoration: none; font-size: 14pt; }
div.maincontent .s6 { color: black; font-family:"Times New Roman", serif; font-style: normal; font-weight: bold; text-decoration: none; font-size: 14pt; }
div.maincontent .s7 { color: black; font-family:"Times New Roman", serif; font-style: normal; font-weight: normal; text-decoration: none; font-size: 13.5pt; }
div.maincontent .s8 { color: black; font-family:Arial, sans-serif; font-style: normal; font-weight: normal; text-decoration: none; font-size: 9pt; }
div.maincontent .s9 { color: black; font-family:Arial, sans-serif; font-style: normal; font-weight: normal; text-decoration: none; font-size: 9pt; vertical-align: -2pt; }
div.maincontent .s10 { color: black; font-family:Arial, sans-serif; font-style: normal; font-weight: normal; text-decoration: none; font-size: 9pt; vertical-align: 5pt; }
div.maincontent .s11 { color: black; font-family:Arial, sans-serif; font-style: normal; font-weight: normal; text-decoration: none; font-size: 9pt; vertical-align: -5pt; }
div.maincontent .s12 { color: black; font-family:Arial, sans-serif; font-style: normal; font-weight: normal; text-decoration: none; font-size: 9pt; vertical-align: -3pt; }
div.maincontent .s13 { color: black; font-family:Arial, sans-serif; font-style: normal; font-weight: normal; text-decoration: none; font-size: 9pt; vertical-align: -4pt; }
div.maincontent .s14 { color: black; font-family:Arial, sans-serif; font-style: normal; font-weight: normal; text-decoration: none; font-size: 7.5pt; }
div.maincontent .s15 { color: black; font-family:"Times New Roman", serif; font-style: italic; font-weight: normal; text-decoration: none; font-size: 14pt; }
div.maincontent .s16 { color: black; font-family:Arial, sans-serif; font-style: normal; font-weight: normal; text-decoration: none; font-size: 10.5pt; }
div.maincontent .s17 { color: black; font-family:Arial, sans-serif; font-style: normal; font-weight: normal; text-decoration: none; font-size: 9.5pt; }
div.maincontent .s18 { color: black; font-family:Arial, sans-serif; font-style: normal; font-weight: normal; text-decoration: none; font-size: 10.5pt; vertical-align: -1pt; }
div.maincontent .s19 { color: black; font-family:Arial, sans-serif; font-style: normal; font-weight: normal; text-decoration: none; font-size: 10.5pt; vertical-align: -5pt; }
div.maincontent .s20 { color: black; font-family:Arial, sans-serif; font-style: normal; font-weight: normal; text-decoration: none; font-size: 10.5pt; vertical-align: -2pt; }
div.maincontent .s21 { color: black; font-family:Arial, sans-serif; font-style: normal; font-weight: normal; text-decoration: none; font-size: 10pt; }
div.maincontent .s22 { color: black; font-family:Calibri, sans-serif; font-style: normal; font-weight: normal; text-decoration: none; font-size: 10.5pt; }
div.maincontent .s23 { color: black; font-family:Calibri, sans-serif; font-style: normal; font-weight: normal; text-decoration: none; font-size: 10.5pt; vertical-align: -3pt; }
div.maincontent .s24 { color: black; font-family:Calibri, sans-serif; font-style: normal; font-weight: normal; text-decoration: none; font-size: 10.5pt; vertical-align: -5pt; }
div.maincontent .s25 { color: black; font-family:"Times New Roman", serif; font-style: normal; font-weight: normal; text-decoration: none; font-size: 10.5pt; }
div.maincontent .s26 { color: black; font-family:Calibri, sans-serif; font-style: normal; font-weight: normal; text-decoration: none; font-size: 10.5pt; vertical-align: -4pt; }
div.maincontent .s27 { color: black; font-family:Calibri, sans-serif; font-style: normal; font-weight: normal; text-decoration: none; font-size: 10.5pt; vertical-align: -6pt; }
div.maincontent .s28 { color: black; font-family:Calibri, sans-serif; font-style: normal; font-weight: normal; text-decoration: none; font-size: 10.5pt; vertical-align: -1pt; }
div.maincontent .s29 { color: black; font-family:Calibri, sans-serif; font-style: normal; font-weight: normal; text-decoration: none; font-size: 11.5pt; }
div.maincontent .s30 { color: black; font-family:Calibri, sans-serif; font-style: normal; font-weight: normal; text-decoration: none; font-size: 11pt; }
div.maincontent .s31 { color: black; font-family:"Times New Roman", serif; font-style: normal; font-weight: normal; text-decoration: none; font-size: 11pt; }
div.maincontent .s32 { color: black; font-family:.VnTime, sans-serif; font-style: normal; font-weight: normal; text-decoration: none; font-size: 14pt; }
div.maincontent .s33 { color: black; font-family:Cambria, serif; font-style: normal; font-weight: normal; text-decoration: none; font-size: 10.5pt; }
div.maincontent .s34 { color: black; font-family:Cambria, serif; font-style: normal; font-weight: normal; text-decoration: none; font-size: 10.5pt; vertical-align: -4pt; }
div.maincontent .s35 { color: black; font-family:Arial, sans-serif; font-style: normal; font-weight: normal; text-decoration: none; font-size: 11.5pt; }
div.maincontent .s36 { color: black; font-family:Arial, sans-serif; font-style: normal; font-weight: bold; text-decoration: none; font-size: 14pt; }
div.maincontent .s37 { color: black; font-family:"Times New Roman", serif; font-style: normal; font-weight: bold; text-decoration: none; font-size: 13pt; }
div.maincontent .s38 { color: black; font-family:"Times New Roman", serif; font-style: normal; font-weight: normal; text-decoration: none; font-size: 13pt; }
div.maincontent .s39 { color: black; font-family:"Times New Roman", serif; font-style: normal; font-weight: normal; text-decoration: none; font-size: 15pt; }
div.maincontent .s40 { color: black; font-family:"Times New Roman", serif; font-style: normal; fo -
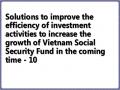 Solutions to improve the efficiency of investment activities to increase the growth of Vietnam Social Security Fund in the coming time - 10
 -
 Theoretical Basis and International Experience on Ensuring Social Security Associated with Economic Growth
 -
 Overview of the Economic, Social and Educational Situation of Dak Glong District, Dak Nong Province
 -
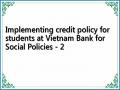 Implementing credit policy for students at Vietnam Bank for Social Policies - 2

year
Source: General Statistics Office
Vietnam's relatively high economic growth rate in recent years is due to the fact that all economic sectors have high annual growth rates.
Table 1 - Economic growth rate (GDP) from 1997 - 2007 (%)
Year
1997 | 1998 | 1999 | 2000 | 2001 | 2002 | 2003 | 2004 | 2005 | 2006 | 2007 | |
GDP | 8.15 | 5.76 | 4.77 | 6.79 | 6.89 | 7.08 | 7.34 | 7.79 | 8.44 | 8.17 | 8.44 |
NLTS | 4.33 | 3.53 | 5.53 | 4.63 | 2.89 | 4.17 | 3.62 | 4.36 | 4.02 | 3.3 | 3.0 |
Construction | 12.62 | 8.33 | 7.68 | 10.07 | 10.39 | 9.48 | 10.48 | 10.22 | 10.69 | 10.37 | 10.4 |
DV | 7.14 | 5.08 | 2.25 | 5.32 | 6.10 | 6.54 | 6.45 | 7.26 | 8.48 | 8.29 | 8.5 |
Source: General Statistics Office
According to the United Nations Human Development Report 2007/2008, Vietnam's GDP per capita in 2005 was 631 USD, the GDP growth rate per capita in Vietnam was about 5.9%/year in the period 1990 - 2005 [37,284]. In 2007, GDP per capita reached 835 USD. According to the Government's Report at the 4th Session of the 12th National Assembly (October - November 2008), Vietnam could reach a GDP per capita in 2008 of 1050 - 1100 USD.
Chart 2: Average economic growth rate over periods (%)
9
8
8.2
average speed
7.86
7
6.96
6
6.025
5
4.46
4
3
2
1
0
1986-1990
1991-1995
1996-2000
2001-2005
2007-Quarter I/2008
Source: General Statistics Office
- About economic structure :
In addition to the high growth rate, the structure of our country's economy in recent years has had a positive shift, with the proportion of economic sectors with increasing added value. Considering the economic structure according to three sectors (agriculture - forestry - fishery, industry - construction and services), it can be seen that the proportion of agriculture - forestry
- The share of fisheries in GDP has steadily decreased and the share of industry and services has increased accordingly.
The proportion of agriculture, forestry and fishery in GDP decreased from 38.06% in 1986 to 27.76% in 1996, 22.24% in 2003, 20.36% in 2006 and 20.30% in 2010.
2007; while the contribution rate in GDP of industry and construction increased during the period.
up, from 28.88% in 1986 to 29.73% in 1996 and 41.5% in 2006, 41.58% in 2007. Similar to industry - construction, the contribution rate in GDP of services also increased very quickly from 33.06% in 1976 to 42.51% in 1996, 37.99% in 2003, 38.08% in 2006 and 38.12% in 2007.
100%
80%
60%
40%
20%
0%
Chart 3: Proportion of industries in GDP (%)
Translation
Industry and Construction Agriculture - Forestry - Industry
1986
1987
1988
1989
1990
1991
1992
1993
1994
1995
1996
1997
1998
1999
2000
2001
2002
2003
2004
2005
2006
2007
Source: General Statistics Office
In recent years, in terms of the proportion of added value in GDP, the economic structure has changed according to the shift of the two groups of agriculture - forestry - fishery and industry - construction. The proportion of the agriculture - forestry - fishery sector (aquaculture) has decreased from 24.53% in 2000 to 20.30% in 2007 and the proportion of the industry - construction sector has increased from 36.37% in 2000 to 41.58% in 2007. Of which, the service sector still fluctuates at 38-39% (at current prices). Considering them in the period 2001-2005, and 2006 to present, the shift of economic structure between the three sectors is not as strong as in the 10-year period 1990-2000.
In the agriculture - forestry - fishery sector, the structure changed mainly according to the shift between the two groups of sectors: agriculture and fishery. At current prices, the proportion of added value of the fishery sector in the added value of the entire agriculture - forestry - fishery sector increased from 16.1% in 2001 to 18.49% in 2005. The proportion of the agricultural sector decreased from 78.55% in 2001 to 75.77%.
2005. Meanwhile, the proportion of the forestry sector remained unchanged, increasing only from 5.47% in 2001 to 5.74% in 2005.
In general, agriculture, forestry and fishery still hold an important position in the national economy. Although the contribution rate to GDP of this sector is decreasing in line with the trend of modern economic restructuring, the average growth rate of agriculture, forestry and fishery from 1990 to 2006 was 5.7%/year (calculated at 1994 comparable prices), the export value of agriculture, forestry and fishery was about 9.5%/year; especially the export value of fishery, increased by an average of more than 14.6%. Food production has continuously grown strongly (rice and corn). Rice and corn production increased from 19,225.1 thousand tons and 671 thousand tons in 1990 to 32,529.5 thousand tons and 2,005.9 thousand tons in 2000 and 35,826.8 thousand tons and 38,19.4 thousand tons in 2006. In 2007 alone, rice production for the three crops reached 35.87 million tons, an increase of 0.1% compared to 2006; corn production was 4.11 million tons, an increase of 8.2% compared to 2006.
The output of many annual industrial crops such as jute, sugarcane, peanuts, and soybeans all increased compared to the previous year, due to increases in both area and productivity. The output of most high-value export crops such as rubber, pepper, cashew, and tea all increased from 8.3% to 14.4% in 2007 compared to 2006 due to expansion in area and increased productivity.
Livestock and poultry farming continues to develop. However, the growth rate is not high and uneven among localities. According to the livestock survey results at August 1, 2007, the whole country had nearly 3 million buffaloes, an increase of 2.6% compared to 2006; 6.7 million cows, an increase of 3.3%; 226 million poultry; an increase of 5.3%.
The area of concentrated forest plantations nationwide is estimated at 194.7 thousand hectares, the area of forest regeneration is 969.3 thousand hectares, and the area of forest being cared for is 487.2 thousand hectares. Thanks to the promotion of planting, forest regeneration, the area of the whole country in 2007 is estimated at nearly 12.85 million hectares, an increase of 311 thousand hectares compared to 2006; raising the forest coverage rate from 37.9% in 2006 to 38.8% in 2007.
The country's aquatic product output in 2007 was estimated at 4.15 million tons, up 11.5% over 2006, of which aquaculture output was 2.09 million tons, up 23.1%.
In the industrial sector , in terms of current prices, the proportion of added value of the processing industry in the added value of the entire industrial sector increased insignificantly, from 59.16% in 2000 to 59.71% in 2005[12,16]. However, in terms of 1994 prices, this proportion increased from 67.52% in 2000 to 72.54% in 2005. This shows that in recent years there have been large changes in prices between different groups of goods within the industrial sector. Prices of processed industrial goods tend to decrease, while prices of the mining industry, the electricity, gas and water production and distribution industry have increased significantly. Specifically, the proportion of the processing industry in the added value of industry and construction has increased from 50.5% in 2000 to 51%/year in 2005; The proportion of the mining industry decreased from 26.3% to 25%; the proportion of the electricity, gas and water production and distribution industry decreased from 8.6% to 8.4%; the proportion of the construction industry increased from 14.6% to 15.8%.
The industry and construction sector has also made remarkable progress since 1988, with an estimated average growth rate of 9.4% per year in the period 1986 - 2005. From 1991 to present, the average growth rate has always been over 10%. In 2007 alone, industrial production at 1994 comparable prices increased by 17.1% compared to 2006.
Industrial production value at 1994 comparable prices by industry: mining industry increased from 13,919.7 billion VND in 1995 to 27,334.6 billion VND in 2000 and 38,848.9 billion VND in 2006; the value of processing industry increased from 83,260.5 billion VND in 1995 to 158,097.9 billion VND in 2000 and 420,144.7 billion VND in 2006; the value of electricity, gas and water production and distribution increased from 6,194.5 billion VND in 1995 to 14,703.4 in 2000 and 28,498.5 billion VND in 2006.
The service sector also has a very fast growth rate. The growth rate of the service sector from 1986 to 2005 was about 6.7%, especially in the period 2000 - 2005 the average annual growth rate was 7%. Although the proportion of this sector in the economic structure decreased from 41.8% in the period 1991 - 1995 to 38.2% in the period 2000 - 2005. But in the future, this sector will certainly