Table 2.3. Output of agricultural, forestry and fishery products in 1995-2001
Unit
1995 | 1996 | 1997 | 1998 | 1999 | 2000 | 2001 | ||
Paddy | 1,000 tons | 3,300 | 3,390 | 3,415 | 3,510 | 3,800 | 3,762 | 3,950 |
Rubber | 1,000 tons | 31 | 42 | 35 | 36 | 46 | 40 | 42 |
Round wood | 1,000m3 | 31 | 136 | 442 | 283 | 161 | 40 | 246 |
Fish | 1,000 tons | 113 | 104 | 115 | 122 | 284 | 40 | 182 |
Maybe you are interested!
-
 VNPT brand building strategy in the process of international economic integration - 10
 -
 Building customer strategies of Vietnamese commercial banks in the process of international economic integration - 9
 -
 Malaysia's policy of attracting foreign direct investment in the process of international economic integration - current situation, experience and possibility of application in Vietnam - 3
 -
 Promoting the export of goods in the Lao People's Democratic Republic in the process of international economic integration - 18
 -
 Solutions to Improve Vietnam's Tax System in the Process of International Economic Integration
Source: Cambodia Economic Watch 2004 – 2005 – 2006, (2006), Economic Institute of Cambodia, Phnom Penh. [33]
The agricultural sector recovered and achieved a growth rate of 8.2% in 2003, the highest rate in the last 7 years, thanks to favorable weather conditions. Rice alone increased by 26.9% thanks to abundant rainfall. Livestock and poultry contributed very effectively to the country's GDP growth.
2001 | 2002 | 2003 | 2004 | 2005 | |
Rice | 4.5 | -8.7 | 26.9 | -11.9 | 7.5 |
Other crops | 8.0 | 8.5 | 5.2 | 5.4 | 5.3 |
Animal husbandry | -1.8 | 1.8 | 7.4 | 1.2 | 2.2 |
Fishing | 4.6 | 3.1 | -3.6 | -7.4 | 1.1 |
Rubber and forestry | -19.8 | -30.2 | -2.1 | -2.7 | -0.4 |
All agriculture | 2.6 | -0.9 | 8.2 | -4.2 | 4.1 |
Table 2.4. Growth rate of product value of agricultural sectors(next year compared to previous year, unit: %)
Formatted: Font: Bold, Font color: Auto, English (US)
Formatted: Font color: Auto, English (US)
Formatted: Font color: Auto
Formatted: Centered, Space Before: 3 pt, After: 3 pt, Line spacing: At least 17 pt, Position: Horizontal: Center, Relative to: Margin
Formatted: Font: Bold, Font color: Auto
Formatted: Font color: Auto
Formatted: Centered, Space Before: 3 pt, After: 3 pt, Line spacing: At least 17 pt, Position: Horizontal: Center, Relative to: Margin
Formatted: Font: Bold, Font color: Auto
Formatted: Font color: Auto
Formatted: Centered, Space Before: 3 pt, After: 3 pt, Line spacing: At least 17 pt, Position: Horizontal: Center, Relative to: Margin
Formatted: Font: Bold, Font color: Auto, English (US)
Formatted: Centered, Space Before: 3 pt, After: 3 pt, Line spacing: At least 17 pt, Position: Horizontal: Center, Relative to: Margin
Formatted: Font color: Auto, English (US)
Formatted: Font color: Auto, English (US)
Source: Cambodia Economic Watch 2004 – 2005 – 2006, (2006), Economic Institute of Cambodia, Phnom Penh. [33]
However, the sudden decline in the fishing industry in 2003, minus 3.6% compared to 2002 and in 2004 minus 7.4% compared to 2003, was a disaster.
Formatted Formatted Table Formatted Formatted Deleted: (2.4).¶ Formatted: Left Formatted Formatted
Formatted: Font: Bold, English (US)
Deleted: 2
Formatted: Font: Bold, English (US)
Formatted: Font: Bold, English
Formatted: Font: Bold, English
Formatted: Font: Bold, English
... [4]
... [5]
... [6]
... [7]
... [8]
... [9]
serious. Inadequate fisheries management at both the middle and upper levels.
and communities. However, fishermen can be trained
Formatted Formatted
... [10]
... [11]
Formatted: Font: 1 pt, Vietnamese
on resource management and they will find the possibility of poverty eradication without any other choice. The government has made efforts to prevent illegal logging, promote community-based afforestation activities. A jump in international rubber prices seemed to help the industry recover but is struggling due to aging rubber trees. With fertile land and the prospect of privatization of rubber companies, production management and expansion of capital investment in rubber production are promising. On the other hand, unpredictable weather conditions have always been a hindrance to agriculture.
p
)
Deleted: 
Formatted: Font color: Auto
Formatted: Left, Level 5, Indent: First line: 1.06 cm, Tabs: 0 cm, Left
+ Not at 11.11 cm
Deleted: 
Formatted: Font: Bold, Font color: Auto
Deleted: 4
Formatted: Font: Bold, Font color: Auto
Formatted: Font: Bold, Font color: Auto
Formatted: Font: Bold, Italic, Font color: Auto
Formatted: Font: Bold, Font color: Auto
Formatted: Font: Bold, Font color: Auto
Formatted: Font: Bold, Font color: Auto
Formatted: Font: 11 pt, Italic, Font color: Auto, Condensed by 0.5 pt
Formatted: Right, Indent: First line:
1.06 cm, No widow/orphan control
Formatted: Indent: First line: 1 cm
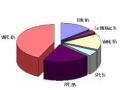
* The industrial sector achieved a growth rate of 9.6% in 2003. However, the garment, electricity and clean water industries maintained high growth rates. The garment industry in 2002 increased by 14.3%, electricity and clean water increased by 13.8%, construction and mining increased by 10.0%. In particular, the wood processing, paper and fertilizer industries in 2002 shrank compared to 2001.
Table 2.5. Growth rate of product value of industrial sectors(year after year, unit: %)
2001 | 2002 | 2003 | 2004 | 2005 | |
Garment | 29.6 | 14.3 | 13.4 | 25.6 | -1.3 |
Food and tobacco | 3.6 | 2.8 | 2.5 | 2.1 | 1.8 |
Other productions | -3.5 | 2.1 | 2.2 | 1.9 | 1.0 |
Electricity, gas and clean water | 14.3 | 13.8 | 13.7 | 13.4 | 12.6 |
Construction and mining | -8.1 | 10.0 | 7.5 | 4.4 | 3.2 |
Total industry | 11.1 | 10.4 | 9.6 | 15.6 | 0.6 |
Source: Cambodia Economic Watch 2004 – 2005 – 2006, (2006), Economic Institute of Cambodia, Phnom Penh. [33]
In 2004, Cambodia's light industries including textiles, footwear, food, beverages and tobacco grew by 14% compared to 11% in 2003. In particular, the "textiles, beverages and footwear" sector had a total turnover of
520 million USD, an increase of 20% compared to 2003 (only 17% in 2003). The rapid growth rate of the beverage industry is due to diversified demand, especially demand from the United States - the main market for the Cambodian beverage industry. The Construction industry is growing strongly, although the growth rate has slowed down to 7.5% in 2003, compared to 10% in 2002. Non-civil private construction has increased rapidly, but the development of public infrastructure has been slowed by limited government funding. The Construction industry has achieved positive growth since 2004, with private construction appearing to accelerate the growth rate and reaching 30% of the total value of implementation in 2004. Public construction has also been developed in accordance with the capital approved by the Government. The development of the construction industry will be enhanced in the future, when foreign aid for infrastructure construction continues.
* The service sector grew by 7.4% in 2002 and 2.9% in 2003 (Table 2.6). The growth of the service sector in 2004 was based on the recovery trend of the tourism industry. The total number of international tourists in 2004 increased by 46% compared to 2003. The number of tourists from Korea increased dramatically (over 145%), tourists from Taiwan and Thailand were 68%. If this trend continues to increase as in 2004, the number of international visitors to Cambodia could reach more than one million. International tourists could serve to protect and rationally exploit resources. Create new areas, outside the scope of Angkor Wat, for tourists to actually stay there once the Government can fully meet the needs of security and infrastructure.
Formatted: Font color: Auto
Deleted: 
Formatted: Font color: Auto
Formatted: Font: Italic
Deleted: I
Deleted: I
Deleted: I
Formatted: Centered, Level 5, Indent: Left: 0 cm, First line: 0 cm
Formatted: Font: Bold
Formatted: Font: Bold
Formatted: Font: Bold
Table 2.6. Growth rate of product value of service industries (next year compared to previous year, unit: %)
2001 | 2002 | 2003 | 2004 | 2005 | |
Shipping and Trading | 5.8 | 5.9 | 6.4 | 6.1 | 4.5 |
Commerce | 4.3 | 4.6 | 5.3 | 5.1 | 4.1 |
Travel, Hotels and Restaurants | 12.3 | 10.5 | - 5.3 | 21.8 | 9.7 |
Other private services | 5.2 | 6.4 | 4.9 | 7.9 | 4.9 |
Public Management | - 5.3 | 15.1 | 2.7 | 2.9 | 4.5 |
Total | 5.4 | 7.4 | 2.9 | 9.1 | 5.6 |
Formatted: Right, Indent: First line:
1.06 cm, No widow/orphan control
Deleted: 
Formatted: Font: 11 pt, Italic, Norwegian (Nynorsk)
Source: Cambodia Economic Watch 2004 – 2005 – 2006, (2006), Economic Institute
of Cambodia, Phnom Penh. [33]
In particular, the construction of small markets in villages is encouraged to facilitate the flow of products from the people and ensure stable prices of essential products such as food, gasoline, and daily necessities. Financial services play an important role in utilizing the country's limited financial resources . Credit in remote areas is partly financed through a number of commercial banks and financial institutions.The main source of credit, however, is irregular lending (loan sharks).
2.3.1.2. The integration process creates a new, more dynamic economic environment to serve the growth process and gradually shift the economic structure.
Participating in the integration process has not only made economic activities more vibrant but also created new signals and new, more specific and clearer measures for the growth process and economic restructuring.
Deleted: I
Deleted: I Deleted: I Deleted: I Deleted: I Deleted: I
2002 | 2003 | 2004 | 2005 | 2006 | |
Rice | -7.8 | 22.3 | -12.3 | 24.8 | -1.6 |
Other crops | -0.9 | 29.0 | 6.1 | 9.6 | 8.1 |
Animal husbandry | -1.2 | 5.1 | 4.3 | 3.7 | 4.1 |
Seafood | 0.6 | 1.7 | -3.3 | 11.8 | 0.9 |
Rubber and forestry | -7.6 | -5.3 | -1.5 | -0.2 | 0.0 |
The whole agricultural sector | -2.8 | 12.0 | -2.1 | 11.9 | 2.5 |
Table 2.7. Value added in the agricultural sector (% increase, constant 2000 prices)
Source: Cambodia Economic Watch 2004 – 2005 – 2006, (2006), Economic Institute of Cambodia, Phnom Penh. [33]
Table 2.7 shows significant changes in the value added in the agricultural sector in Cambodia. It is clear that this value added varies greatly from year to year by sector. For example, the value added of the rice production sector in 2003 was 22.3%, in 2004 it was -12.3%, in 2005 it was 24.8% but by 2006 it was estimated to have decreased to -1.6%. Meanwhile, the value added of livestock and some crops (other than rice, rubber and forestry) is relatively stable. This reflects the impact of integration on each sector and will promote the process of economic restructuring to achieve increasingly higher efficiency.
Similarly, Table 2.8 shows that the construction and mining industry achieved an added value of 27% in 2002 but decreased very rapidly and only reached 4.4% in 2006. The value added of the entire industry decreased from 17.7% in 2002 to 11.7% in 2005 and 9.6% in 2006. The cause of the above situation is due to many factors, including the change in prices of input and output factors (due to the integration process) in an unfavorable direction. On the other hand, in the integration process, new favorable factors have appeared. For example, in early 2007, the WB and many other prestigious organizations announced that Cambodia has reserves of up to 2 billion barrels of oil and
10,000 billion m3 of gas. This will be a strategic resource for growth.
Cambodia's economy.
2002 | 2003 | 2004 | 2005 | 2006 | |
Textile | 21.2 | 16.9 | 24.9 | 17.6 | 13.4 |
Food, drinks, tobacco | -1.2 | 5.6 | -2.1 | 1.6 | 2.0 |
Other manufacturing industries | 7.8 | 0.7 | 3.1 | 3.7 | 3.5 |
Electronics, gas | 17.1 | 15.7 | 4.7 | 5.8 | 5.7 |
Construction and mining | 27.0 | 11.0 | 13.0 | 4.6 | 4.4 |
Industry-wide | 17.7 | 12.3 | 16.5 | 11.7 | 9.6 |
Table 2.8. Value added in the industrial sector (% increase, constant 2000 prices)
Source: Cambodia Economic Watch 2004 – 2005 – 2006, (2006), Economic Institute of Cambodia, Phnom Penh. [33]
Table 2.9 shows that the rate of value added in service industries is low and uneven. In particular, the hotel and restaurant industry, although having a relatively high rate of value added, had a sudden decrease to -10.3% in 2003.
Table 2.9. Value added in the service sector (% increase, constant 2000 prices)
2002 | 2003 | 2004 | 2005 | 2006 | |
Transport and telecommunications | 7.6 | 2.3 | 6.2 | 6.9 | 5.5 |
Commerce | 0.6 | 2.2 | 6.3 | 6.7 | 5.5 |
Hotels and restaurants | 18.8 | -10.3 | 23.6 | 16.7 | 13.3 |
Other private services | 1.8 | 2.2 | 11.2 | 4.2 | 4.9 |
Total private service sector | 4.7 | 0.4 | 10.3 | 7.2 | 6.5 |
Public services | -0.3 | -4.3 | -6.8 | 1.8 | 5.6 |
All Service Industry | 4.4 | 0.1 | 9.2 | 7.0 | 6.4 |
Source: Cambodia Economic Watch 2004 – 2005 – 2006, (2006), Economic Institute of Cambodia, Phnom Penh. [33]
This is due to the objective causes of the economy. The public service industry always has a low value-added rate because
The Royal Government of Cambodia's price control and restraint policy aims to ensure the provision of minimum public services to the people. In the years 2003 - 2005, the service sectors achieved relatively stable growth, business efficiency was increasingly high, so the value added ratio of all service sectors was better than before, especially of the private service sector.
Thus, the continuous and quite strong changes in the rate of added value in narrow sectors of the economy reflect the development of new economic factors of the market mechanism and the liberalization in the integration process to the growth and efficiency of each sector. On the other hand, these are also healthy signals that create new momentum for the country's economic restructuring process.
2.3.1.3. Exploiting domestic and foreign investment capital sources creates new positions and strengths for growth and gradually shifting economic structure. A characteristic of the early stages of integration is that Cambodia mainly relies on
foreign assistance for the reconstruction of the country. As one of the poorest countries, international assistance is essential for Cambodia to overcome the challenges on the path of development. In October 1999, the IMF's poverty reduction program provided a loan of 81.6 million USD. The World Bank agreed to a credit for reconstruction worth 30 million USD in 2000, the remainder of which is being held until the Royal Government of Cambodia fully implements the reform requirements. In June 2000, donors pledged to assist the Royal Government of Cambodia with 611 million USD for the reform program in the coming years. From 1994 to the end of December 2004, 879 projects were licensed for investment with a total investment capital of 10,911.923 million USD. The average scale of a project when the Investment Law was first promulgated increased relatively rapidly: from 5.9 million USD/project in 1994 to 14.66 million USD/project in 1995. However, due to the following reasons:
Subjectively and objectively (domestic political events and regional financial and monetary crises), in the later period (1996 - June 2000), the scale of an investment project decreased. During the entire period from 1994 to June 2000, the average scale was 9.58 million USD/1 project. However, these indicators are equivalent to those of countries in the region in terms of the ability to attract foreign direct investment (FDI) and the investment situation in the world. Thus, in 10 years (1994 - 2004), each year foreign capital was brought into Cambodia about 1 billion USD, contributing significantly to the renovation, construction and development of a number of economic facilities of the country.
Formatted: Indent: First line: 1.06 cm, No bullets or numbering
Robertson and Pohoresky (1998) argue that joining AFTA will encourage foreign investors to set up manufacturing facilities in Cambodia to supply products to the ASEAN market for the following reasons:
- Cambodia is pursuing a comprehensive policy of tariff reduction. The Royal Government of Cambodia's immediate tariff reduction list includes 3,149 tariff lines (47% of lines), more than Laos (15%), and Myanmar (43%). This may encourage investors to set up production facilities in Cambodia.
Due to its location between ASEAN and the Mekong region, it can be used as a
Deleted: I
- Geo-economically, Cambodia can better attract foreign investment
strategic position along with economies of scale to attract foreign investment [36, pp.23-25].
- Joining AFTA is sending a message to foreign investors that the administrative and legal management system will be changed to meet the membership obligations, both creating a positive image for Cambodia 's investment environment and requiring the Royal Government of Cambodia to implement .
management system reform
Deleted: I
Formatted: Indent: First line: 1.06 cm
Deleted: Figure 3. Investment projects licensed by the Development Committee of Cambodia (million USD)
Source: CDRI, data from the Development Committee of Cambodia
Deleted: I Deleted: oo Deleted: à Deleted: I Deleted: au Deleted: I
Deleted: I