Figure 3.2 Positive correlation between CAP and EFCROE of Vietnamese commercial banks
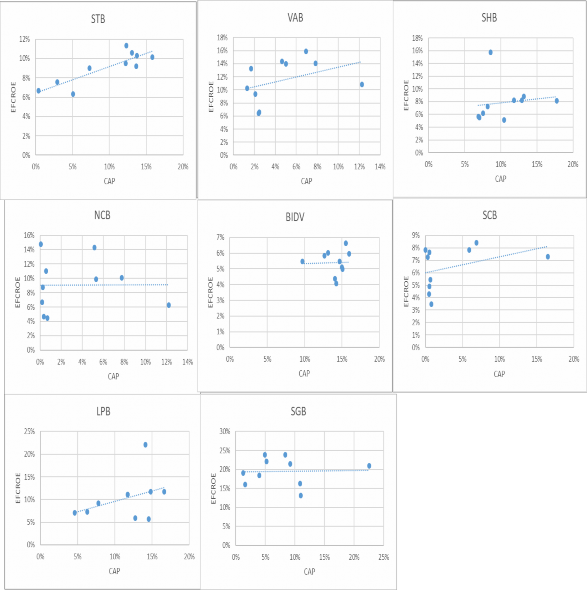
Source: Author's synthesis from financial statements of 24 VIETNAMESE COMMERCIAL BANKS from 2008-2017
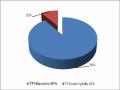
Figure 3.3 Negative correlation between CAP and EFCROE of Vietnamese commercial banks
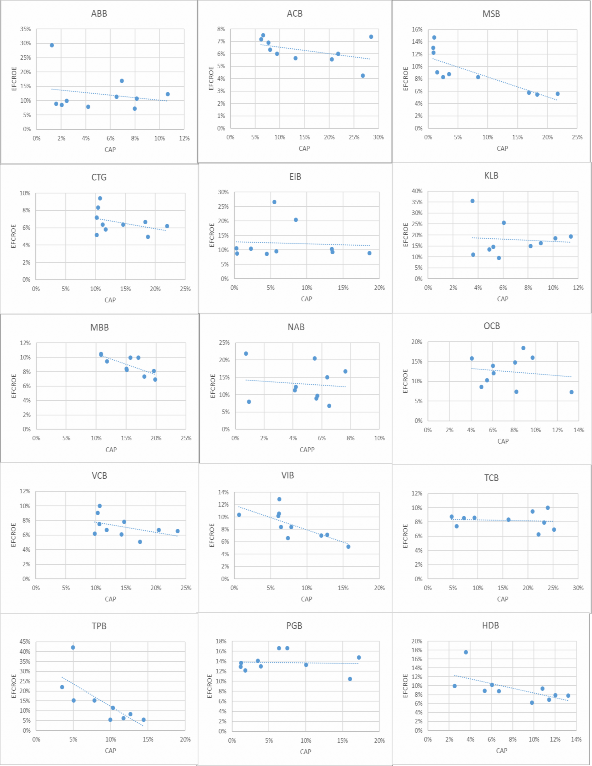
Source: Compiled from financial statements of 24 VIETNAMESE COMMERCIAL BANKS from 2008-2017
Based on the chart, we can see that there are two positive and negative correlations between EFCROE and CAP, shown in charts 2.1 and 2.2. There are 15 banks out of 24 banks showing
negative correlation between CAP and EFCROE and 9 banks showed positive correlation between CAP and EFCROE. Among 24 commercial banks, some banks have low CAP and high EFCROE such as: ACB, MSB, BIDV, SCB, VAB, PGb. The general trend between CAP and EFCROE of 24 banks is downward, the reason may be that the increase in legal capital according to regulations causes the equity to increase rapidly, leading to a rapid increase in CAP while EFCROE does not increase in time with the increase in CAP.
In summary, in recent times, the main trend of capital structure affecting bank profits is the negative correlation or increasing equity reduces profits. But this is only the initial assessment through the scatter diagram, to know more clearly this impact, the author prioritizes using quantitative methods to study this correlation. In this article, the author expects that there will be a negative correlation between EFCROE and CAP.
3.3 Research model
3.3.1 Introduction to the research model
The author relies on the research of Saona (2010) to propose a research model on the impact of capital structure on the profits of commercial banks in Vietnam. However, the author also uses the macro environmental factors of Vietnam - represented by the growth rate of total domestic assets (GDP) - taken from the research of Gul and colleagues (2011) . The specific research model is as follows:
EFCROE it f (CAP it , Z it ) e it
The dependent variable is the return on equity (EFCROE) which represents the profit of bank i in year t. And it is determined by the following independent variables: first is the equity ratio to total capital (CAP) which represents the capital structure of bank i in year t; second is the vector Z, which includes the following variables: Bank size, market concentration, Lending capacity, deposit demand, bank risk, investment in securities and a set of macro-environment control variables. Finally is the random error ei, t.
Bank size (SIZE) is measured by the natural logarithm of total assets in the bank. The SIZE variable has been included in the model of determining bank profits by most previous researchers (Al - Kayed, 2014; Berger, 1995; Saona, 2010; Bandt et al., 2014; ...) . The impact of bank size on bank profits is contradictory. Some studies indicate that bank size has a positive impact on bank profits, while others indicate a negative relationship between size and bank profits.
Market concentration determines the business efficiency of a bank by demonstrating the market power of that bank. Saona (2010) and Berger (1995) used two indexes to measure: the Herfindahl index of market concentration and the deposit market share index of bank i in year t. However, due to the limitation of data sources when applied to the Vietnamese market, in this study, the bank's deposit market share (SHARE) is considered as a proxy for market concentration. Market concentration is expected to have a positive relationship with bank profitability.
The bank's business capacity is based on the bank's lending capacity. In the model, the lending capacity variable (LOAN) is calculated as the ratio of total outstanding loans to total assets. When considering the factors affecting bank profitability, the bank's lending capacity is an indispensable factor in previous studies (A1 -Kayed, 2014; Berger, 1995; Saona, 2010; Bandt et al., 2014; ...) . A positive relationship between lending capacity and expected return on equity is expected in the results of the empirical model.
Deposit demand (DEPOSIT) is calculated as the ratio of total customer deposits at the bank to total assets. Deposit demand has an inverse relationship with the bank's profit margin.
Bank risk (SEFCORE) is measured by the standard deviation of bank return on equity over the study period (Saona, 2010) .
The growth rate of gross domestic product (GDP) represents the macroeconomic environment. The GDP growth rate reflects the fluctuations of the economy. Therefore, changes in the macroeconomic environment are expected to impact the Bank's Profit.
3.3.2 Sample selection and variable setup
In this study, the author collected data from 24 Vietnamese commercial banks over the 10 years from 2008 to 2017. These data were taken from audited financial statements of the banks over the years.
The author sets up the variables based on Saona's (2010) study but with changes in the macro variables along with the data collected to run the model. Specifically, the CAP variable is the main variable to illustrate the impact on the EFCROE variable and the variables SIZE, SHARE, LOAN, DEPOSIT, SEFCORE and GDP are used to further illustrate the impact on the EFCROE variable. The following is a list of variables in the model:
Table 3.1 List of variables used to run the model
STT
Symbol | Interpretation | Expected sign | |
1 | EFCROE it | Return on equity represents for the profit of bank i in year t. (Dependent variable) | |
2 | CAP it | The ratio of equity to total capital of bank i in year t represents the capital structure. of the bank. | - |
3 | SIZE it | The size of the bank, measured logarithmically of total assets of bank i at year t | + |
Maybe you are interested!
-

 Some Key Solutions to Promote Positive Changes and Limit Negative Changes of Socialist Production Relations in
 -
 Correlation Chart Between Inflation Fluctuation and Loan-to-Assets Dispersion
 -
 Corporate Social Responsibility (Csr) Has Positive Impact on Building and Developing Corporate Culture
 -
 Capital Growth and Profit of Some Joint Stock Commercial Banks in Ho Chi Minh City
 -
 Comparison of the Income Growth Rate of Employees and Profit Growth of 3 Joint Stock Companies.
4
SHARE it | Market concentration is represented by the market share of customer deposits of bank i in year t, measured as the ratio of bank i's deposits in year t to total deposits of all banks in year t | + | |
5 | LOAN it | Bank lending capacity, measured equal to the ratio of outstanding loans to total assets of bank i in year t | + |
6 | DEPOSIT it | The deposit demand of bank i in year t, measured by the ratio of deposits to total assets of bank i in year t | + |
7 | SEFCORE i | Bank risk, measured by the standard deviation of EFCROE of bank i in research period | - |
8 | GDPG t | Dynamic growth rate of total domestic assets (GDP) in year t. | + |
3.3.3 Research hypothesis
Hypothesis H1: The variable of equity ratio to total capital of the bank representing the capital structure of the bank is negatively related to the bank's profit.
Hypothesis H2: The bank size variable has a positive relationship with bank profit.
Hypothesis H3: The market concentration variable represented by the market share of bank customer deposits is positively related to bank profitability.
Hypothesis H4: The bank's lending ability variable has a positive relationship with bank's profit.
Hypothesis H5: The variable of bank deposit demand has a positive relationship with bank profit.
Hypothesis H6: Bank risk variables are negatively related to bank profits.
Hypothesis H7: The dynamic growth rate of total domestic assets has a positive relationship with bank profits.
3.3.4 Quantitative method
Regarding the software used to conduct the estimations, in this study the author used the Stata program. The data estimation method with panel data type was used because it combined both time and space factors.
In this study, the author uses the ordinary least squares (OLS) method to estimate the model. Next, with panel data, the commonly used estimation methods are the fixed effects estimation model (FEM) and the random effects estimation model (REM). Then, the author uses the Hausman test to evaluate whether the FEM or REM model is more suitable and selects the model. The Hausman test has the hypothesis H0: "FEM or REM is not different". If the test gives a p-value < 0.05, the hypothesis H0 is rejected and the FEM model is selected and vice versa.
However, a disadvantage of panel data with a large number of observations in a short time series is that heteroscedasticity often occurs and it is very difficult to overcome this problem. In addition, there is a problem of endogenous variables in the model, that is, two-way correlation between the explanatory variable and the explained variable, then the FEM and REM estimates are no longer effective.
To solve the above problem, the author conducts a pre-test of the defects, then uses the FGLS and GMM (Generalised Methods of Moments) estimation models to overcome the phenomenon of variance and error and handle the endogeneity problem.
3.3.5 Model running results
Descriptive statistics
Table 3.2 Descriptive statistics table of variables
Variable
Mean | Std. Dev. | Min | Max | |
efcroe | 0.093056 | 0.060969 | 0.000683 | 0.284644 |
cap | 0.10318 | 0.05337 | 0.034619 | 0.422025 |
size | 18.15605 | 1.223971 | 14.69872 | 20.90749 |
share | 0.044673 | 0.052303 | 0.001426 | 0.247891 |
loan | 0.527103 | 0.127892 | 0.113841 | 0.844766 |
deposit | 0.623743 | 0.121281 | 0.292278 | 0.893717 |
sefcroe | 0.038007 | 0.028658 | 0.000191 | 0.14655 |
GDP | 0.1139 | 0.161787 | 0.053 | 0.598 |
Source: Results from stata software based on data collected by the author
YEAR | EFCRO E | CAP | SIZE | SHARE | LOAN | DEPOSI T | SEFCRO E | GDP |
2008 | 0.098 | 0.149 | 17,030 | 0.043 | 0.518 | 0.606 | 0.037 | 0.057 |
2009 | 0.132 | 0.109 | 17,448 | 0.042 | 0.534 | 0.571 | 0.044 | 0.054 |
2010 | 0.132 | 0.107 | 17,884 | 0.042 | 0.477 | 0.505 | 0.045 | 0.064 |
2011 | 0.134 | 0.107 | 18,137 | 0.045 | 0.469 | 0.494 | 0.041 | 0.062 |
2012 | 0.083 | 0.118 | 18,109 | 0.042 | 0.506 | 0.610 | 0.034 | 0.053 |
2013 | 0.064 | 0.104 | 18,283 | 0.042 | 0.509 | 0.654 | 0.035 | 0.054 |
2014 | 0.067 | 0.092 | 18,443 | 0.042 | 0.511 | 0.686 | 0.034 | 0.598 |
2015 | 0.061 | 0.089 | 18,567 | 0.042 | 0.560 | 0.711 | 0.041 | 0.067 |
2016 | 0.066 | 0.081 | 18,745 | 0.050 | 0.584 | 0.708 | 0.031 | 0.062 |
2017 | 0.097 | 0.076 | 18,915 | 0.058 | 0.600 | 0.680 | 0.038 | 0.068 |
Table 3.3 Average values of variables by year
Source: Results from stata software based on data collected by the author. Descriptive data results show that the variables EFCROE and CAP have clear changes.
significantly over the years, while the variables SIZE, LOAN, DEPOSIT, SEFCROE and GDPG do not change much.
The author has analyzed the fluctuations and causes of the fluctuations of the variables EFCROE, CAP, SIZE, LOAN, SEFCROE in the above section. In this section, the author focuses on analyzing the variables SHARE and DEPOSIT of banks through data tables 2.2, 2.3. It can be seen that the deposit market share of banks