3.3.3. Correlation between some clinical and paraclinical factors with ASMIH reduction
Table 3.24. Logistic regression relationship between some clinical and paraclinical characteristics and reduced limb muscle mass in the diabetic group
Element
Number | Univariate | Logistic regression | ||||
P | OR 95%CI | p | OR 95%CI | |||
BMI < 23kg/m2 BMI 23kg /m2 | 66/108 | < 0.01 | 2.99 1.68 – 5.33 | < 0.01 | 2.71 1.39 5.27 | |
32/93 | ||||||
EXCUSE No FORGIVENESS | 82/146 | > 0.05 | 1.08 0.58 – 2.01 | > 0.05 | 0.68 0.27 1.71 | |
16/55 | ||||||
Pills Insulin/tablet | 60/115 | > 0.05 | 1.37 0.78 2.41 | > 0.05 | 0.92 0.61 1.41 | |
38/86 | ||||||
> 7.3mmol/l < 7.3mmol/l | 52/115 | > 0.05 | 0.72 0.41 1.25 | > 0.05 | 0.76 0.43 1.35 | |
46/86 | ||||||
HbA1C ≥ 7.5% HbA1C < 7.5% | 61/113 | > 0.05 | 1.61 0.92 2.83 | > 0.05 | 1.01 0.55 1.84 | |
37/88 | ||||||
Maybe you are interested!
-
 Correlation of Some Clinical and Paraclinical Characteristics with Risk Stratification According to Who/ish Score
 -
 Study on Some Clinical and Paraclinical Features of Appendiceal Abscess
 -
 Epidemiological, molecular biological, clinical, paraclinical characteristics and factors affecting the effectiveness of treatment of chronic hepatitis B virus with antiviral drugs - 21
 -
 Clinical and Paraclinical Characteristics of Pregnant Women with Placenta Previa at Hanoi Obstetrics and Gynecology Hospital
 -
 Clinical and Paraclinical Features of Lacrimal Gland Tumor
Comment
In univariate and logistic regression analysis, BMI was an independent factor associated with the risk of muscle loss in patients with type 2 diabetes.
fairy
Type 2 diabetic patients with BMI < 23kg/m2 had a 3.753 times higher risk of muscle loss in univariate analysis and 2.715 times higher risk in multivariate analysis compared with type 2 diabetic patients with BMI > 23kg/m2.
Table 3.25. Relationship between limb muscle mass and some factors
Element
p | Correlation coefficient | |
BMI | < 0.001 | 0.447 |
HATTh | > 0.05 | 0.125 |
HATTr | > 0.05 | 0.008 |
Glucose | > 0.05 | 0.006 |
HbA1C | > 0.05 | 0.011 |
Comment: In the group of diabetic patients, there was a positive correlation between muscle mass and
and body mass index with p < 0.001 and correlation coefficient r = 0.447.
Male Female
Figure 3.9. Correlation between ASMIH and BMI by gender
Comment: At
group of diabetic patients
strong positive correlation
The correlation between limb muscle mass and BMI in both men and women was statistically significant p < 0.001, with r = 0.772 and r = 0.446.
3.3.4. The relationship between some clinical and paraclinical factors with reduced walking speed and hand strength in the diabetic group
Table 3.26. Correlation between some clinical and paraclinical characteristics and reduced walking speed of diabetic patients
Element
Number patient | Univariate | Logistic regression | ||||
p | OR 95%CI | p | OR 95%CI | |||
BMI < 23kg/m2 BMI 23kg/m2 | 37/108 | > 0.05 | 1.27 0.70 2.31 | > 0.05 | 1.04 0,561,94 | |
27/93 | ||||||
EXCUSE No FORGIVENESS | 52/146 | > 0.05 | 1.98 0.96 – 4.08 | > 0.05 | 1.08 0.49 2.37 | |
12/55 | ||||||
Pills Insulin/tablet | 33/115 | > 0.05 | 0.71 0,391,29 | > 0.05 | 0.97 0.66 1.42 | |
31/86 | ||||||
Glucose >7.3 mmol/l Glucose <7.3 mmol/l | 38/115 | > 0.05 | 1.13 0.62 2.07 | > 0.05 | 0.79 0,471,33 | |
26/86 | ||||||
HbA1C ≥ 7.5% HbA1C < 7.5% | 36/113 | > 0.05 | 1.00 0.551.82 | > 0.05 | 0.70 0,411,19 | |
28/88 | ||||||
Comment
Logistic regression did not find any factors that were independent predictors of reduced walking speed in patients with type 2 diabetes.
Table 3.27. Logistic regression relationship between reduced hand strength and some clinical and paraclinical characteristics of diabetic patients
Element
Number patient | Univariate | Logistic regression | ||||
p | OR 95%CI | p | OR 95%CI | |||
BMI < 23kg/m2 BMI 23kg/m2 | 66/108 | > 0.05 | 0.98 0.531.81 | > 0.05 | 1.31 0,702,46 | |
32/93 | ||||||
EXCUSE No FORGIVENESS | 82/146 | > 0.05 | 0.87 0,441,71 | > 0.05 | 0.52 0,211,29 | |
16/55 | ||||||
Pills Insulin/tablet | 60/115 | > 0.05 | 0.89 0,481,64 | > 0.05 | 0.89 0.601.33 | |
38/86 | ||||||
Glucose >7.3mmol/l Glucose <7.3mmol/l | 52/115 | > 0.05 | 1.44 0.643.24 | > 0.05 | 0.81 0,471,39 | |
46/86 | ||||||
HbA1C ≥ 7.5% HbA1C < 7.5% | 61/113 | > 0.05 | 1.72 0,913,24 | > 0.05 | 1.05 0,601,84 | |
37/88 | ||||||
Comment
In logistic regression, no factor was found.
which is the factor
fairy
independent of hand strength loss in patients with type 2 diabetes.
3.4. EVALUATION OF EFFECTIVENESS BY TRAINING
3.4.1. Clinical and paraclinical changes of the diabetes group before and after exercise
Table 3.28. Clinical and paraclinical characteristics of the group of patients participating in the study
Characteristic
Age: 64.8 ± 2.9 (years)
Number of patients (n=56) | Proportion% | |
Time of disease detection (years) | ||
5 | 13 | 23.2 |
> 5 10 | 21 | 37.5 |
> 10 | 22 | 39.3 |
BMI (kg/m2) | ||
< 18.5 | 0 | 0.0 |
18.5 22.9 | 34 | 60.7 |
23 24.9 | 16 | 28.6 |
≥ 25 | 6 | 10.7 |
Blood pressure | ||
Increase | 47 | 83.9 |
Normal | 9 | 16.1 |
Diabetes medication | ||
Pills | 34 | 60.7 |
Insulin | 7 | 12.5 |
Pills and insulin | 15 | 26.8 |
Blood glucose (mmol/l) | ||
4.0 7.2
23 | 41.1 | |
7.3 10.0 | 23 | 41.1 |
> 10.0 | 10 | 17.8 |
HbA1C (%) | ||
> 8.5 | 9 | 16.1 |
7.5 8.5 | 21 | 37.5 |
≤ 7.5 | 26 | 46.4 |
Comment:
The exercise group had an equal duration of illness among the three groups. According to BMI classification, 60.7% of patients had normal body condition, 39.3% were overweight and obese. 83.9% of patients had hypertension and up to
56.1% of patients were taking tablets. 17.8% and HbA1C > 8.5% had 16.1%.
Only
blood glucose > 10.0mmol/l, yes
Table 3.29. Characteristics of clinical and paraclinical indicators
before and after training 12 months
Characteristic
Before | After | p | |
Weight (kg) | 55.29 ± 6.71 | 55.79 ± 6.65 | > 0.05 |
BMI (kg/m2) | 22.68 ± 1.65 | 22.99 ± 1.79 | > 0.05 |
TTh blood pressure | 139.1 ± 7.7 | 131.5 ± 8.3 | < 0.01 |
TTr blood pressure | 87.2 ± 3.3 | 81.2 ± 5.2 | < 0.01 |
Glucose (mmol/l) | 8.42 ± 2.26 | 7.56 ± 1.18 | < 0.05 |
HbA1C (%) | 7.98 ± 1.28 | 7.16 ± 0.50 | < 0.01 |
Triglycerides (mmol/l) | 1.77 ± 0.75 | 1.45 ± 0.71 | < 0.05 |
Cholesterol (mmol/l)
)
5.04 ± 1.14 | 4.54 ± 1.22 | < 0.05 | |
LDLC (mmol/l) | 2.89 ± 0.89 | 2.24 ± 0.85 | < 0.05 |
HDLC (mmol/l) | 1.34 ± 0.65 | 1.54 ± 0.34 | < 0.05 |
Comment:
Weight, glucose, HbA1C, LDLC and blood pressure indices decreased significantly after exercise compared to before exercise with p < 0.05 0.01.
HDLC index increased before compared with after exercise with p < 0.05.
BMI tended to increase but the difference was not statistically significant with p > 0.05.
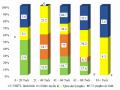
Figure 3.10. Changes in blood glucose at times 0, 3, 6, 9, 12
month
Comment:
Fasting blood glucose values decreased gradually over time. After 3 months, blood glucose values decreased compared to before training, however, the difference was not statistically significant with p > 0.05. From 6 months after training, blood glucose values continued to decrease and remained stable compared to before training. The difference was statistically significant with p < 0.001.
Figure 3.11. Changes in HbA1C before and after exercise, after 3, 6, 9, 12 months
Comment:
Blood HbA1C values gradually decreased over time. After 3 months, blood HbA1c values decreased compared to before training, the difference was not statistically significant with p < 0.01. From 6 months after training onwards, blood HbA1C values continued to decrease and remained stable compared to before training. The difference was statistically significant with p < 0.001.