3.2.1.2. Correlation between oil price and rubber price
Since synthetic rubber (the main substitute for natural rubber) is an oil-based product, changes in oil prices directly affect the price of synthetic rubber.
7000
140
6000
120
5000
100
4000
80
3000
60
Rubber (USD/ton)
Oil (USD/barrel)
2000 40
1000
20
0
0
USD/ton
USD/barrel
The graph below shows the correlation between oil prices and rubber prices during the period 2006 to 2016.
10-2006
06-2007
02-2008
10-2008
06-2009
02-2010
10-2010
06-2011
02-2012
10-2012
06-2013
02-2014
10-2014
06-2015
02-2016
Chart 3.3: Correlation between oil price and rubber price in the period 2006-2016
(Source: Author's own synthesis based on data from website: www.indexmundi.com)
From the graph, we can see the close correlation between rubber prices and oil prices in the period before 2011. In the period 2011 - 2015, the impact of oil prices on rubber prices decreased due to shale oil production technology reducing oil production costs, causing oil prices to drop rapidly. However, the close correlation began to reappear from 2016 when oil prices and rubber prices hit bottom and prices recovered. Therefore, in the coming period, if there is no emergence of technology that dramatically changes oil prices or rubber prices, we can continue with the assumption of a close correlation between oil prices and rubber prices.
3.2.1.3. Demand for rubber products
Based on the structure of natural rubber and synthetic rubber usage shown below, we can see that the automotive industry (tire and tube products) accounts for a large proportion of rubber consumption.
High usage structure
self-defense
Automotive industry
8.00%
8.80%
Pharmaceutical Industry
13.30%
69.90%
Manufacturing Industry
Consumer goods
High usage structure
damage
Automotive industry
11.00%
2.00%
6.00%
Pharmaceutical Industry
81.00%
Manufacturing Industry
Consumer goods
Figure 3.4: Structure of natural rubber usage
(Source: Vietnam Rubber Association)
Growth rate
We have the graph of Vietnam's GDP Growth, World GDP with correlation of automobile manufacturing industry shown below.
10.00
8.00
6.00
4.00
2.00
0.00
2000 | 2001 | 2002 | 2003 | 2004 | 2005 | 2006 | 2007 | 2008 | 2009 | 2010 | 2011 | 2012 | 2013 | 2014 | 2015 | ||
Total GDP growth % | 6.80 | 6.90 | 7.10 | 7.30 | 7.80 | 8.40 | 8.20 | 8.48 | 6.18 | 5.32 | 6.78 | 5.89 | 5.25 | 5.42 | 5.98 | 6.68 | |
Agriculture % | 4.60 | 3.00 | 4.20 | 3.60 | 4.40 | 4.00 | 3.70 | 3.40 | 4.07 | 1.82 | 2.78 | 4.01 | 2.68 | 2.64 | 3.49 | 2.41 | |
Maybe you are interested!
-
 Prices of Recyclable Materials
 -
 GDP and GDP Growth Rate of Hanoi as of December 31, 2006, by Economic Sector - Calculated at 1994 Prices
 -
 Accounting for production costs and construction product prices at HTH Industrial Construction Investment Joint Stock Company - 16
 -
 Completing the accounting organization to collect production costs and calculate product prices at Quang Ninh Seafood Export Joint Stock Company 2 - 2
 -
 State management of land prices - 26
Chart 3.5: GDP growth in the period 2010-2015
(Source: General Statistics Office)
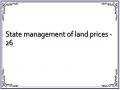
Figure 3.6: Correlation between automobile sales growth and economic GDP growth
world 1998 – 2014
(Source: www.bloomberg.com)
Through the graph, it can be seen that the Vietnamese and world economies are in the recovery phase, but there are no signs of a strong recovery. In the next phase of the economic cycle, in the recovery phase of consumer confidence as well as their incomes begin to increase, companies producing high-value consumer goods such as automobiles have the conditions to increase production, thereby leading to growth potential for raw material supply industries such as rubber.
According to the General Department of Customs, China and India were the two largest rubber consuming markets of Vietnam in the first 9 months of 2016, accounting for 65.5% of the market share. The export value of rubber to these two markets increased by 20.3% and 14.9% respectively compared to the same period in 2015. Therefore, the demand for rubber for the tire industry of these two countries has greatly affected the Vietnamese rubber industry. Although up to now, there has been no major decline in the Chinese tire and automobile industry. However, the potential risks of the Chinese economy as well as the automobile manufacturing industry always exist, which is a threat to the growth potential of the Vietnamese natural rubber industry in the future.
3.2.1.4. Exchange rates and trade agreements
Vietnam's policy of stabilizing exchange rates and controlling inflation in recent years has made the Vietnamese Dong stronger relative to the currencies of exporting countries in the region. This will make Vietnam's rubber export price when converted to USD less competitive with other countries.
Exchange rate change
12.00%
10.00%
8.00%
6.00%
4.00%
2.00%
0.00%
Exchange rate changes
2011 2012 2013 2014 2015 2016
Chart 3.7: Changes in USD/VND exchange rate during 2011-2016
(Source: ADB)
4
3.5
3
2.5
2
1.5
1
0.5
0
Consumer price index %
Consumer price index %
-0.5 Months
1/2010
Month Month Month Month Month January 2011 January 2012 January 2013 January 2014 January 2015 January 2016
-1
Chart 3.8: Consumer price index period January 2010 – September 2016
(Source: ADB)
At the same time, Vietnam's main export market (accounting for about 57%) is China, so the sharp devaluation of the Yuan in 2015 has affected
affecting Vietnam's rubber exports. However, on October 1, 2016, the Chinese Yuan (CNY) officially entered the international currency basket, also known as the Special Drawing Rights (SDR). Currently, the CNY only accounts for about 1% of the international payment system, so to support the Chinese government and facilitate the internationalization of the CNY, the IMF resolution has stipulated a new ratio in the international currency basket as follows: USD 41.73%, Euro 30.98%, CNY 10.92%, Japanese Yen 8.33% and British Pound 8.09%. With its entry into the international currency basket, in the author's opinion, China will be more responsible for the value of its currency, so it can be believed that the scenario of a sudden devaluation of the CNY like in 2015 will be unlikely to happen.
The signed Trans-Pacific Partnership (TPP) Free Trade Agreement creates many tax incentives for the rubber industry, but there is currently a potential possibility that some countries will cancel the TPP due to political changes.
3.1.2.5. Climate and weather affect rubber production
As an agricultural production industry, the output and quality of rubber latex are greatly affected by the weather. Accordingly, the La Nina phenomenon following El Nino will negatively affect the output of natural rubber in the short term because prolonged rain will partly affect the productivity of rubber latex exploitation, thereby positively affecting the price of natural rubber.
Rubber trees prefer water but cannot withstand waterlogging and wind. They can withstand up to 4 months of drought, but this will reduce the yield with a total tapping period of 9 months/year. The quality of rubber latex harvest depends largely on the weather conditions of the year and is of the highest quality when the weather is sunny. The El-Nino phenomenon has led to drought in some major producing countries such as Indonesia, Thailand and India, thereby reducing rubber production in 2016. In addition, the dry weather has also indirectly created fog in Malaysia and Indonesia, causing rubber trees to lack sunlight and affecting rubber quality. Meanwhile, the La-Nina phenomenon is forecast to appear in late 2016, also significantly affecting rubber production. Following the La-Nina event in 2011, increased rainfall caused floods in Thailand, leading to a shortage of supply and pushing up rubber prices.
The highest level in history in 2011. In addition, higher than normal rainfall will negatively affect the quality of rubber latex, and reduce the number of rubber tapping days in a year.
3.1.2.6. Some trends of the rubber industry in the coming time
- The Southeast, Central Highlands and Central Coast are areas where rubber is grown quite concentratedly, but the potential for expansion is low. Meanwhile, the Northern region has unfavorable climate and soil conditions for rubber growing. Therefore, Vietnamese rubber companies focus on expanding rubber acreage in Cambodia and Laos. However, due to the impact of Global Witness's accusations on the environment of these countries, the origin of Vietnamese rubber will be affected in markets with strict requirements on origin.
- Vietnam Rubber Group has begun to direct its members to develop rubber products such as gloves, elastic threads, rubber sports balls, rubber wood products such as tables, chairs, cabinets, wood pellets, plywood floors, etc. This is considered a direction to build a chain link between rubber exploitation and processing companies and product manufacturing companies to stabilize raw materials as well as respond to fluctuations in rubber raw material prices. In the long term, it will improve the value chain in the rubber industry. In the world, in order to remove difficulties for rubber companies, rubber producing countries have also increased the use of rubber materials in asphalt mixing to increase road durability, make road bricks or sports field flooring,
- Cost cutting trend of rubber industry companies:
+/ Direct labor costs account for about 50% of rubber companies' costs. By reducing the number of days spent tapping latex and intercropping, rubber companies can reduce costs and retain workers.
+/ Reduce the number of days for tapping latex: By reducing the number of days for tapping latex to D4 from D2 and D3, which means reducing the number of days for tapping latex to 4 days/time, the labor cost for tapping rubber can be reduced by about 50% compared to before, equivalent to a reduction of about 25% of the cost. According to the old law, rubber companies must ensure payment of labor costs.
Labor cost must be at least 65% of revenue, but now it has been adjusted to at least 50% of cost, ensuring minimum labor cost of about 5 million VND/ha. Expected latex yield is still guaranteed by using stimulants.
+/ Intercropping and combination: By intercropping with other forestry trees such as hybrid acacia and yellow cottonwood while still ensuring the growth of rubber trees, rubber companies can both generate other income and retain workers.
+/ Rubber trees with the characteristics of not fertilizing and weeding can still grow well and still give stable productivity, so one of the solutions proposed to help overcome the difficulties for rubber companies is to reduce fertilizing and weeding for rubber trees. Fertilizer costs account for about 5% of the cost, it is estimated that it can reduce about 50% - 80% of the fertilizer rate for rubber trees, equivalent to a reduction of about 3% - 4% of the cost.
+/ Reducing company management costs is also one of the solutions to help solve difficulties for rubber companies.
- Tax incentives In order to remove difficulties for Vietnamese rubber companies, the government has also issued policies related to corporate income tax incentives for the fields of agricultural cultivation and processing in general and rubber trees in particular. Accordingly, the corporate income tax rate for natural rubber cultivation and processing for the corporate income tax period from 2015 is applied as follows: Companies that cultivate, produce and process natural rubber, even if they are not located in areas with difficult or particularly difficult socio-economic conditions, are entitled to a 7% corporate income tax rate reduction. In 2014, the tax rate for companies in this category was 22%, and in 2015 it was reduced to 15%. Companies with income from processing agricultural products in areas with difficult socio-economic conditions in 2014 had a tax rate of 22%, but in 2015 were added to the list of beneficiaries with a tax rate of 10%, a reduction of 12%. In addition to the corporate income tax exemption policy that has been issued, the Vietnam Rubber Association is also proposing that the Ministry of Finance not declare and pay value added tax on raw natural rubber products in business and trade.
- Increased land rental costs: 2015 is the last year of the 5-year period of calculating land rental fees for rubber plantations. In 2016, land rental fees for rubber plantations may increase 3 times, causing difficulties for rubber plantation companies. According to Dong Phu Rubber Joint Stock Company, the company's average land rental fee per year in the previous 5 years was about 8 billion VND/year, starting from 2016 it may increase to 21 billion VND/year, an increase of about 2.6 times, equivalent to an increase of about 6.6% in cost price. This will make the company's efforts to reduce costs even more difficult. From July 1, 2014, according to the new regulation in Clause 2, Article 19 of Decree 46/2014/ND-CP, the basic construction period of replanted rubber plantations is not exempted from land rental fees. In the difficult context, the rubber industry has limited new planting, currently mainly replanting on rubber areas that have expired their exploitation cycle, about 20,000-30,000 ha/year, of which capital must be invested in restoration, replanting, and care for 6 to 8 years. During this time, the replanted rubber gardens have no products, so there is no revenue or profit, thus making it difficult to pay land rent for rubber plantations.
3.2.2 Analysis of Dong Phu Rubber Joint Stock Company
3.2.2.1. Financial report analysis of Dong Phu Rubber Joint Stock Company
a, Analysis of basic financial indicators
Based on the company's financial statements for the period 2009 - 2010, we have the following table of financial ratios: