INF | LNIG | LNIP | LNLCU | LNOILP | |
LNLCU(-2) | 0.850270 | - 0.007736** | - 0.043380** | 0.080897* | -0.058494 |
(0.71638) | (0.03818) | (0.03297) | (0.08980) | (0.12790) | |
[ 1.18690] | [-0.20262] | [-1.31584] | [ 0.90082] | [-0.45734] | |
LNLCU(-3) | 0.856257 | 0.031169** | 0.046239** | -0.037620* | -0.108641 |
(0.74623) | (0.03977) | (0.03434) | (0.09355) | (0.13323) | |
[ 1.14745] | [ 0.78369] | [ 1.34648] | [-0.40216] | [-0.81544] | |
LNLCU(-4) | -0.816334 | 0.061336** | 0.018598** | 0.748102* | 0.151993 |
(0.75957) | (0.04048) | (0.03495) | (0.09522) | (0.13561) | |
[-1.07473] | [ 1.51508] | [ 0.53205] | [ 7.85675] | [ 1.12078] | |
LNLCU(-5) | -0.175511 | - 0.024301** | - 0.037103** | -0.390238 | -0.274816 |
(0.88377) | (0.04710) | (0.04067) | (0.11079) | (0.15779) | |
[-0.19859] | [-0.51591] | [-0.91228] | [-3.52241] | [-1.74169] | |
LNOILP(-1) | 0.871169 | 0.006624** | 0.032311** | -0.007545* | -0.018737 |
(0.66156) | (0.03526) | (0.03044) | (0.08293) | (0.11811) | |
[ 1.31685] | [ 0.18787] | [ 1.06131] | [-0.09097] | [-0.15863] | |
LNOILP(-2) | -0.238900 | - 0.003685** | 0.001741** | 0.009186* | -0.012095 |
(0.64730) | (0.03450) | (0.02979) | (0.08114) | (0.11557) | |
[-0.36907] | [-0.10680] | [ 0.05846] | [ 0.11321] | [-0.10466] |
Maybe you are interested!
-
 GDP and GDP Growth Rate of Hanoi as of December 31, 2006, by Economic Sector - Calculated at 1994 Prices
 -
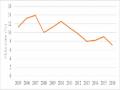 Economic Growth Rate of Thua Thien Hue Province in the Period 2005 - 2016
 -
 The Role of the State in Economic Growth
 -
 The Integration Process Creates a New, More Dynamic Economic Environment Serving the Growth Process and Gradually Shifting the Economic Structure
 -
 Economic Growth and Social Equity in Vietnam from 1986 to Present
INF | LNIG | LNIP | LNLCU | LNOILP | |
LNOILP(-3) | -0.122616 | - 0.015622** | - 0.026068** | 0.103053* | 0.542170 |
(0.51869) | (0.02764) | (0.02387) | (0.06502) | (0.09261) | |
[-0.23640] | [-0.56508] | [-1.09211] | [ 1.58490] | [ 5.85458] | |
LNOILP(-4) | -0.716621 | - 0.004129** | - 0.031782** | -0.187954* | -0.252061 |
(0.62754) | (0.03345) | (0.02888) | (0.07867) | (0.11204) | |
[-1.14195] | [-0.12346] | [-1.10050] | [-2.38922] | [-2.24972] | |
LNOILP(-5) | 0.380916 | 0.014801** | 0.023451** | 0.036328* | 0.043433 |
(0.60662) | (0.03233) | (0.02792) | (0.07604) | (0.10831) | |
[ 0.62793] | [ 0.45778] | [ 0.84003] | [ 0.47772] | [ 0.40103] | |
C | -11.43101 | 0.820648 | 0.430483 | 1.188261 | -1.555064 |
(7.93038) | (0.42267) | (0.36495) | (0.99413) | (1.41588) | |
[-1.44142] | [ 1.94158] | [ 1.17956] | [ 1.19527] | [-1.09830] | |
R-squared | 0.790203 | 0.978236 | 0.992032 | 0.884606 | 0.699732 |
Adj. R-squared | 0.718355 | 0.970783 | 0.989304 | 0.845088 | 0.596900 |
Note: (*): significant at 10%; (**): significant at 5%; (***): significant at 1% The estimation results show that the variables in model (2) explain
71.83% of inflation volatility in Vietnam.
3.4.2. G nger definition
The Granger causality test method was used in this study, giving results as shown in Table 3.10:
Table 3.12: Granger test of variables in figure 2
Variable
INF | LNIG | LNIP | LNLCU | LNOILP | |
(1) | (2) | (3) | (4) | (5) | (6) |
INF | 3,7518 | 3,2130 | 12,7016** | 17,9417** | |
(0.5857) | (0.6672) | (0.0263) | (0.003) | ||
LNIG | 2,1783 | 1.8441 | 7,8247 | 11,3350** | |
(0.824) | (0.8703) | (0.1662) | (0.0451) | ||
LNIP | 3,6350 | 17,3011** | 12,3221** | 9,3354* | |
(0.6031) | (0.004) | (0.0306) | (0.0964) | ||
LNLCU | 7,9509 | 5,6143 | 6,5191 | 5,0063 | |
(0.159) | (0.3456) | (0.2589) | (0.4151) | ||
LNOILP | 2,3319 | 0.5676 | 3,4253 | 14,9156** | |
(0.8016) | (0.9894) | (0.6347) | (0.0107) |
Note: (*): significant at 10%; (**): significant at 5%; (***): significant at 1%
From the Granger test results, it can be seen that in model (2) there are the following relationships:
- Private investment (LNIP) has a causal relationship with Public investment (LNIG) at a significance level of 5% (column 3) ;
- Inflation (INF), Private Investment (LNIP) and International Oil Price (LNOILP) are causally related to money supply expansion (LNLCU) at 5% significance level ( Column 5) ;
- Inflation (INF), public investment (LNIG), private investment (LNIP) have a causal relationship with money supply expansion (LNLCU) at the 5% significance level ( Column 6) .
Thus, here we cannot see the causal relationship between public investment variable (LNIG) and inflation (INF).
3.4.3. Impulse response function
Similar to the Granger causality test analysis in model (1), the Granger causality test has shown us the causal relationship between the variables in the model. Using the impulse response function (IRF) analysis tool, we continue to evaluate the response of the inflation variable (INF) under the impact of the input variables.
public investment (LNIG), Private investment (LNIP) and international oil price (LNOILP) and Expansionary money supply (LNLCU) for 20 consecutive periods (i.e. 20 quarters, or 5 years).
The results shown in Figure 3.3 show that public investment does not have an immediate impact on growth from the first period like the other factors.
Figure 3. 3: Impulse response of INF generator to shocks of variables LNIG, LNIP, LNLCU, LNOILP
Response to Cholesky One SD (df adjusted) Innovations ± 2 SE
Response of LNIG to INF Response of LNIP to INF
.04 .04
.00 .00
-.04
-.04
-.08
2 4 6 8 10 12 14 16 18 20
-.08
2 4 6 8 10 12 14 16 18 20
Response of LNLCU to INF Response of LNOILP to INF
.10
.2
.05
.00
.1
-.05
-.10
.0
-.15
-.20
2 4 6 8 10 12 14 16 18 20
-.1
2 4 6 8 10 12 14 16 18 20
- When there is a shock to LNIG public investment, inflation (INF) gradually decreases in the first 3 quarters, then increases to a peak in the 5th quarter and then adjusts to the equilibrium level and tends to decrease gradually.
- When there is a shock to the LNLCU expansionary money supply, inflation (INF) reacts immediately in the first quarter and adjusts its fluctuations up and down in each small cycle (every 2 quarters), but in general, INF adjusts in an upward trend.
- When there is a shock to private investment LNIG, inflation (INF) reacts downward in the first two quarters and adjusts slightly downward to the equilibrium level until the end of the cycle.
- When there is a shock to the international oil price LNOILP, inflation (INF) reacts by increasing and decreasing sharply in the first 8 quarters and tends to gradually adjust down to the equilibrium level until the end of the cycle.
3.4.4. Analysis of the influence of the
Table 3.13: Variance decomposition results of Figure 2
Cycle
SE | INF | LNIG | LNIP | LNLCU | LNOILP | |
1 | 2.63 | 100.00 | 0.00 | 0.00 | 0.00 | 0.00 |
2 | 3.76 | 97.72 | 0.07 | 0.78 | 0.43 | 1.00 |
3 | 4.40 | 94.02 | 0.92 | 1.27 | 2.82 | 0.98 |
4 | 4.76 | 86.27 | 2.73 | 1.08 | 9.05 | 0.87 |
5 | 4.98 | 80.67 | 2.53 | 2.50 | 13.50 | 0.79 |
6 | 5.14 | 75.89 | 2.38 | 4.85 | 16.08 | 0.80 |
7 | 5.25 | 73.04 | 2.36 | 6.25 | 17.53 | 0.81 |
8 | 5.33 | 70.76 | 2.31 | 6.74 | 19.36 | 0.83 |
9 | 5.42 | 68.80 | 3.03 | 7.12 | 20.20 | 0.84 |
10 | 5.47 | 67.67 | 3.59 | 7.27 | 20.63 | 0.85 |
11 | 5.50 | 66.96 | 4.00 | 7.45 | 20.69 | 0.90 |
12 | 5.52 | 66.39 | 4.14 | 7.55 | 20.96 | 0.95 |
13 | 5.56 | 65.51 | 4.73 | 7.72 | 21.05 | 0.98 |
14 | 5.58 | 65.04 | 5.00 | 7.81 | 21.16 | 1.00 |
15 | 5.60 | 64.76 | 5.22 | 7.87 | 21.14 | 1.00 |
16 | 5.61 | 64.54 | 5.28 | 7.93 | 21.23 | 1.03 |
17 | 5.63 | 64.07 | 5.60 | 8.07 | 21.22 | 1.05 |
18 | 5.64 | 63.90 | 5.73 | 8.12 | 21.20 | 1.05 |
19 | 5.64 | 63.81 | 5.83 | 8.15 | 21.16 | 1.05 |
20 | 5.65 | 63.76 | 5.84 | 8.18 | 21.15 | 1.06 |
The variance decomposition results in Table 3.11 show that the impact level and impact time of the factors LNIG, LNIP, LNLCU, LNOILP on the INF inflation rate are different.
- The above variables do not have an immediate impact on INF in the first quarter, but only have an impact from the second quarter onwards. The variables LNIG, LNIP, LNOILP have a gradual impact on INF. However, only the expansionary money supply variable LNLCU has a strong impact on INF from the fourth quarter onwards.
- The impact effect of international oil price LNOILP on INF is the lowest. The impact effect of public investment LNIG on INF inflation is lower than the effects of the remaining factors LNIP, LNLCU.
- Up to the 20th quarter (ie after 5 years), the money supply LNLCU has the strongest influence on INF, LNLCU in the past 5 years before can explain about 21.15% of the fluctuation of current INF; but LNIG can only explain up to 5.84% of the fluctuation of INF; the explanatory power of LNIP and LNOILP is 8.18% and 1.06% respectively.
CHAPTER 3 SUMMARY
In this chapter, through the VAR regression method, with time series data from 1995-2019, the study has conducted Ganger tests, Impulse Response Function and Differential Decay Analysis to reveal the impact of public investment on economic growth, the impact of public investment on inflation in Vietnam:
The thesis found: Public investment does not immediately affect economic growth and inflation, but has a lag of 1 year. That is, public investment needs a time lag to affect economic growth and inflation.
CHAPTER 4:
PUBLIC INVESTMENT SOLUTIONS TO PROMOTE ECONOMIC GROWTH AND CONTROL INFLATION
4.1. Economic development orientation on public investment, economic growth and inflation in Vietnam until 2025 and orientation to 2030
4.1.1. Guidelines on public investment
Continue to thoroughly innovate the way of managing public investment to overcome the situation of scattered and scattered capital allocation and improve investment efficiency. Mobilizing foreign capital is necessary, attracting private investment is the driving force for development, but promoting domestic capital is decisive, ensuring the main mission and leading the economy in the right direction and enhancing national competitiveness. At the same time, it is necessary to focus public investment resources on the goal of promoting the process of growth model innovation, implementing important, inter-regional and spillover infrastructure investment projects and in key economic zones as a foundation before being able to attract capital from the domestic private sector and FDI capital. Public investment needs to focus more on human development investment projects, improving the qualifications of workers. Specifically, in the total development investment from the state budget, investment in infrastructure development accounts for 80-90% of the total development investment expenditure from the state budget. To continue improving the efficiency of public investment, it is necessary to immediately overcome current limitations in public investment activities such as scattered investment and public investment capital still concentrated in industries.
The Government has just issued Resolution No. 63/NQ-CP requesting ministries, central and local agencies to strengthen discipline and order in disbursing public investment capital, promote the role and responsibility of leaders; review the allocation of capital plans for projects in accordance with the implementation progress, ensuring focus and key points, not spreading out, fragmenting, or prolonging. In particular, focusing on:
(i) Speed up site clearance progress, promptly remove difficulties and obstacles related to land and resources;