2.4.3. Monitoring indicators and monitoring methods
2.4.3.1 Survival rate (%)
During the experiment, the number of dead chickens in each experimental batch was accurately recorded daily. At the end of each week, the total number of dead chickens in each experimental batch was monitored and counted to determine the number of surviving chickens.
Calculate survival rate by week of age, by stage and by stage.
Survival rate =The price is very cheap , but the price is cheap .× 100
𝑠𝑐𝑜𝑛𝑛 cell 𝑖 first row 𝑢𝑘
2.4.3.2. Increase mass
- Live weight by week of age
Body weight of chickens during rearing stages (determined by week of age). Weigh weekly from 1 week of age until the end of the experiment. Weigh chickens in the morning before feeding, weigh at a fixed hour and day of the week, weigh each chicken individually.
Use a high-precision electronic scale to weigh the experimental chickens.
- Increase absolute mass
Body mass increase per unit time between two surveys. Absolute mass increase is calculated by the formula:
𝑃2−𝑃1
A(g/head/day) =
𝑇
In which: A is absolute weight gain (gram/head/day) P1 is body weight at time T1 (g) P2 is body weight at time T2 (g)
T is the time interval between two surveys (days of age)
-Increase relative mass:
Is the relative increase in chicken weight from the next weighing to the previous weighing.
Determine relative growth by week and by stage.
Formula for calculating relative mass gain:
× 100
R (%)=𝑃2−𝑃1
(𝑃1+𝑃2)/2
In which: R is relative mass increase (%)
P1 is the body mass at the previous weighing (g) P2 is the body mass at the next weighing (g)
2.4.3.3. Food intake (FI)
Experimental chickens were fed ad libitum.
Determine the amount of food for chickens: Every day, feed the chickens at a certain time, weigh the exact amount of food and pour it into the chicken feeder.
The next day, clean out all the remaining food in the trough and weigh it to calculate the amount of leftover food.
FI(g/head/day) =𝐿𝑇 Ă 𝑐ℎ𝑜 ă 𝑛 ( 𝑔 ) − 𝐿𝑇 Ă 𝑡ℎ from 𝑎(𝑔)
What is the first question ?
2.4.3.4. Feed conversion ratio (FCR)
In broiler farming, feed efficiency is the feed consumption for 1kg of body weight gain (FCR). The formula for calculating feed efficiency is as follows:
FCR =
𝐿𝐨𝐮𝐫 𝐭𝐡𝐨 ...
I 'm a big fan of Korean drama ( LOL )
- Calculate ME kcal consumption/kg weight gain.
- Consumes grams of crude Pr/kg of mass gain.
- ME consumption/kg(Kcal)= FCR x energy value of food.
- CP consumption/kg(g)= FCR x Protein ratio of food.
- Calculate feed cost for 1 kg of weight gain: Feed cost = FCR (kg) x feed price (VND)
2.4.3.5. Production Index (PI)
Production index is a quantity representing the overall relationship between absolute growth, survival rate and FCR calculated by the formula:
PI=
A (g/head/day) x Survival rate (%) FCR x 10
Note: Absolute weight gain (A), Feed Conversion Ratio (FCR) and survival rate are all cumulative values up to the time of calculation. Higher PI indicates greater productivity.
2.4.3.6. Economic indicators (EN)
Production Index (PI)
EN = x 1000
Feed cost/kg weight gain (VND)
The higher EN represents greater economic efficiency.
2.4.3.7. Meat productivity and quality
Meat yield assessment
Conducted autopsy on experimental Cobb 500 chickens at 42 days of age with all experimental batches according to the method of Bui Huu Doan (2011).
Conducted autopsy on experimental Ri hybrid chickens at 84 days old with all experimental batches according to the method of Bui Huu Doan (2011).
Select each experimental batch of 3 males and 3 females with a mass equivalent to the average mass of the batch.
Live weight : Weigh live weight (after fasting for 12-18 hours but drinking water normally).
Carcass weight and proportion
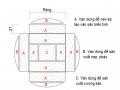
How to determine carcass weight: After cutting the blood, plucking the feathers, cut the belly along the rib cage to remove the intestines, lungs, trachea, spleen, separate the bile from the liver, remove the food and horn membrane from the gizzard, put the gizzard and liver into the belly. Cut off the head.
At the occipital bone and the first cervical vertebra, cut the leg at the elbow and weigh it to get the carcass weight.
Carcass weight (g)Carcass percentage (%) = | x 100 |
Live weight (g) | |
Maybe you are interested!
-
 Test Results of Optimal Mode Effect on Mechanical Properties
 -
 P. Results of Treatment of Organic Substances in Leachate by Perozone with the Effect of Ph in 60 Minute Reaction Time
 -
 Experiment 1: Study on the Effect of Potassium and Sulfur Fertilizer Dosage on Coffee and Tea Plants in the Business Stage on Red-Brown Basalt Soil in Lam Dong Province
 -
 Representing the Regression Results Based on Enterprise Size Using Three Methods. The Purpose of This Regression Is to Analyze the Effect of Enterprise Size on the Impact
 -
 Statistical Analysis Results of Spring Rice Quality Varieties Experiment
Thigh muscle mass and ratio
How to determine thigh muscle mass: Make an incision from the left hip joint parallel to the spine leading to where the thigh bone attaches to the trunk. Peel the thigh and abdominal skin along the incision between the thigh muscle and the chest muscle to make an incision to separate them, remove all skin. Cut along the tibia and fibula to remove this bone along with the patella and cartilage. Weigh the left thigh muscle mass and multiply by two to get the thigh muscle mass.
Thigh muscle mass (g)Thigh muscle ratio (%) = | x 100 |
Carcass weight (g) | |
Chest muscle mass and ratio
How to determine chest muscle mass: Make an incision along the sternum to take the left breast, continue cutting from the collarbone to the shoulder bone, remove the skin from the chest muscle to the shoulder bone to take the chest muscle off the bone. Weigh the left chest muscle mass and multiply by two to get the chest muscle mass.
Chest muscle mass (g)Pectoral muscle ratio (%) = | x 100 |
Carcass weight (g) | |
Ratio of chest muscle + thigh muscle (%)
= | Chest muscle mass + thigh muscle mass (g) | x 100 |
Carcass weight (g) |
Belly fat ratio
Abdominal fat mass (g) | x 100 |
Carcass weight (g) |
Meat quality: After surveying, taking samples to analyze some indicators of pH, breast muscle, thigh, dehydration rate, brightness and toughness of meat.
Determination of pectoral muscle pH: Directly insert the electrode of the digital pH meter (Mettler ToledoMP220 pH Meter) into the left pectoral muscle to determine the pH value of 15 at 15 minutes after slaughter and pH 24 at 24 hours of storage at 2-4 o C in the right pectoral muscle.
Determination of water loss rate after 24 hours of storage: After measuring pH 15 , filter the left pectoral muscle, weigh the mass (mass before storage) and store in a sealed plastic bag at 2-4 o C for 24 hours. Then, the left pectoral muscle sample is drained with absorbent paper and reweighed (mass after storage).
Determine the rate of water loss during storage and processing (steaming) according to the difference in sample mass before storage and after measurements. The rate of water loss is the sum of the difference in sample mass before storage and after processing (or the sum of the rate of water loss during storage and processing).
Meat color measurement: (L: light color; a: red color; b: yellow color) was performed at 24 hours of post-mortem storage in the right breast muscle using a meat color meter (Nippon Denshoker Handy Colorimeter NR-3000, Japan).
Determination of meat toughness: Meat samples after being determined for processing dehydration rate are stored at 4 o C for 24 hours, then on each meat sample, use a sampling tool (diameter 1cm) to take 5 duplicate samples in the same direction as the muscle fibers and put them into the shear force determination machine (Warner -Bratzler 2000D, USA). The toughness of each meat sample is determined as the average of 5 repeated measurements. Unit of measurement is in kg.
Analysis of pH, dehydration rate, brightness and toughness of meat at the laboratory of the Faculty of Animal Husbandry - Vietnam Academy of Agriculture.
2.4.4. Data processing method
Data were processed on Microsof Excel software with the following statistical parameters, and SAS 9.1 software.
X is the average number
m X: error of the mean
S X: standard deviation n: sample size Cv: is the coefficient of variation
Chapter 3
RESULTS AND DISCUSSION
3.1. Experiment 1 results: Effect of Algimun on meat production ability of Cobb 500 broiler chickens raised in open cages
3.1.1. Temperature monitoring results during experiment 1
The results of monitoring the temperature of the barn during the experiment are presented in Table 3.1.
Table 3.1. Temperature monitoring results during experiment 1 ( o C)
Lot.Age
Lot TN 1 | Lot DC 1 | |||
Environment | Cage | Environment | Cage | |
1 | 24.67 | 33.67 | 24.67 | 33.54 |
2 | 24.60 | 30.60 | 24.60 | 30.45 |
3 | 25.56 | 28.67 | 25.56 | 28.58 |
4 | 26.97 | 27.80 | 26.97 | 27.71 |
5 | 19.04 | 20.39 | 19.04 | 20.19 |
6 | 19.46 | 20.44 | 19.46 | 20.24 |
The results of monitoring the environmental temperature during the experiment showed that: The environmental temperature was very good, almost no need to adjust the temperature in the barn, although the chickens were raised in an open-house method. The results of monitoring the temperature also showed that: The environmental temperature during the experiment was suitable for the physiology of broilers, so all the indicators monitored during the experiment were not affected by the environmental temperature.
3.1.2. Effect of Algimun on survival rate of experimental chicken flock 1
Survival rate is an important indicator in poultry farming in general and broiler chicken farming in particular. Survival rate reflects the vitality, disease resistance of poultry and the quality of parent flocks. Survival rate is affected by external factors and the quality of the breed. In broiler chicken farming, to achieve high economic efficiency, all economic indicators are required.
Technical efficiency must be improved, one of the first important indicators is the survival rate. The results of monitoring the effect of Algimun on the survival rate of experimental chickens 1 are presented in Table 3.2.
Table 3.2. Cumulative survival rate of experimental chickens 1
Week
year old
Lot TN 1 | Lot DC 1 | P | |||||
X | m X | Cv % | X | m X | Cv % | ||
1 | 99.56a | 1.62 | 2.30 | 99.11a | 0.91 | 1.3 | 0.13 |
2 | 98.67a | 3.56 | 5.10 | 97.78a | 5.60 | 8.1 | 0.23 |
3 | 98.67a | 2.93 | 4.20 | 97.78a | 3.66 | 5.3 | 0.23 |
4 | 98.67a | 1.95 | 2.80 | 97.78a | 3.32 | 4.8 | 0.23 |
5 | 98.67a | 2.13 | 3.05 | 97.78a | 3.49 | 5.05 | 0.23 |
6 | 98.67a | 2.43 | 3.49 | 97.78a | 2.15 | 3.11 | 0.23 |
The results obtained showed:
The survival rate of experimental Cobb500 chickens was from 98.67% (test group) - 97.78% (control group), the experimental group was higher than the control group, however this difference was not significant, not statistically significant (P>0.05). Thus, when supplementing Algimun in the diet of experimental chickens, it did not affect the survival rate of Cobb500 chickens raised in naturally ventilated conditions.
When compared with the research results of Tran Thanh Van et al., (2019) on the survival rate of Cobb 500 chickens raised in open cages supplemented with acid pak 4 way reaching 95.43 - 99.1%, our research results are equivalent.
3.1.3. Effect of Algimun on growth of experimental chicken 1
3.1.3.1. Cumulative growth of experimental chickens 1
The body weight of broiler chickens is a very important technical and economic indicator and is of great interest to breeders. Because through this indicator, the growth and meat production ability of chickens can be evaluated, and it also reflects the impact of feed and care process on the growth of chickens. The weight of experimental chickens 1 is presented in Table 3.3.