This shows the disadvantages of the process when there is excess iron. High concentrations of Fe 2+ or Fe 3+ lead to the formation of iron precipitates at higher pH values (pH > 2.5) and reduce the current efficiency.
Besides, in 2006, Deng and colleagues reported that increasing Fe 2+ ion concentration also decreased • OH concentration and increased the conductivity of wastewater [61]. The introduction of large catalyst concentrations may be ineffective because large amounts of iron oxide sludge are produced.
From the results and evaluation with previous publications, the thesis chose to use [Fe 2+ ] = 0.1mM to study the next EF process.
3.1.5. Effect of electrolyte concentration Na 2 SO 4 on the ability to treat glyphosateElectrolyte Na 2 SO 4 affects the efficiency of treatment by the EF process. In the study of Ruiz and colleagues in 2013, it was confirmed that the concentration of electrolyte affects the treatment efficiency by the EF process when studying the effect of concentration.
electrolyte concentration on the electrochemical properties of AB5 for Ni/MH [150].
Maybe you are interested!
-
 Effect of 25% Concentration of White Eucalyptus Bark and Leaf Extract on Fungi
 -
 Evaluation of the effectiveness of the Forest Environmental Services Payment Policy on forest management and protection, improving people's lives in the Cua Dat Hydropower Plant Basin in Thanh Hoa province, period from 2012-2016 - 13
 -
 B. Effect of Srt on Glyphosate Treatment Capacity by Mbr Process
 -
 Effect of Foliar Fertilization on Plant Height of Selected Orchid Varieties in the Nursery Stage
 -
 Survey Results of the Effect of Agent Concentration on Reaction Yield at 5 G/Batch Scale
To study the effect of electrolyte concentration, experimental conditions were: [glyphosate] = 0.1mM; initial catalyst concentration [Fe 2+ ] = 0.1mM; pH = 3; current density 8,333 mA/cm 2 ; d = 1 cm. The electrolyte concentration Na 2 SO 4 is at: 0.025M; 0.05M; 0.075M; 0.1M.
Figure 3.8 shows the following results: when increasing the Na 2 SO 4 concentration from 0.025M to 0.05M , the glyphosate decomposition efficiency increases from 53.03% to 80.94%. This is explained when the concentration of Na 2 SO 4 increases, leading to an increase in conductivity, then the movement speed of ions in the solution increases, the ions go towards the electrode faster, thereby creating products. quickly, while promoting the ability to decompose glyphosate.
In 2007, Zhou announced that the ability to treat methyl red increased from 56.8% to nearly 80% when Na 2 SO 4 concentration increased. Low electrolyte concentrations may not provide sufficient conductivity for the EF process. In this report, it is concluded that high current density when electrolyte solutions have high Na 2 SO 4 concentration, corresponding to an increased H 2 O 2 production rate , contributes to the generation of more • OH radicals, thereby improve process efficiency and reduce energy consumption [121].
In addition, the results in Figure 3.8 show that when the concentration is increased from 0.05 M to 0.1 M, the glyphosate decomposition efficiency decreases from 80.94%; 72.93%; 69.06% respectively Na 2 SO 4 at concentration 0.05M; 0.075M; 0.1M
0.025 M
0.05 M
0.075 M
0.1 M
100
80
TOC treatment efficiency (%)
60
40
20
0
0 10 20 30 40 50 60
Time (minutes)
Figure 3.8 . Effect of electrolyte concentration Na 2 SO 4 on the ability to process glyphosate. This explains that when Na 2 SO 4 concentration increases above 0.05M, it can lead to radicals.
• OH participates in reacting with Na 2 SO 4 by reaction equations 3.12 and 3.13 [121] thereby reducing the radical • OH participates in reaction 1.1 and affects the process efficiency.
• OH+ SO 4 2- → OH - + SO 4 •- (3.12)
SO 4 •- + e - → SO 4 2- (3.13)
This result compares to claims made when using an electrolyte concentration of 0.05M Na 2 SO 4
specifically:
In the study of Ghoneim et al., the effectiveness of using electrolyte
KCl, NaCl and Na 2 SO 4 at the same concentration of 0.05M were compared and showed the maximum color loss rate of sunset yellow FCF [58]. The color removal efficiency reached 100% in 120 minutes for 0.05M Na 2 SO 4 and 180 minutes for NaCl and KCl respectively.
In 2014, El - Ghenymy's group studied the treatment process of 230 mL of 0.006M sulanilamide; pH = 3, I = 300 mA, [Na 2 SO 4 ] = 0.05M by EF process with Pt electrode/C fabric. After 360 min of treatment by EF process the solution was completely cured [151 ].
From the above research results, the thesis chooses the concentration [Na 2 SO 4 ] = 0.05M as the basis for studying glyphosate treatment in the EF process.
3.1.6. Effect of initial glyphosate concentration on the processability of the electrochemical Fenton process
To study the effect of initial glyphosate concentration on the processing capacity of the EF process, conditions were performed at pH = 3, [Fe 2+ ] = 0.1 mM, current density: 8,333 mA/ cm 2 , d = 1 cm, glyphosate concentration: 0.05mM; 0.1mM; 0.2mM; 0.4mM. Perform the experiment for 60 minutes continuously and determine TOC values at times 0, 10, 20, 30 minutes. From there, determine suitable conditions to perform the EF process.
0.05 mM
0.1 mM
0.2 mM
0.4 mM
100
80
TOC treatment efficiency (%)
60
40
20
0
0 5 10 15 20 25 30
Time (minutes)
Figure 3.9 . Effect of initial glyphosate concentration on EF process
The dependence of TOC concentration on electrolysis time and glyphosate concentration is shown in Figure 3.9.
Figure 3.9 shows that the greater the initial concentration of glyphosate, the greater the treatment efficiency. This is explained: according to the law of mass action, the speed of the glyphosate decomposition reaction by radical ( • OH) is proportional to the concentration of the participating substances, so the greater the initial concentration of glyphosate , while the amount of radical ( • OH) changes little, the decomposition rate of glyphosate is fast, which helps the ability to mineralize glyphosate increase when increasing the initial concentration of the reactant (glyphosate).
On the other hand, Figure 3.10 shows that the pollutant removal rate increased with increasing initial concentration of glyphosate, but the increase rate of efficiency was not linear with glyphosate concentration. At this time, as the initial glyphosate concentration increases, the mineralization efficiency gradually decreases. In Figure 3.10, it can be seen that after 20 minutes of electrolysis, the efficiency is 32.6% at a concentration of 0.05mM; 54.97% at 0.1mM concentration; 69.06% at 0.2mM concentration and 79.63% at 0.4mM. This result is explained as follows: during the process of decomposition of glyphosate in solution, it is incomplete and produces by-products. These products continue to react with free hydroxyl radicals ( • OH) and compete between free hydroxyl radicals ( • OH) and glyphosate, so although the mineralization efficiency still increases when increasing the initial glyphosate concentration, beginning, but the rate of increase gradually slows down.
100
TOC treatment efficiency (%)
80
60
40
4 6 8 10 12 14
Glyphosate concentration (mgC/L)
Figure 3.10. TOC removal efficiency after 20 minutes when treating glyphosate with the EF process. In 2009, Rosales' group researched the treatment of dyes with high concentrations of
high initial rate leads to the production of intermediate reaction products, reducing the amount of free hydroxyl radicals ( • OH) to decompose pollutants, thereby reducing the efficiency of the EF process [152].
In Jasmann's 2016 research report, it was found that although treatment efficiency increases non-linearly with increasing initial pollutant concentration, the volume of pollutants removed is still high when increasing initial pollutant concentration. [153].
The trend of the influence of the initial concentration of glyphosate also helps explain the variation in performance over time: during the initial period of the electrolysis process, the TOC of the solution decreases very quickly, but as the time increases, the ability to TOC mineralization capacity decreases slowly.
Through the above research, it is proven that the EF process will take place quickly when the initial concentration of organic pollutants is high, so EF will be suitable if applied in pretreatment of pollutants.
3.1.7. Study of the kinetics and by-products of glyphosate degradation
3.1.7.1. Study of the kinetics of glyphosate degradation process
Based on the suitable conditions for the EF process, conduct electrolysis experiments of glyphosate solution under these conditions to evaluate the efficiency of oxidation and kinetics of glyphosate decomposition, specifically as follows: glyphosate concentration 0.1mM, [Fe 2+ ] = 0.1mM, [Na 2 SO 4 ] = 0.05M, current density 8.333 mA/cm 2 , pH = 3, d = 1 cm. Samples were taken at: 5 minutes, 10 minutes, 15 minutes, 20 minutes, 30 minutes, 40 minutes to analyze TOC and residual concentration of glyphosate.
The results in Figure 3.11 show that glyphosate concentration and TOC value always decrease over electrolysis time. However, the remaining glyphosate decreased faster than the remaining TOC concentration. After 40 minutes of electrolysis, 91.87% of glyphosate was removed and the corresponding TOC removal efficiency was 79.83%, lower than the glyphosate removal efficiency. This result proves that byproducts are produced.
By estimating the byproduct concentration obtained from glyphosate decomposition through the TOC concentration value, the product concentration increased in the first 15 minutes and then remained almost constant during the electrolysis process. A possible explanation is that some intermediates are relatively stable and slow down the decomposition of glyphosate, such as carboxylic acids which are known to have relatively low reaction rate constants with radical ( • OH) . In addition, the existence of some complexes of Fe 3+ with certain carboxylic acids that may not be oxidized by radical ( • OH) in solution also slows down the decomposition of glyphosate.
Kinetics of glyphosate decomposition under appropriate conditions: d = 1 cm; [Fe 2+ ] = 0.1mM, [Na 2 SO 4 ] = 0.05M; pH = 3, current density is 8.333 mA/cm 2 . Because the rate constant for the reaction of hydroxyl radical with organic compounds is very large (from
10 7 – 10 10 L/mol.s) while its lifetime is very short (10 -9 s). Therefore, considering that the ( • OH) concentration is stable throughout the EF process, the kinetics of the glyphosate degradation reaction is considered to be pseudo-first order.
TOC
Glyphosate
Intermediate products
4
3
Concentration (mgC/L)
2
1
0
0 10 20 30 40
Time (minutes)
Figure 3.11 . Concentrations of glyphosate, intermediate products, and TOC over treatment time by the EF process
The expression for the rate of decomposition of glyphosate with hydroxyl radical is written as the equation: Glyphosate + • OH → product
𝑑[𝑔𝑙𝑦𝑝ℎ𝑜𝑠𝑎𝑡𝑒] = k abs .[ • OH].[glyphosate] = k app [glyphosate]
𝑑𝑡
Where k app = k abs .[ • OH] and k abs is the absolute rate constant of glyphosate decomposition by hydroxyl radical [ • OH].
K app is the apparent rate constant for the decomposition of glyphosate by hydroxyl radical.
We have the integral expression:
𝑑 [𝐺𝑙𝑦𝑝ℎ𝑜𝑠𝑎𝑡𝑒] = k app .dt
[𝐺𝑙𝑦𝑝ℎ𝑜𝑠𝑎𝑡𝑒]
Integrating both sides of the expression we have:
=
0
𝐶 𝑑[𝐺𝑙𝑦𝑝ℎ𝑜𝑠𝑎𝑡𝑒] 0
∫ 𝑘
. dt
𝐶 [𝐺𝑙𝑦𝑝ℎ𝑜𝑠𝑎𝑡𝑒]
∫ 𝑡
𝑎𝑝𝑝
Expanding the integral on both sides we get: Ln( 𝐶 0 ) = k app .t
𝐶
So according to theory, Ln( 𝐶 0 ) is linearly proportional to t.
𝐶
Time (minutes)
Time (minutes)
Glyphosate concentration (mg/L)
Figure 3.12 . Kinetics of the decomposition of glyphosate solution
Figure 3.12 shows experimental results of glyphosate concentration values over time. The results showed that the remaining amount of glyphosate decreased exponentially over time . Also in Figure 3.12, the graph between Ln (C 0 /C t ) and time has a straight line (with R 2 =0.996); proving that the kinetics of the glyphosate decomposition reaction by radical ( • OH) is pseudo-first order. In a pseudo-first-order reaction, the rate constant of the reaction according to the graph is 0.063 (min -1 ). Some substances have reaction rate constants after being treated with a specific EF process: DO61 dye is 0.301 (min -1 ) [125], malachite green is 0.39 (min -1 ), crystalline purple (0.36 min -1 ), methyl blue is (0.15 min -1 ).
3.1.7.2. Product of glyphosate decomposition after treatment with the EF process
In this thesis, the author does not delve into the mechanism of glyphosate decomposition using the EF process, but rather inherits previous publications to identify a number of by-products (easily biodegradable) that can form. in the pretreatment of glyphosate with EF as a basis for studying the downstream MBR process.
Indeed, according to some previous studies, AOPs technology can decompose glyphosate in two ways: forming AMPA and glycolic acid (C–bond cleavage).
N) or sarcosine and PO 4 3- (cleaves the C–P bond) (Figure 3.13). According to Yang et al
[154] photocatalytic degradation of glyphosate follows the sarcosine pathway,
Subsequent byproducts are glycine, formaldehyde, and formic acid. According to Balci et al
[155] the pseudo-EF process uses Mn 2+ catalyst to decompose glyphosate to form intermediate products AMPA and glycolic acid, which are then further decomposed to produce carboxylic acids. According to Lan and colleagues [129], the electrochemical oxidation process decomposes glyphosate through the sarcosine pathway, forming by-products glycine, glycolic acid, and oxamic acid. According to Barrett and colleagues [156], oxidation with MnO 2 will decompose glyphosate sarcosine, the main byproducts are glycine and formic acid.
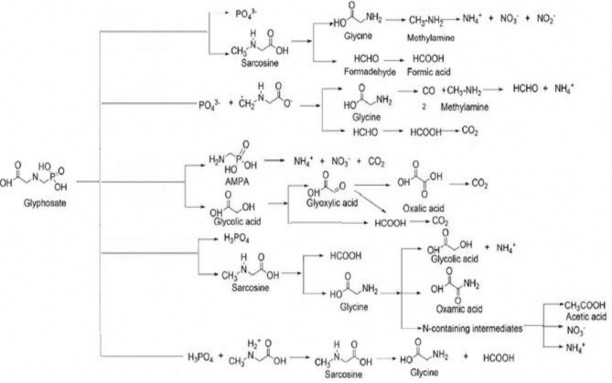
Figure 3.13 . Glyphosate degradation pathways by several AOP processes [129,154]
It can be seen that the majority of AOP processes degrade glyphosate via the sarcosine pathway, producing mainly glycine as a byproduct. In the thesis, to determine the products produced during glyphosate treatment with EF, electrolysis of glyphosate solution with initial concentration of 16.9 mg/L, [Fe 2+ ]= 0.1mM, [Fe 2+ ]= 0.1mM, [ Na 2 SO 4 ] = 0.05M, current density is 8.333 mA/cm 2 , pH = 3, electrolysis time is 60 minutes, d = 1.0 cm. Conducting pre-electrolysis sampling before and after 60 minutes of electrolysis, the sample was measured using a dual LCMS/MS liquid chromatography mass spectrometry system to determine glyphosate and secondary products of glyphosate.