PART 3
OBJECTS, CONTENT AND METHODS OF RESEARCH
3.1. Research object and scope
Research object: Chukara tabularis
Scope of research: Research topic on the effects of shading regimes with rates of 75%, 50%, 25% and no shading on the growth of Lat hoa trees at the nursery stage.
3.2. Research content
+ Effect of shading level on plant survival rate (%)
- Effect of shading level on plant height growth (Hvn)
- Effect of shading level on root diameter growth (Doo)
- Effect of shading level on the number of leaves of the tree
- Estimated rate of garden export.
3.3. Research method
- Use research methods to selectively inherit documents, data, and results from previous research.
- Using experimental research methods - experimental design.
- Using the method of synthesizing and analyzing survey data: From the data collected through field survey forms, I synthesized and analyzed the experimental results using mathematical statistical methods in Forestry.
- Experimental layout method
Step 1: Experimental setup
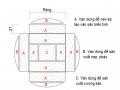
- The experiment was arranged in a randomized complete block design (RCBD). There were 4 treatments, each treatment was replicated 3 times, the treatments were arranged 80cm apart. There were protective fences around the area (the experiment was arranged as shown in Figure 1). Seeds were sown in pots, the potting mixture consisted of soil and fertilizer (98% soil + 2% dry chicken manure).
The pots were divided into 4 experimental formulas in the nursery, each formula had 90 pots, each pot had 1 - 3 seeds, a total of 4 formulas were 360 pots with the same watering and care regime but under 4 different shading conditions.
Experimental formula:
+ Formula 1 (75% coverage):
+ Formula 2 (50% coverage)
+ Formula 3 (cover 25%)
Protective strip
Protective strip
+ Formula 4 (no shading)
Repeat I
CT1 | CT2 | CT3 | CT4 | |
Repeat II | CT4 | CT1 | CT2 | CT3 |
Repeat III | CT3 | CT2 | CT1 | CT4 |
Maybe you are interested!
-
 Effect of density on growth and survival rate of juvenile stage of giant barb larvae reared in ComPosite tanks - 6
 -
 Effect of Initial Glyphosate Concentration on Processability of Electrochemical Fenton Process
 -
 Absolute growth rate of experimental chickens over weeks of age
 -
 Test Results of Optimal Mode Effect on Mechanical Properties
 -
 Basic Burn Rate Experimental Formulas

Figure 3.1: Experimental layout
Step 2: Prepare tools and materials for research
- Seeds, nursery bags, A layer soil, soil sieve.
- Height gauge, glass caliper.
- Chart, paper and pen.
- Water sprayer.
Step 3: Conduct experimental sowing and care
Create a pot
The potting soil is crushed, sieved to remove roots, stones, and other impurities, then mixed well with fertilizer according to the potting mixture formula. The potting soil is made of polyethylene, measuring 8 x 12cm, with a bottom with holes on both sides.
Create a bed for planting:
The bed has length and width according to the experimental layout model, the bed is cleared of weeds, leveled, and the base for placing the pot is fixed ground.
Close and stack the pots:
Put soil into 1/3 of the pot, press firmly to shape the pot, continue to put soil into the pot, and press the soil down evenly. The pots are placed close together on the bed.
Mound soil around the pot 2/3 high around the pot to keep the plant bed warm and prevent the pot from falling over.
Seed stimulation treatment:
- Remove broken and damaged seeds: Put the seeds in clean water, remove broken and damaged seeds, take only good seeds, wash them and soak them in hot water (35 - 40)˚C for (3 - 4) hours. With treated seeds, incubate until they crack and then sow.
Sow seeds in the pot:
Before sowing the seeds, the soil must be moistened 1 day before. Select the sprouted seeds, use a chopstick-sized stick with one end sharpened to make a hole in the middle of the soil twice as deep as the seed, then sow the seeds in the soil and cover the seeds with soil.
Seedling care:
+ Watering: Water the seedlings sufficiently in the early morning and cool afternoon. The number of waterings depends on the weather conditions and the humidity of the soil in the pot. The experiment always keeps the plants sufficiently moist, creating conditions for growth. The average amount of water for each irrigation is 3 - 5 liters/ m2
+ Transplanting: If any plant dies, replant immediately, ensuring each pot has 1 plant growing well.
+ Weeding and breaking the crust: Before weeding and breaking the crust for the seedling bed, water the bed enough for about 1 - 2 hours so that the seedling absorbs enough moisture.
Remove all weeds in the pot and around the bed, combine with light hoeing, break the crust with a small stick, hoe away from the base, avoid damaging the plant, on average 10 - 15 days/time.
* Research indicators and monitoring methods
- Study the effect of light regime on the growth of Lat hoa tree in the nursery stage.
- Collect data for each formula, measure 30 trees, each time repeat, measure 10 sample trees taken from 5 points of the diagonal line, the measured trees will be marked by tying a string to the tree trunk to avoid confusion.
Time measurements were made at the end of the experiment.
- The method is as follows:
+ Tree survival rate (%): Count the total number of living trees in each shade plot
+ Height (Hvn, cm): Measure from the ground to the top of the tree using a technical ruler with an accuracy of 0.1cm or 0.5cm.
+ Root collar diameter (Doo, mm): Measure 2cm from the surface of the pot using a palme ruler with an accuracy of 0.1mm or 0.5mm.
+ Number of leaves on tree (leaves): Count the total number of leaves on each tree for each formula. The results are recorded in table 3.1:
Good tree standards:
- Tree age: 8 - 9 months old.
- Root collar diameter: 0.5 - 0.6 cm.
- Average height: 60 - 80 cm.
- The tree has completely turned into wood.
- The tree is not infected with pests or diseases.
- The tree is not truncated and does not have many trunks.
Average tree standards:
- Tree age: 8 - 9 months old.
- Root collar diameter: 0.4 - 0.6 cm.
- Average height: 50 - 70 cm.
- The tree has partially turned into wood.
- The tree is less susceptible to pests and diseases.
- The tree is not truncated and does not have many trunks.
Bad tree standards: Tree age: 8 - 9 months old.
- Root collar diameter: 0.3 - 0.4 cm.
- Average height: 20 - 40 cm.
- The tree has turned into wood but is stunted.
- The tree is infected with pests.
- Tree with truncated top and many trunks.
Sample table 3.1: Growth indicators H vn , D 00 , quality of seedlings
STT
CTTN | H vn | D 00 | Quality | Take note uncle | |||
Good | TB | Bad | |||||
1 | 1 | ||||||
2 | 2 | ||||||
... | |||||||
- Data processing method
- Use mathematical statistical methods in forestry to calculate average tree top height and average root collar diameter through the following formulas:
𝒏
3
𝑯𝒗𝒏 = 𝒏 ∑ 𝑯𝒊
𝒊=𝟏
𝒏
3
𝑫𝒐𝒐 = 𝒏 ∑ 𝐃𝐢
𝒊=𝟏
In which: 𝑯 ̅ v n : Is the average height of the top
𝑫 ̅ ̅̅ o o : Is the average root diameter
D i : Is the value of the diameter of the base of the i-th tree. H i : Is the value of the height of the i-th tree.
n: Is the sample size i: the order of the trees in the lot...
- Analyze and process data on excel: Statistical indexes such as average index 𝑯 ̅ vn , 𝑫 ̅ oo , are performed using excel software with the Sum () function, Average () function...
- Use SAS 9.0 software to evaluate the differences between experimental formulas and analyze the rankings between formulas according to Duncan in the appendix.
* Command line: Calculate average on excel -> enter into SAS software
9.0 -> gives the results in the Anova table at the end of the thesis appendix.
- Pr: Is the probability level between the formulas that there is a difference
+ Pr < 0.05 has differences in experimental formulas
+ Pr > 0.05 no difference in experimental formulas
- Cv (%): Is the coefficient of variation in the field or in the laboratory.
+ Field: < 20% is acceptable,
> 20% do not accept
+ Laboratory: < 1 – 2% is acceptable
> 2% do not accept
+ Evaluate the rate of seedlings leaving the nursery: Calculate the results and record them in table 3.2:
Sample table 3.2: Seedling growth rate of shading formulas
CTTN
Quality | Seedling ratio garden export (%) | |||
Good | TB | Bad | ||
1 | ||||
2 | ||||
3 | ||||
… | ||||
PART 4
RESEARCH RESULTS AND DISCUSSION
4.1. Effect of shading regime on survival rate of Lat hoa trees in nursery stage
The results of the study on the effect of shading regime on the survival rate of Lat hoa trees are shown in table 4.1 and figure 4.1:
Table 4.1: Survival rate of Lat hoa plants of experimental formulas
Experimental formula
Number of living trees | Average survival rate % | |
CT1 (75% shading) | 81 | 90.0b |
CT2 (50% shading) | 83 | 92.22a |
CT3 (25% shading) | 76 | 84.44 c |
CT4 (No shading) | 75 | 83.33 d |
Pr | <0.05 | |
CV (%) | 8.6 |
SURVIVAL RATE
94
92
90
88
86
%
84
82
80
78
CT1
CT2
CT3
CT4
Figure 4.1: Graph showing the average survival rate (%) of Lat Hoa trees in CTTN
The results in Table 4.1 and Figure 4.1 show the survival rate of Lat Hoa plants in different experimental formulas. The survival rate of Lat Hoa plants in specific experimental formulas is as follows:
Formula 1 (Shading 75%): The number of experimental pots is 90 pots, the number of living plants is 81 and the survival rate is 90.0%, higher than formula 3 by 5.56%, higher than formula 4 by 6.67%, lower than formula 2 by 2.22%.
Formula 2 (Shading 50%): The number of experimental pots is 90 pots, the number of living plants is 83, achieving a survival rate of 92.22%, higher than formula 1 by 2.22%, higher than formula 3 by 7.78%, higher than formula 4 by 8.89%.
Formula 3 (Shading 25%): The number of experimental pots is 90 pots, the number of living plants is 76, achieving a survival rate of 84.44, 5.56% lower than formula 1, 7.78% lower than formula 2, and 1.11% higher than formula 4.