10
9
8
7
6
5
4
3
2
1
0
9
8
6
5
5
2
1
1
1
0
1 2 3 4 5 6 7 8 9 10
Exam results
Number of candidates achieved
+ Range of variation: from 2 points to 10 points.
Figure 3.1: First test results
h. Analysis and processing of test results
To process the test results, it is necessary to analyze the results to check the feasibility of using the TNKQ test set compiled by the teachers above.
Process of determining the feasibility of the TNKQ question set:
+ Analyze and evaluate TNKQ questions and exams
+ Write a report on the characteristics of the test
+ Identify questions that need to be revised to improve the quality of the test
+ Consult teachers and students about the feasibility of the set of questions
TNKQ used
- To ensure reliability, each multiple choice test must have at least 30 questions. Therefore, this TNKQ test test with 49 questions has been compiled according to weight table 3.1
The distribution in Table 3.1 shows that:
- With 49 questions, the number of questions is large enough to ensure accuracy.
reliable and reasonable
- The number of questions is evenly distributed across all chapters and all assessment objectives. Students cannot ignore any part, cannot memorize or study lopsidedly.
- The number of questions above and the wide range of knowledge mean that students do not have the opportunity or time to copy or exchange answers during the exam.
- The test is given to students, do not allow students to look at the test or discuss.
- Average test time is 1.5 minutes for 1 question
- Correct answers are scored according to the specified scale.
- Wrong question 0 points
Analyze and evaluate multiple choice questions and tests
After collecting all the candidates' papers, we proceed with the following steps:
Enter data into SPSS
The students' answers to each test question are entered into the computer using SPSS software. The IDs of 38 students are coded as 1, 2, 3,……, 38. After entering, we save the file name
Clean data
Check the CTSCPTTT.SAV file again to see if there are any errors or missing data.
Choose specialized software
There are many software to run Rasch model. For example: QUEST, CONQUEST, BIGSTEPS , WINSTEPS , FACET ...
However, in this study, QUEST software is used. The program running in Quest software is presented in Appendix 2.
Data analysis using Rasch model
When conducting objective assessment of multiple choice questions, it is important that the assessment of learning outcomes or test takers’ abilities is consistent across all test takers. This must be done through meaningful interpretation of the results. Identify variables by using an objective assessment process to assess the questions in this test set across all test takers and across test takers.
This data analysis is presented in the report below.
Report on test characteristics
To have a specific report on the characteristics of the test according to the statistical requirements in section 1.6.3, it is necessary to leak the following indicators:
a. Model fit of the questions and test reliability
Model fit
One of the important evidences to say that the set of questions compiled by teachers is good is to determine that all the questions form a structure. The analysis results using Quest software based on the Rasch model show that all the questions have Infit MNSQ ranging from 0.77 to 1.30 except for question number 13.
See figure 3.2 below.
HANHCTSCPTTT
Item Fit 1/ 5/ 8 20: 4
all on hanh (N = 38 L = 49 Probability Level= .50)
-------------------------------------------------- -------------------------------------------------- ----------------- INFIT
MNSQ .63 .67 .71 .77 .83 .91 1.00 1.10 1.20 1.30 1.40
----------+--------+--------+--------+--------- +--------+--------+--------+--------+--------- +--------+--------
1 item 1 | . | | | * . | ||
2 items 2 | . | * | | . | ||
3 items 3 | . | | | * . | ||
4 items 4 | . | |* | . | ||
5 items 5 | .* | | | . | ||
6 items 6 | . | | | * . | ||
7 items 7 | . | * | | . | ||
8 items 8 | . | * | | . | ||
9 items 9 | . | | | * . | ||
10 items 10 | . | * | | . | ||
11 items 11 | . | * | | . | ||
12 items 12 | . | * | | . | ||
13 items 13 | . | | | . * | ||
14 items 14 | . | * | | . | ||
15 items 15 | . | * | | . | ||
16 items 16 | . | * | | . | ||
17 items 17 | . | * | | . | ||
18 items 18 | . | * | | . | ||
19 items 19 | . | | * | . | ||
20 items 20 | . | | | * . | ||
21 items 21 | . | * | | . | ||
22 items 22 | . | | * | . | ||
23 items 23 | . | | | * . | ||
24 items 24 | . | | | * . | ||
25 items 25 | . | * | | . | ||
26 items 26 | . | | | * . | ||
27 items 27 | . | * | | . | ||
28 items 28 | . | * | | . | ||
29 items 29 | . | | | * . | ||
30 items 30 | . | * | | . | ||
31 items 31 | . | | | * . | ||
32 items 32 | . | * | | . | ||
33 items 33 | . | | | * . | ||
34 items 34 | . | | | * . | ||
35 items 35 | . | | | * . | ||
36 items 36 | . | * | | . | ||
37 items 37 | . | * | | . | ||
38 items 38 | . | | | * . | ||
39 items 39 | . | |* | . | ||
40 items 40 | . | * | | . | ||
41 items 41 | . | | | * . | ||
42 items 42 | . | * | | . | ||
43 items 43 | . | * | | . | ||
44 items 44 | . | | | * . | ||
45 items 45 | . | * | | . | ||
46 items 46 | . | | | * . | ||
47 items 47 | . | | | * . | ||
48 items 48 | . | | | * . | ||
49 items 49 | . | * | | . |
Maybe you are interested!
-

 Forms of Testing and Assessment of Math Learning Outcomes in High School
 -
 A Study on the Necessity and Feasibility of Measures for Managing Student Learning Outcomes Assessment Activities According to the Program
 -
 Ministry of Education and Training (2014), "Training Materials for Teaching and Testing, Evaluating Learning Outcomes Based on the Orientation of Developing Student Capacity in the Subject"
 -
 Developing the capacity to assess students' learning outcomes for teachers at Phu Thong high school, Bac Kan province - 1
 -
 Functions of Assessment of University Students' Learning Outcomes
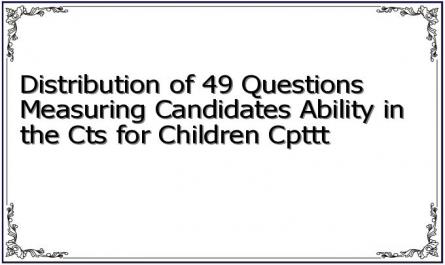
Figure 3.2: Distribution of 49 questions measuring candidates' abilities in the CTS module for children with autism spectrum disorder
Looking at the image above, we see that question 13 is an outlier that needs to be removed so that our question set forms a structure, so we change the control statement to:
scale 1-12, 14-49 !hanh then run Quest again to get the result as shown in figure 3.3 below.
HANHCTSCPTTT
-------------------------------------------------- -------------------------------------------------- -----------
Item Fit 1/ 5/ 08 23:59
all on hanh (N = 38 L = 48 Probability Level= .50)
-------------------------------------------------- -------------------------------------------------- ----------- INFIT
MNSQ .63 .67 .71 .77 .83 .91 1.00 1.10 1.20 1.30
----------+--------+--------+--------+--------- +--------+--------+--------+--------+--------- +---------
1 item 1
2 items 2
3 items 3
4 items 4
5 items 5
6 items 6
7 items 7
8 items 8
9 items 9
10 items 10
11 items 11
12 items 12
14 items 14
15 items 15
16 items 16
17 items 17
18 items 18
19 items 19
20 items 20
21 items 21
22 items 22
23 items 23
24 items 24
25 items 25
26 items 26
27 items 27
28 items 28
29 items 29
30 items 30
31 items 31
32 items 32
33 items 33
34 items 34
35 items 35
36 items 36
37 items 37
38 items 38
39 items 39
40 items 40
41 items 41
42 items 42
43 items 43
44 items 44
45 items 45
46 items 46
47 items 47
48 items 48
49 items 49
.
.
.
.
.
.
.
.
.
.
.
.
.
.
.
.
.
.
.
.
.
.
.
.
.
.
.
.
.
.
.
.
.
.
.
.
.
.
.
.
.
.
.
.
.
.
.
.
*
*
*
*
*
|
|
|
*
|
|
|
|
|
|
|
|
|
|
|
|
|
| *
|
|
| *
|
|
|
|
|
|
|
|
|
|
|
|
|
|
|
|
| *
|
|
* |
|
|
|
|
|
|
|
*
*
*
*
*
*
*
*
*
*
*
*
*
*
*
*
*
*
*
*
*
*
*
*
*
*
*
*
*
*
*
*
*
*
*
*
*
.
.
.
.
. *
.
.
.
.
.
.
.
.
.
.
.
.
.
.
.
.
.
.
.
.
.
.
.
.
.
.
.
.
.
.
.
.
.
.
.
.
.
.
.
.
.
.
.
Figure 3.3: Distribution of 48 questions measuring candidates' abilities in the CTS module for children with autism spectrum disorder.
Looking at figure 3.3, we see that question 5 is an outlier that needs to be removed so that our question set forms a structure, so we change the control statement to:
scale 1-4, 6-12, 14-49 !hanh then run Quest again to get the result as shown in figure 3.4 below.
Item Fit
all on hanh (N = 38 L = 47 Probability Level= .50)
1/ 5/ 8 22:57
-------------------------------------------------- -------------------------------------------------- ------------------- INFIT
MNSQ .63 .67 .71 .77 .83 .91 1.00 1.10 1.20 1.30 1.40
----------+--------+--------+--------+--------- +--------+--------+--------+--------+--------- +--------+--------
HANHCTSCPTTT
. | | * . | |
2 items 2 | . * | | . |
3 items 3 | . | | * . |
4 items 4 | . |* | . |
6 items 6 | . | | * . |
7 items 7 | . * | | . |
8 items 8 | . * | | . |
9 items 9 | . | | * . |
10 items 10 | . * | | . |
11 items 11 | . * | | . |
12 items 12 | . * | | . |
14 items 14 | . * | | . |
15 items 15 | . * | | . |
16 items 16 | . * | | . |
17 items 17 | . * | | . |
18 items 18 | . * | | . |
19 items 19 | . | * | . |
20 items 20 | . | | * . |
21 items 21 | . * | | . |
22 items 22 | . | * | . |
23 items 23 | . | | * . |
24 items 24 | . | | * . |
25 items 25 | . * | | . |
26 items 26 | . | | * . |
27 items 27 | . * | | . |
28 items 28 | . * | | . |
29 items 29 | . | | * . |
30 items 30 | . * | | . |
31 items 31 | . | | * . |
32 items 32 | . * | | . |
33 items 33 | . | | * . |
34 items 34 | . | | * . |
35 items 35 | . | | * . |
36 items 36 | . * | | . |
37 items 37 | . * | | . |
38 items 38 | . | | * . |
39 items 39 | . * | . |
40 items 40 | . * | | . |
41 items 41 | . | | * . |
42 items 42 | . *| | . |
43 items 43 | . * | | . |
44 items 44 | . | | * . |
45 items 45 | . * | | . |
46 items 46 | . | | * . |
47 items 47 | . | | * . |
48 items 48 | . | | * . |
49 items 49 | . * | | . |
Figure 3.4: Distribution of 47 questions measuring candidates' abilities in the CTS module for children with autism spectrum disorder
Looking at Figure 3.4, we see that the Infit Mean Square of all 47 questions is within the allowable range from 0.77 to 1.30 (consistent with the Rasch model). In other words, these 47 questions form a structure.4
When considering how well the data fits the model, in addition to looking at the item fit table
4Statistics of the fit of the questionnaire to the model (Adams & Khoo, 1993)
We also consider information about the calculation results of questions such as table 3.3.
HANHCPTTT
Item Estimates (Thresholds)
1/ 5/ 08 22:57
all on hanh (N = 38 L = 47 Probability Level= .50)
-------------------------------------------------- -----
Summary of item Estimates
=========================
Fit Statistics Check the statistical fit of the questions to the Rasch model
=== ...
Infit Mean Square Outfit Mean Square
Infit t Mean
SD
Outfit t
.04
.81
Mean SD
.09
.71
0 items with zero scores
0 items with perfect scores
Table 3.3: Information on calculation results of questions
.00 | Very good | ||
SD | .67 | Meet the requirements | |
SD (adjusted) | .56 | ||
Reliability of | estimate | .70 | Meet the requirements |
1.00 | Very good | Mean | 1.00 | |
SD | .11 | Good | SD | .24 |
* Check the statistical fit of the questions to the Rasch model (Fit Statistics)
Infit Mean Square has Mean = 1.00 ( Very good ) and SD = .11 ( Good)
Conclusion: Based on the data obtained in Table 3.3 and Figure 3.4 above, the conclusion is drawn: the data of 47 multiple choice questions is completely consistent with the Rasch model and the reliability of the test meets the requirements.
b. Difficulty of the questions
Question difficulty is one of the important characteristics of a question because it indicates the reliability and validity of each question in the test/exam. At the same time, it also allows us to compare the difficulty of the question with the ability of the candidates. To be able to analyze the difficulty of the question, Quest software provides us with a matrix (chart) comparing the ability of 38 candidates with the difficulty of 47 questions. According to this chart, the numbers on the right side of the chart show us the difficulty of the questions. The x marks on the left side of the chart show the ability distribution of the candidates.
The matrix below shows the distribution of difficulty of test questions compared to the distribution of candidates' abilities at the same measurement levels. The questions are on the right and the students' abilities are on the left of the scale. Looking at the scale clearly shows the distribution of difficulty of test questions covering almost all the abilities of the candidates. There are very easy questions and there are also very difficult questions. Looking at the chart below, we can see that the test is well designed to suit the ability of the candidates in general. This is shown by the difficulty of the test covering almost all the abilities of the candidates. While the difficulty of the questions ranges from -1.2 to
+2.2 on the logit scale means that the candidate's ability is between -1.3 and + 1.8, except for 1 candidate with very high ability (>3.0) and 2 candidates with very low ability (from -
1.8 to -3.0). The easiest question is question 32 and the most difficult question is question 30. Questions 3, 6, 20, 38 and question 44 are 23 questions with the same difficulty level, similarly we can see that question 21 and question 31 are also of the same difficulty level, etc.
There are no questions in the test that are too easy and there are questions that are too difficult for the candidate's ability. However, there are also some questions that are a bit difficult (question 45, question 30, etc.). These are questions used to measure candidates with high ability. These questions require candidates not only to remember or understand knowledge but also to have the ability to analyze, synthesize theoretical knowledge and then connect from reality to give their answers. Questions: 25 and 32 are quite easy questions. Most candidates answered these questions correctly except for 2 candidates with very low ability (at a level of nearly -2.0 or lower). These are questions used to measure candidates with low ability. At the same time, looking at the matrix below, we can also see that there are many questions with average difficulty and difficulty to measure candidates with equivalent ability.
Looking at table 3.4, it can be concluded that this set of questions compiled for the CTS course for children with disabilities to measure the ability of 38 candidates of class K2, Faculty of Education and Training is quite good. Comments:
The matrix above shows that the distribution between the difficulty of the questions and the ability of the candidates is a normal distribution. More specifically, the difficulty of the questions is suitable for most of the candidates' abilities.
Candidates have different levels of ability.
Add additional questions with difficulty levels as instructed above to measure candidates at low and very high ability levels.
Table 3.4. Matrix comparing candidate ability with question difficulty
X XX | | | | 45 | ||||||
| | 4 | 26 | 48 | |||||
| | ||||||||
1.0 | X | | | ||||||
X | | | 9 | 37 | |||||
| | ||||||||
X | | | 21 | 31 | |||||
XX | | | 36 | ||||||
XX | | | 8 | 28 | 46 | 49 | |||
XXXXX | | | 19 | ||||||
.0 | XXX | | | 17 | 23 | 27 | |||
XX | | | 3 | 6 | 20 | 38 | 44 | ||
XXXX | | | 1 | 7 | 11 | 35 | 41 | 42 | |
XXX | | | |||||||
| | 10 | 18 | 39 | 47 | ||||
X | | | 2 | 14 | 15 | 16 | 24 | 40 | |
XX | | | 22 | 33 | 34 | 43 | |||
X | | | 12 | 29 | |||||
-1.0 | X | | | 25 | |||||
X | | | |||||||
| | 32 | |||||||
| | ||||||||
| | ||||||||
| | ||||||||
| | ||||||||
X | | | |||||||
-2.0 | | | |||||||
|
|
|
|
HANHCTSCPTTT
Item Estimates (Thresholds)
1/ 5/ 8 22:57
all on hanh (N = 38 L = 47 Probability Level= .50)
-------------------------------------------------- -------------------------------------------------- -------------------
4.0 |
HIGH CAPABILITY |
X
|
|
|
|
|
|
|
|
|
|
|
|
|
|
|
|
|
|
VERY DIFFICULT
Add questions with difficulty level at this level
3.0
30
2.0
X
X
Add questions with difficulty level at this level
Distribution of
Questions by difficulty
Add questions with difficulty level at this level
X
-3.0
|
|
|
|
VERY EASY
-------------------------------------------------- -------------------------------------------------- -------------------
Each X represents 1 students: Each X represents 1 student
CAPACITY
Distribution of candidates according to ability
When analyzing the difficulty of the question, we also need to pay attention to information about the candidate's ability calculation results as shown in Table 3.5 below.