feedback for this task. In addition, the number of teachers who can identify the correctness of students' answers and explain specifically is only 34.03%. No teachers use knowledge about the shape of the distribution of the chart to explain the answers of students A, B, C. They can only explain by using formulas to calculate specific values and compare. This shows that teachers have not accumulated enough knowledge to teach the mean, median, mode on bar charts and histograms. They are also confused in predicting cases of knowledge objects that may occur in teaching. This is very important to perfect the specific type of content knowledge, specific to teaching mathematics.
b) The development of specific content knowledge of future mathematics teachers to teach characteristic numbers measuring central tendency on bar graphs and histograms through lesson study
Participating in the NCBH helped the teachers' knowledge of teaching the characteristic numbers measuring central tendency on bar charts and histograms to be fully developed step by step. In the lesson planning step, the teachers' knowledge of teaching was improved through discussions with group members and researchers. By revising the lesson plan, the teachers' knowledge of teaching gradually improved in their ability to analyze the solutions of the problem and provide knowledge evidence for those solutions. The teachers' ability to determine the correctness of common and different solutions was seen in the final version of the lesson plan in step 2. Discussing exercise 3, the teachers and researchers had the following exchanges:
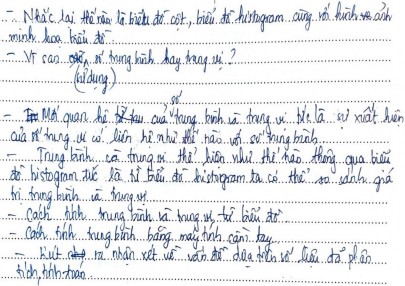
Researcher:Please give your opinion and determine whether it is true or false. in the answers of students A, B, C. | |
GVTTL H34: | Students must calculate the average and median to make comparisons. Here the average is 3.7 and the median is 3, so student B answers correct words |
Researcher: | What is the reason that students A and C gave such answers? |
GVTTL H09: | HS A average is 3.7; The median is 5 because it is considered the middle position of a data set without considering the frequency of the data or the arrangement of the data set. in order from low to high frequency: |
Maybe you are interested!
-
 Developing the knowledge and professional practice of future mathematics teachers for teaching statistics - 21
 -
 Professional Knowledge for Practice
 -
 Professional Knowledge for Practice
 -
 Managing the Capacity Building Activities for Teaching Mathematics According to the New General Education Program for Teachers in Secondary Schools
 -
 Solutions for tourism development in Tien Lang - 10
zt2i3t4l5ee
zt2a3gstourism, tourism development
zt2a3ge
zc2o3n4t5e6n7ts
- District People's Committees and authorities of communes with tourist attractions should support, promote, and provide necessary information to people, helping them improve their knowledge about tourism. Raise tourism awareness for local people.
*
* *
Due to limited knowledge and research time, the thesis inevitably has shortcomings. Therefore, I look forward to receiving guidance from teachers, experts as well as your comments to make the thesis more complete.
Chapter III Conclusion
Through the issues presented in Chapter II, we can come to some conclusions:
Based on the strengths of available tourism resources, the types of tourism in Tien Lang that need to be promoted in the coming time are sightseeing and resort tourism, discovery tourism, weekend tourism. To improve the quality and diversify tourism products, Tien Lang district needs to combine with local cultural tourism resources, at the same time combine with surrounding areas, build rich tourism products. The strengths of Tien Lang tourism are eco-tourism and cultural tourism, so developing Tien Lang tourism must always go hand in hand with restoring and preserving types of cultural tourism resources. Some necessary measures to support and improve the efficiency of exploiting tourism resources in Tien Lang are: strengthening the construction of technical facilities and labor force serving tourism, actively promoting and advertising tourism, and expanding forms of capital mobilization for tourism development.
CONCLUDE
I Conclusion
1. Based on the results achieved within the framework of the thesis's needs, some basic conclusions can be drawn as follows:
Tien Lang is a locality with great potential for tourism development. The relatively abundant cultural tourism resources and ecological tourism resources have great appeal to tourists. Based on this potential, Tien Lang can build a unique tourism industry that is competitive enough with other localities within Hai Phong city and neighboring areas.
In recent years, the exploitation of the advantages of resources to develop tourism and build tourist routes in Tien Lang has not been commensurate with the available potential. In terms of quantity, many resource objects have not been brought into the purpose of tourism development. In terms of time, the regular service time has not been extended to attract more visitors. Infrastructure and technical facilities are still weak. The labor force is still thin and weak in terms of expertise. Tourism programs and routes have not been organized properly, the exploitation content is still monotonous, so it has not attracted many visitors. Although resources have not been mobilized much for tourism development, they are facing the risk of destruction and degradation.
2. Based on the results of investigation, analysis, synthesis, evaluation and selective absorption of research results of related topics, the thesis has proposed a number of necessary solutions to improve the efficiency of exploiting tourism resources in Tien Lang such as: promoting the restoration and conservation of tourism resources, focusing on investment and key exploitation of ecotourism resources, strengthening the construction of infrastructure and tourism workforce. Expanding forms of capital mobilization. In addition, the thesis has built a number of tourist routes of Hai Phong in which Tien Lang tourism resources play an important role.
Exploiting Tien Lang tourism resources for tourism development is currently facing many difficulties. The above measures, if applied synchronously, will likely bring new prospects for the local tourism industry, contributing to making Tien Lang tourism an important economic sector in the district's economic structure.
REFERENCES
1. Nhuan Ha, Trinh Minh Hien, Tran Phuong, Hai Phong - Historical and cultural relics, Hai Phong Publishing House, 1993
2. Hai Phong City History Council, Hai Phong Gazetteer, Hai Phong Publishing House, 1990.
3. Hai Phong City History Council, History of Tien Lang District Party Committee, Hai Phong Publishing House, 1990.
4. Hai Phong City History Council, University of Social Sciences and Humanities, VNU, Hai Phong Place Names Encyclopedia, Hai Phong Publishing House. 2001.
5. Law on Cultural Heritage and documents guiding its implementation, National Political Publishing House, Hanoi, 2003.
6. Tran Duc Thanh, Lecture on Tourism Geography, Faculty of Tourism, University of Social Sciences and Humanities, VNU, 2006
7. Hai Phong Center for Social Sciences and Humanities, Some typical cultural heritages of Hai Phong, Hai Phong Publishing House, 2001
8. Nguyen Ngoc Thao (editor-in-chief, Tourism Geography, Hai Phong Publishing House, two volumes (2001-2002)
9. Nguyen Minh Tue and group of authors, Hai Phong Tourism Geography, Ho Chi Minh City Publishing House, 1997.
10. Nguyen Thanh Son, Hai Phong Tourism Territory Organization, Associate Doctoral Thesis in Geological Geography, Hanoi, 1996.
11. Decision No. 2033/QD – UB on detailed planning of Tien Lang town, Hai Phong city until 2020.
12. Department of Culture, Information, Hai Phong Museum, Hai Phong relics
- National ranked scenic spot, Hai Phong Publishing House, 2005. 13. Tien Lang District People's Committee, Economic Development Planning -
Culture - Society of Tien Lang district to 2010.
14.Website www.HaiPhong.gov.vn
APPENDIX 1
List of national ranked monuments
STT
Name of the monument
Number, year of decisiondetermine
Location
1
Gam Temple
938 VH/QĐ04/08/1992
Cam Khe Village- Toan Thang commune
2
Doc Hau Temple
9381 VH/QĐ04/08/1992
Doc Hau Village –Toan Thang commune
3
Cuu Doi Communal House
3207 VH/QĐDecember 30, 1991
Zone II of townTien Lang
4
Ha Dai Temple
938 VH/QĐ04/08/1992
Ha Dai Village –Tien Thanh commune
APPENDIX II
STT
Name of the monument
Number, year of decision
Location
1
Phu Ke Pagoda Temple
178/QD-UBJanuary 28, 2005
Zone 1 - townTien Lang
2
Trung Lang Temple
178/QD-UBJanuary 28, 2005
Zone 4 – townTien Lang
3
Bao Khanh Pagoda
1900/QD-UBAugust 24, 2006
Nam Tu Village -Kien Thiet commune
4
Bach Da Pagoda
1792/QD-UB11/11/2002
Hung Thang Commune
5
Ngoc Dong Temple
177/QD-UBNovember 27, 2005
Tien Thanh Commune
6
Tomb of Minister TSNhu Van Lan
2848/QD-UBSeptember 19, 2003
Nam Tu Village -Kien Thiet commune
7
Canh Son Stone Temple
2160/QD-UBSeptember 19, 2003
Van Doi Commune –Doan Lap
8
Meiji Temple
2259/QD-UBSeptember 19, 2002
Toan Thang Commune
9
Tien Doi Noi Temple
477/QD-UBSeptember 19, 2005
Doan Lap Commune
10
Tu Doi Temple
177/QD-UBJanuary 28, 2005
Doan Lap Commune
11
Duyen Lao Temple
177/QD-UBJanuary 28, 2005
Tien Minh Commune
12
Dinh Xuan Uc Pagoda
177/QD-UBJanuary 28, 2005
Bac Hung Commune
13
Chu Khe Pagoda
177/QD-UBJanuary 28, 2005
Hung Thang Commune
14
Dong Dinh
2848/QD-UBNovember 21, 2002
Vinh Quang Commune
15
President's Memorial HouseTon Duc Thang
177/QD-UBJanuary 28, 2005
NT Quy Cao
Ha Dai Temple
Ben Vua Temple
Tien Lang hot spring
div.maincontent .p { color: black; font-family:"Times New Roman", serif; font-style: normal; font-weight: normal; text-decoration: none; font-size: 14pt; margin:0pt; } div.maincontent p { color: black; font-family:"Times New Roman", serif; font-style: normal; font-weight: normal; text-decoration: none; font-size: 14pt; margin:0pt; } div.maincontent .s1 { color: black; font-family:"Times New Roman", serif; font-style: normal; font-weight: normal; font-size: 16pt; } div.maincontent .s2 { color: black; font-family:"Times New Roman", serif; font-style: italic; font-weight: bold; text-decoration: none; font-size: 14pt; } div.maincontent .s3 { color: black; font-family:"Times New Roman", serif; font-style: italic; font-weight: normal; text-decoration: none; font-size: 14pt; } div.maincontent .s4 { color: black; font-family:"Times New Roman", serif; font-style: normal; font-weight: normal; font-size: 14pt; } div.maincontent .s5 { color: black; font-family:"Times New Roman", serif; font-style: normal; font-weight: bold; font-size: 14pt; } div.maincontent .s6 { color: black; font-family:"Times New Roman", serif; font-style: normal; font-weight: normal; text-decoration: none; font-size: 14pt; } div.maincontent .s7 { color: black; font-family:"Times New Roman", serif; font-style: normal; font-weight: bold; text-decoration: none; font-size: 14pt; } div.maincontent .s8 { color: black; font-family:"Times New Roman", serif; font-style: normal; font-weight: normal; text-decoration: none; font-size: 9pt; vertical-align: 6pt; } div.maincontent .s9 { color: black; font-family:"Times New Roman", serif; font-style: normal; font-weight: bold; text-decoration: none; font-size: 12pt; } div.maincontent .s11 { color: black; font-family:"Times New Roman", serif; font-style: normal; font-weight: normal; tex
Solutions for tourism development in Tien Lang - 10
zt2i3t4l5ee
zt2a3gstourism, tourism development
zt2a3ge
zc2o3n4t5e6n7ts
- District People's Committees and authorities of communes with tourist attractions should support, promote, and provide necessary information to people, helping them improve their knowledge about tourism. Raise tourism awareness for local people.
*
* *
Due to limited knowledge and research time, the thesis inevitably has shortcomings. Therefore, I look forward to receiving guidance from teachers, experts as well as your comments to make the thesis more complete.
Chapter III Conclusion
Through the issues presented in Chapter II, we can come to some conclusions:
Based on the strengths of available tourism resources, the types of tourism in Tien Lang that need to be promoted in the coming time are sightseeing and resort tourism, discovery tourism, weekend tourism. To improve the quality and diversify tourism products, Tien Lang district needs to combine with local cultural tourism resources, at the same time combine with surrounding areas, build rich tourism products. The strengths of Tien Lang tourism are eco-tourism and cultural tourism, so developing Tien Lang tourism must always go hand in hand with restoring and preserving types of cultural tourism resources. Some necessary measures to support and improve the efficiency of exploiting tourism resources in Tien Lang are: strengthening the construction of technical facilities and labor force serving tourism, actively promoting and advertising tourism, and expanding forms of capital mobilization for tourism development.
CONCLUDE
I Conclusion
1. Based on the results achieved within the framework of the thesis's needs, some basic conclusions can be drawn as follows:
Tien Lang is a locality with great potential for tourism development. The relatively abundant cultural tourism resources and ecological tourism resources have great appeal to tourists. Based on this potential, Tien Lang can build a unique tourism industry that is competitive enough with other localities within Hai Phong city and neighboring areas.
In recent years, the exploitation of the advantages of resources to develop tourism and build tourist routes in Tien Lang has not been commensurate with the available potential. In terms of quantity, many resource objects have not been brought into the purpose of tourism development. In terms of time, the regular service time has not been extended to attract more visitors. Infrastructure and technical facilities are still weak. The labor force is still thin and weak in terms of expertise. Tourism programs and routes have not been organized properly, the exploitation content is still monotonous, so it has not attracted many visitors. Although resources have not been mobilized much for tourism development, they are facing the risk of destruction and degradation.
2. Based on the results of investigation, analysis, synthesis, evaluation and selective absorption of research results of related topics, the thesis has proposed a number of necessary solutions to improve the efficiency of exploiting tourism resources in Tien Lang such as: promoting the restoration and conservation of tourism resources, focusing on investment and key exploitation of ecotourism resources, strengthening the construction of infrastructure and tourism workforce. Expanding forms of capital mobilization. In addition, the thesis has built a number of tourist routes of Hai Phong in which Tien Lang tourism resources play an important role.
Exploiting Tien Lang tourism resources for tourism development is currently facing many difficulties. The above measures, if applied synchronously, will likely bring new prospects for the local tourism industry, contributing to making Tien Lang tourism an important economic sector in the district's economic structure.
REFERENCES
1. Nhuan Ha, Trinh Minh Hien, Tran Phuong, Hai Phong - Historical and cultural relics, Hai Phong Publishing House, 1993
2. Hai Phong City History Council, Hai Phong Gazetteer, Hai Phong Publishing House, 1990.
3. Hai Phong City History Council, History of Tien Lang District Party Committee, Hai Phong Publishing House, 1990.
4. Hai Phong City History Council, University of Social Sciences and Humanities, VNU, Hai Phong Place Names Encyclopedia, Hai Phong Publishing House. 2001.
5. Law on Cultural Heritage and documents guiding its implementation, National Political Publishing House, Hanoi, 2003.
6. Tran Duc Thanh, Lecture on Tourism Geography, Faculty of Tourism, University of Social Sciences and Humanities, VNU, 2006
7. Hai Phong Center for Social Sciences and Humanities, Some typical cultural heritages of Hai Phong, Hai Phong Publishing House, 2001
8. Nguyen Ngoc Thao (editor-in-chief, Tourism Geography, Hai Phong Publishing House, two volumes (2001-2002)
9. Nguyen Minh Tue and group of authors, Hai Phong Tourism Geography, Ho Chi Minh City Publishing House, 1997.
10. Nguyen Thanh Son, Hai Phong Tourism Territory Organization, Associate Doctoral Thesis in Geological Geography, Hanoi, 1996.
11. Decision No. 2033/QD – UB on detailed planning of Tien Lang town, Hai Phong city until 2020.
12. Department of Culture, Information, Hai Phong Museum, Hai Phong relics
- National ranked scenic spot, Hai Phong Publishing House, 2005. 13. Tien Lang District People's Committee, Economic Development Planning -
Culture - Society of Tien Lang district to 2010.
14.Website www.HaiPhong.gov.vn
APPENDIX 1
List of national ranked monuments
STT
Name of the monument
Number, year of decisiondetermine
Location
1
Gam Temple
938 VH/QĐ04/08/1992
Cam Khe Village- Toan Thang commune
2
Doc Hau Temple
9381 VH/QĐ04/08/1992
Doc Hau Village –Toan Thang commune
3
Cuu Doi Communal House
3207 VH/QĐDecember 30, 1991
Zone II of townTien Lang
4
Ha Dai Temple
938 VH/QĐ04/08/1992
Ha Dai Village –Tien Thanh commune
APPENDIX II
STT
Name of the monument
Number, year of decision
Location
1
Phu Ke Pagoda Temple
178/QD-UBJanuary 28, 2005
Zone 1 - townTien Lang
2
Trung Lang Temple
178/QD-UBJanuary 28, 2005
Zone 4 – townTien Lang
3
Bao Khanh Pagoda
1900/QD-UBAugust 24, 2006
Nam Tu Village -Kien Thiet commune
4
Bach Da Pagoda
1792/QD-UB11/11/2002
Hung Thang Commune
5
Ngoc Dong Temple
177/QD-UBNovember 27, 2005
Tien Thanh Commune
6
Tomb of Minister TSNhu Van Lan
2848/QD-UBSeptember 19, 2003
Nam Tu Village -Kien Thiet commune
7
Canh Son Stone Temple
2160/QD-UBSeptember 19, 2003
Van Doi Commune –Doan Lap
8
Meiji Temple
2259/QD-UBSeptember 19, 2002
Toan Thang Commune
9
Tien Doi Noi Temple
477/QD-UBSeptember 19, 2005
Doan Lap Commune
10
Tu Doi Temple
177/QD-UBJanuary 28, 2005
Doan Lap Commune
11
Duyen Lao Temple
177/QD-UBJanuary 28, 2005
Tien Minh Commune
12
Dinh Xuan Uc Pagoda
177/QD-UBJanuary 28, 2005
Bac Hung Commune
13
Chu Khe Pagoda
177/QD-UBJanuary 28, 2005
Hung Thang Commune
14
Dong Dinh
2848/QD-UBNovember 21, 2002
Vinh Quang Commune
15
President's Memorial HouseTon Duc Thang
177/QD-UBJanuary 28, 2005
NT Quy Cao
Ha Dai Temple
Ben Vua Temple
Tien Lang hot spring
div.maincontent .p { color: black; font-family:"Times New Roman", serif; font-style: normal; font-weight: normal; text-decoration: none; font-size: 14pt; margin:0pt; } div.maincontent p { color: black; font-family:"Times New Roman", serif; font-style: normal; font-weight: normal; text-decoration: none; font-size: 14pt; margin:0pt; } div.maincontent .s1 { color: black; font-family:"Times New Roman", serif; font-style: normal; font-weight: normal; font-size: 16pt; } div.maincontent .s2 { color: black; font-family:"Times New Roman", serif; font-style: italic; font-weight: bold; text-decoration: none; font-size: 14pt; } div.maincontent .s3 { color: black; font-family:"Times New Roman", serif; font-style: italic; font-weight: normal; text-decoration: none; font-size: 14pt; } div.maincontent .s4 { color: black; font-family:"Times New Roman", serif; font-style: normal; font-weight: normal; font-size: 14pt; } div.maincontent .s5 { color: black; font-family:"Times New Roman", serif; font-style: normal; font-weight: bold; font-size: 14pt; } div.maincontent .s6 { color: black; font-family:"Times New Roman", serif; font-style: normal; font-weight: normal; text-decoration: none; font-size: 14pt; } div.maincontent .s7 { color: black; font-family:"Times New Roman", serif; font-style: normal; font-weight: bold; text-decoration: none; font-size: 14pt; } div.maincontent .s8 { color: black; font-family:"Times New Roman", serif; font-style: normal; font-weight: normal; text-decoration: none; font-size: 9pt; vertical-align: 6pt; } div.maincontent .s9 { color: black; font-family:"Times New Roman", serif; font-style: normal; font-weight: bold; text-decoration: none; font-size: 12pt; } div.maincontent .s11 { color: black; font-family:"Times New Roman", serif; font-style: normal; font-weight: normal; tex
0; 6; 8; 9; 10; 7; 5; 4; 1; 3; 2 so the median is 7. From this it follows that the mean is less than the median. | |
GVTTL H17: | Student C incorrectly determined the median to be 5 and calculated the average without multiplying the frequency of the data: x 0 1 2 3 4 5 6 7 8 9 10 5 11 So the median and mean are equal. |

Although through discussion, the teachers had more complete analysis, when practicing teaching for the first time, they still could not fully demonstrate the SCK. The teachers gave the correct solutions to the essay exercises and chose the correct answers to the multiple-choice exercises but did not clearly explain or provide theoretical evidence for the students' answers. Through the discussion after the first teaching session, the teachers realized this shortcoming. In the second teaching practice, teacher D65 provided statistically significant explanations for the solutions to the problems and clearly analyzed the correct/incorrect answers in the multiple-choice exercises. In addition, teacher H17 gave feedback in the interview form at the final step.
“I have found that my ability to perceive a piece of empirical knowledge from many different perspectives has gradually increased. In my opinion, this ability is very important for a teacher. It not only helps me approach the problem in a diverse way, but also helps me determine the accuracy and explain students' answers, making teaching more effective.”
In addition, the teachers who participated in the study commented on how they became more aware of the origins of errors in students' responses. They had previously considered that errors might be random errors, but they did not know that they were a reflection of some form of logical reasoning related to students' developing thinking.
The descriptive data in our study showed that the teachers of the pedagogical research supported the development of the knowledge base for teaching the central tendency measures on their bar charts and histograms. The teachers of the pedagogical research were reinforced and developed understandings of the importance of the knowledge of the research topic during the pedagogical research. On the other hand, the teachers of the pedagogical research identified the knowledge needed to identify possible errors. This facilitated the development of pedagogical content knowledge such as predicting student responses or analyzing incorrect student responses.
5.3.3. The development of future mathematics teachers' knowledge of students' learning to teach central tendency characteristic numbers on bar graphs and histograms through lesson study
a) Knowledge of student learning for future mathematics teachers to teach central tendency characteristic numbers on bar graphs and histograms
Teachers’ knowledge of content knowledge and understanding of mathematics are two major areas of pedagogical content knowledge necessary for effective teaching. Knowledge of content knowledge is a teacher’s knowledge of how students understand mathematical content, combined with the mathematical content itself. Teachers who have good knowledge of this knowledge are often able to consider how students learn a mathematical concept or content, or to pay attention to common errors or misconceptions that students have about that mathematical content (Ball et al., 2008).
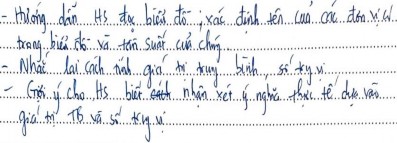
The focus of the task set out in exercise 4.1 is to assess the knowledge of teachers of the KCS on common concepts and mistakes of students when determining the mean, median on bar charts and histograms. Having a good KCS knowledge style helps teachers understand how students can think and what they will encounter. This helps teachers be proactive in the process of designing lessons as well as answering students' questions when teaching. The chart below shows the predictions of teachers of the KCS knowledge style about students' difficulties and mistakes, which we have classified according to the keywords of the KCS knowledge style.
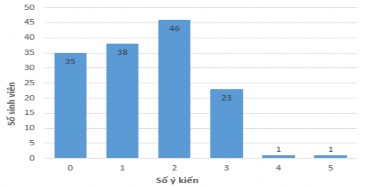
Figure 5.10. Chart showing the number of answers of teachers for exercise 4.1
Through the chart above, we can see that 24.3% of teachers did not give any ideas, 58.3% of teachers only gave 1 to 2 ideas for this answer. On the contrary, only 2 teachers pointed out 4 or 5 difficulties and mistakes of students. From this, it can be seen that the knowledge base of teachers has not been fully accumulated to effectively teach the topic of average, median on bar charts and histograms. Teachers not only need to consolidate their knowledge of the content of this topic but also need to improve their knowledge of how students think about that problem. This is the type of knowledge necessary in the teaching practice of teachers.
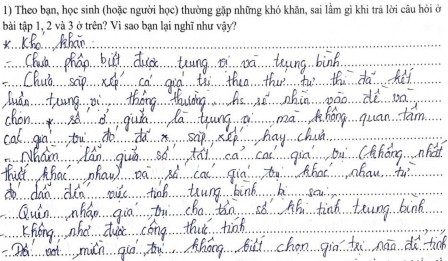
Table 5.11. Illustration of GVTTL's response to KCS
Teacher
Illustrative example | |
Teacher D4 clearly stated 5 difficulties of students, proving that the teacher has a good understanding of students' thinking when learning about averages, medians on bar charts and distributions. |
|
Teacher D47 pointed out 4 common mistakes but the explanation was not clear. However, the answer also showed the teacher's understanding of the type of KCS knowledge. |
|
Teacher D43 gives 3 opinions for students' difficulties and mistakes and has appropriate explanations. |
|
Teacher D69 mentioned two basic difficulties that students often encounter. |
|
b) The progression of future mathematics teachers' knowledge of student learning to teach central tendency characteristic numbers on bar graphs and histograms through lesson study
Although the teachers in group 2 had studied teaching methods and the teachers in group 2 had also participated in a pedagogical internship at school, they did not pay attention to knowledge about students' learning during the teaching process. In the first lesson plan preparation, the indicators of KCS were not clearly seen. The teachers only stated the tasks that students had to do or gave students' answers as the correct results of the exercises without any explanation. After discussing with the researcher, in the next lesson plan preparation, the groups had to spend a considerable amount of time discussing areas that students might have difficulty with and predicting questions and answers that students might have in the lesson. Teacher D47 commented:
“In my opinion, anticipating students’ answers (right and wrong) in advance helps the teaching and learning process to be more effective and better. Teachers will grasp students’ thinking and analyze to give explanations when students give wrong answers, understand their thoughts and create students’ trust in the teacher as well as the knowledge that the teacher provides.”
Although there were predictions of students' answers, when practicing teaching for the first time, teacher D65 still did not fully explain or give essential explanations about the way students reasoned. When reflecting on the first lesson, the teachers also mentioned the importance of closely analyzing what students answered, especially when students' answers were not mathematically correct. Analyzing students' answers showed the complexity of students' mathematical thinking, which supported teachers in designing and practicing teaching. After the feedback session, in the second teaching session, the teachers determined the correctness and incorrectness and gave arguments to explain why students answered that way. Teacher H34 shared:
“Through working with the group, I reflected on what students were thinking and realized the importance of understanding how students responded to each problem. This has implications for planning, helping me prepare good open-ended questions to guide students to take ownership of knowledge.”
By predicting students' questions and answers, teachers are encouraged to think about students' thinking and understand better their own and their students' mathematical knowledge. Teacher D40 commented:
“Through this experiment, I also had to learn and study the same knowledge as the first time. From there, I felt the difficulties and mistakes of students and put myself in the position of students to find the optimal solution for myself as well as for students.”
5.3.4. The development of future mathematics teachers' knowledge of teaching central tendency characteristic numbers on bar graphs and histograms through lesson study
a) Knowledge of teaching for future mathematics teachers to teach characteristic numbers measuring central tendency on bar graphs and histograms
KCT is a combination of knowledge about teaching and knowledge about the mathematics related to that content. KCT refers to how to design a teaching activity to develop students' understanding of mathematics and how a mathematical content shapes the teaching of mathematics (Ball et al., 2008. Exercise 4.2 is designed to assess the type of KCT knowledge in the ability to plan a lesson, give instructions, note, and effectively handle teaching situations about the mean, median on a bar chart and histogram.
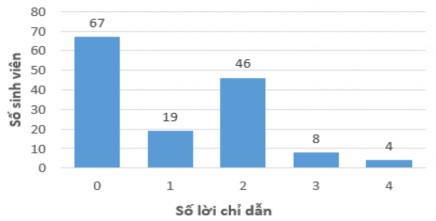
Figure 5.11. Chart showing the number of answers of teachers for exercise 4.2
Only 12 (8.3%) teachers gave 3 or 4 instructions and notes to help students understand the meaning and correctly determine the mean and median values on bar charts and histograms. However, for the note "Median cannot be determined for categorical variable data on bar charts" needed to solve exercise 1 and the instruction "Median is the value dividing the total area of the columns on the histogram in half" were mentioned by almost no teachers in the KCT knowledge type. A result worth pondering is that up to 46.5% of teachers did not give feedback on exercise 4.2. To explain this result, it can be said that many teachers have not really made an effort in making survey forms or that the knowledge to teach the mean and median values on bar charts and histograms of teachers is still at a low level, which needs to be reviewed and fostered.
Table 5.12. Illustration of GVTTL's response to KCT
Teacher
Illustration of teacher's answer | |
Teacher D51 gave many necessary instructions and notes to teach about average and median through charts. The teacher mentioned comparing the average and median positions on the histogram chart, which few teachers mentioned. which refers to. |
|
Teacher D60 gave 3 notes to students, mentioning the meaning of average and median but not specifically and clearly. |
|
Teacher D08 gave explanations and notes but they were not accurate about how to determine the average. The example given by the teacher did not mention frequency but determined the average and median based on data values, which easily caused students to make the mistake of forgetting to consider frequency when calculating. average, median |
b) The development of future mathematics teachers' knowledge of teaching central tendency characteristic numbers on bar graphs and histograms through lesson study
In the first lesson plan, the teachers did not pay much attention to instructional design, they were only interested in presenting mathematical knowledge without asking how to teach it. However, during the subsequent research process, the researchers found that the teachers made efforts to consolidate their own knowledge for teaching. The teachers were aware of the development of their own teaching knowledge by planning specifically for the lesson being explored. This was reflected in subsequent versions of the lesson plan and in teaching practice. Teacher D47 shared:
“Building a system of expected questions for teachers during the lesson planning process is very necessary. It helps teachers develop their ability to analyze problems, thereby providing expected answers to questions, contributing to forming confidence and initiative when standing in class, making the teaching and learning process more effective.”
In addition, choosing examples related to real-life problems helps the lesson content to be more dynamic, easier for students to understand, and demonstrates the meaning of the knowledge content, making it easier to apply knowledge into practice. The importance of instructional design was reflected by all teachers in the final survey. They also acknowledged the challenges related to their own limited approach and questioning methods.
“For my part, I realized that the ability to ask planned questions during the research process still has many limitations such as not fully grasping the possibilities, the questions are not really good enough for students to be able to solve all the problems. Besides, I have also promoted some strengths such as: asking questions suitable for the teaching object, having many follow-up questions if students cannot answer immediately to give suggestions to students.” - Teacher D61 reflected.
On the other hand, GVTTL also affirmed that their own KCT was also increased thanks to the process of participating in NCBH and the support of researchers.
“The process of NCBH and the support of the lecturers have improved my lesson planning and activity design: I can come up with many options to design lessons for a lesson (suitable for different learners), the amount of knowledge imparted to students is built more logically, guided more reasonably rather than imposing knowledge on them, each lesson needs to have activities to help students remember the lesson and hit the core knowledge of each lesson.” – reflection of GVTTL D40.