suitable jobs but still have difficulty adapting to the new working environment. Therefore, they are very likely to fall into unemployment after land acquisition.
In terms of technical expertise, through the above table, we see that most of the workers have not received technical training, accounting for 75% of the total number of workers, while the number of trained workers is only 25%. Among the trained workers, the majority are intermediate workers, accounting for 69.23%, while university and college graduates account for only 30.77%. This leads to great difficulty in finding jobs as well as new occupations for workers in these groups of households.
For the group of households whose agricultural land area was recovered by over 50%, the survey results of 50 households showed that the education level of the laborers in this group was mainly general, specifically: the number of laborers with junior high school education accounted for 57.53%, the number of laborers with high school education accounted for 30.83% of the total laborers. It is worth noting that the majority of laborers in this group of households have not attended any training courses, accounting for 78.08% of the total laborers, only 21.92% of the laborers have attended training courses, but these laborers are mainly intermediate level, accounting for 65.63%. This is indeed a big barrier, especially for the group of households whose entire cultivated land area was recovered.
For group 2, the group most affected by the land acquisition process, the survey results of 20 households show that: in general, the cultural level and technical expertise of the workers are still at the general level, although the proportion of workers with high school education is higher than other groups (accounting for 41.94%), the proportion of workers with primary education is still high, accounting for 22.58% of the total number of workers. In terms of technical expertise, in this group, up to 67.74% of the workers have not been trained, of the 32.26% of trained workers, up to 70% have intermediate level. This is a major difficulty in changing occupations as well as finding jobs for households and is also the reason why after land acquisition, most workers still keep their old jobs or are unemployed.
80
80
Table 2.9: Cultural and technical qualifications of workers in the surveyed household groups
Target
Household group 1 (n=80) | Group 2 (n=20) | |||||
Households with recovered land < 50% (n=30) | Households with recovered land 50% (n=50) | |||||
SL (people) | Rate (%) | SL (people) | Rate (%) | SL (people) | Rate (%) | |
Total number of employees | 104 | 100 | 146 | 100 | 62 | 100 |
1. Cultural level | ||||||
- Elementary | 10 | 9.62 | 17 | 11.64 | 14 | 22.58 |
- Middle school | 58 | 55.77 | 84 | 57.53 | 22 | 35.48 |
- High school | 36 | 34.61 | 45 | 30.83 | 26 | 41.94 |
2. Technical expertise | ||||||
- Total number of trained employees | 26 | 25.00 | 32 | 21.92 | 20 | 32.26 |
+ Intermediate | 18 | 69.23 | 21 | 65.63 | 14 | 70.00 |
+ College, University | 8 | 30.77 | 11 | 34.37 | 6 | 30.00 |
- Untrained workers | 78 | 75.00 | 114 | 78.08 | 42 | 67.74 |
Maybe you are interested!
-

 Solutions for tourism development in Tien Lang - 10
zt2i3t4l5ee
zt2a3gstourism, tourism development
zt2a3ge
zc2o3n4t5e6n7ts
- District People's Committees and authorities of communes with tourist attractions should support, promote, and provide necessary information to people, helping them improve their knowledge about tourism. Raise tourism awareness for local people.
*
* *
Due to limited knowledge and research time, the thesis inevitably has shortcomings. Therefore, I look forward to receiving guidance from teachers, experts as well as your comments to make the thesis more complete.
Chapter III Conclusion
Through the issues presented in Chapter II, we can come to some conclusions:
Based on the strengths of available tourism resources, the types of tourism in Tien Lang that need to be promoted in the coming time are sightseeing and resort tourism, discovery tourism, weekend tourism. To improve the quality and diversify tourism products, Tien Lang district needs to combine with local cultural tourism resources, at the same time combine with surrounding areas, build rich tourism products. The strengths of Tien Lang tourism are eco-tourism and cultural tourism, so developing Tien Lang tourism must always go hand in hand with restoring and preserving types of cultural tourism resources. Some necessary measures to support and improve the efficiency of exploiting tourism resources in Tien Lang are: strengthening the construction of technical facilities and labor force serving tourism, actively promoting and advertising tourism, and expanding forms of capital mobilization for tourism development.
CONCLUDE
I Conclusion
1. Based on the results achieved within the framework of the thesis's needs, some basic conclusions can be drawn as follows:
Tien Lang is a locality with great potential for tourism development. The relatively abundant cultural tourism resources and ecological tourism resources have great appeal to tourists. Based on this potential, Tien Lang can build a unique tourism industry that is competitive enough with other localities within Hai Phong city and neighboring areas.
In recent years, the exploitation of the advantages of resources to develop tourism and build tourist routes in Tien Lang has not been commensurate with the available potential. In terms of quantity, many resource objects have not been brought into the purpose of tourism development. In terms of time, the regular service time has not been extended to attract more visitors. Infrastructure and technical facilities are still weak. The labor force is still thin and weak in terms of expertise. Tourism programs and routes have not been organized properly, the exploitation content is still monotonous, so it has not attracted many visitors. Although resources have not been mobilized much for tourism development, they are facing the risk of destruction and degradation.
2. Based on the results of investigation, analysis, synthesis, evaluation and selective absorption of research results of related topics, the thesis has proposed a number of necessary solutions to improve the efficiency of exploiting tourism resources in Tien Lang such as: promoting the restoration and conservation of tourism resources, focusing on investment and key exploitation of ecotourism resources, strengthening the construction of infrastructure and tourism workforce. Expanding forms of capital mobilization. In addition, the thesis has built a number of tourist routes of Hai Phong in which Tien Lang tourism resources play an important role.
Exploiting Tien Lang tourism resources for tourism development is currently facing many difficulties. The above measures, if applied synchronously, will likely bring new prospects for the local tourism industry, contributing to making Tien Lang tourism an important economic sector in the district's economic structure.
REFERENCES
1. Nhuan Ha, Trinh Minh Hien, Tran Phuong, Hai Phong - Historical and cultural relics, Hai Phong Publishing House, 1993
2. Hai Phong City History Council, Hai Phong Gazetteer, Hai Phong Publishing House, 1990.
3. Hai Phong City History Council, History of Tien Lang District Party Committee, Hai Phong Publishing House, 1990.
4. Hai Phong City History Council, University of Social Sciences and Humanities, VNU, Hai Phong Place Names Encyclopedia, Hai Phong Publishing House. 2001.
5. Law on Cultural Heritage and documents guiding its implementation, National Political Publishing House, Hanoi, 2003.
6. Tran Duc Thanh, Lecture on Tourism Geography, Faculty of Tourism, University of Social Sciences and Humanities, VNU, 2006
7. Hai Phong Center for Social Sciences and Humanities, Some typical cultural heritages of Hai Phong, Hai Phong Publishing House, 2001
8. Nguyen Ngoc Thao (editor-in-chief, Tourism Geography, Hai Phong Publishing House, two volumes (2001-2002)
9. Nguyen Minh Tue and group of authors, Hai Phong Tourism Geography, Ho Chi Minh City Publishing House, 1997.
10. Nguyen Thanh Son, Hai Phong Tourism Territory Organization, Associate Doctoral Thesis in Geological Geography, Hanoi, 1996.
11. Decision No. 2033/QD – UB on detailed planning of Tien Lang town, Hai Phong city until 2020.
12. Department of Culture, Information, Hai Phong Museum, Hai Phong relics
- National ranked scenic spot, Hai Phong Publishing House, 2005. 13. Tien Lang District People's Committee, Economic Development Planning -
Culture - Society of Tien Lang district to 2010.
14.Website www.HaiPhong.gov.vn
APPENDIX 1
List of national ranked monuments
STT
Name of the monument
Number, year of decisiondetermine
Location
1
Gam Temple
938 VH/QĐ04/08/1992
Cam Khe Village- Toan Thang commune
2
Doc Hau Temple
9381 VH/QĐ04/08/1992
Doc Hau Village –Toan Thang commune
3
Cuu Doi Communal House
3207 VH/QĐDecember 30, 1991
Zone II of townTien Lang
4
Ha Dai Temple
938 VH/QĐ04/08/1992
Ha Dai Village –Tien Thanh commune
APPENDIX II
STT
Name of the monument
Number, year of decision
Location
1
Phu Ke Pagoda Temple
178/QD-UBJanuary 28, 2005
Zone 1 - townTien Lang
2
Trung Lang Temple
178/QD-UBJanuary 28, 2005
Zone 4 – townTien Lang
3
Bao Khanh Pagoda
1900/QD-UBAugust 24, 2006
Nam Tu Village -Kien Thiet commune
4
Bach Da Pagoda
1792/QD-UB11/11/2002
Hung Thang Commune
5
Ngoc Dong Temple
177/QD-UBNovember 27, 2005
Tien Thanh Commune
6
Tomb of Minister TSNhu Van Lan
2848/QD-UBSeptember 19, 2003
Nam Tu Village -Kien Thiet commune
7
Canh Son Stone Temple
2160/QD-UBSeptember 19, 2003
Van Doi Commune –Doan Lap
8
Meiji Temple
2259/QD-UBSeptember 19, 2002
Toan Thang Commune
9
Tien Doi Noi Temple
477/QD-UBSeptember 19, 2005
Doan Lap Commune
10
Tu Doi Temple
177/QD-UBJanuary 28, 2005
Doan Lap Commune
11
Duyen Lao Temple
177/QD-UBJanuary 28, 2005
Tien Minh Commune
12
Dinh Xuan Uc Pagoda
177/QD-UBJanuary 28, 2005
Bac Hung Commune
13
Chu Khe Pagoda
177/QD-UBJanuary 28, 2005
Hung Thang Commune
14
Dong Dinh
2848/QD-UBNovember 21, 2002
Vinh Quang Commune
15
President's Memorial HouseTon Duc Thang
177/QD-UBJanuary 28, 2005
NT Quy Cao
Ha Dai Temple
Ben Vua Temple
Tien Lang hot spring
div.maincontent .p { color: black; font-family:"Times New Roman", serif; font-style: normal; font-weight: normal; text-decoration: none; font-size: 14pt; margin:0pt; } div.maincontent p { color: black; font-family:"Times New Roman", serif; font-style: normal; font-weight: normal; text-decoration: none; font-size: 14pt; margin:0pt; } div.maincontent .s1 { color: black; font-family:"Times New Roman", serif; font-style: normal; font-weight: normal; font-size: 16pt; } div.maincontent .s2 { color: black; font-family:"Times New Roman", serif; font-style: italic; font-weight: bold; text-decoration: none; font-size: 14pt; } div.maincontent .s3 { color: black; font-family:"Times New Roman", serif; font-style: italic; font-weight: normal; text-decoration: none; font-size: 14pt; } div.maincontent .s4 { color: black; font-family:"Times New Roman", serif; font-style: normal; font-weight: normal; font-size: 14pt; } div.maincontent .s5 { color: black; font-family:"Times New Roman", serif; font-style: normal; font-weight: bold; font-size: 14pt; } div.maincontent .s6 { color: black; font-family:"Times New Roman", serif; font-style: normal; font-weight: normal; text-decoration: none; font-size: 14pt; } div.maincontent .s7 { color: black; font-family:"Times New Roman", serif; font-style: normal; font-weight: bold; text-decoration: none; font-size: 14pt; } div.maincontent .s8 { color: black; font-family:"Times New Roman", serif; font-style: normal; font-weight: normal; text-decoration: none; font-size: 9pt; vertical-align: 6pt; } div.maincontent .s9 { color: black; font-family:"Times New Roman", serif; font-style: normal; font-weight: bold; text-decoration: none; font-size: 12pt; } div.maincontent .s11 { color: black; font-family:"Times New Roman", serif; font-style: normal; font-weight: normal; tex
Solutions for tourism development in Tien Lang - 10
zt2i3t4l5ee
zt2a3gstourism, tourism development
zt2a3ge
zc2o3n4t5e6n7ts
- District People's Committees and authorities of communes with tourist attractions should support, promote, and provide necessary information to people, helping them improve their knowledge about tourism. Raise tourism awareness for local people.
*
* *
Due to limited knowledge and research time, the thesis inevitably has shortcomings. Therefore, I look forward to receiving guidance from teachers, experts as well as your comments to make the thesis more complete.
Chapter III Conclusion
Through the issues presented in Chapter II, we can come to some conclusions:
Based on the strengths of available tourism resources, the types of tourism in Tien Lang that need to be promoted in the coming time are sightseeing and resort tourism, discovery tourism, weekend tourism. To improve the quality and diversify tourism products, Tien Lang district needs to combine with local cultural tourism resources, at the same time combine with surrounding areas, build rich tourism products. The strengths of Tien Lang tourism are eco-tourism and cultural tourism, so developing Tien Lang tourism must always go hand in hand with restoring and preserving types of cultural tourism resources. Some necessary measures to support and improve the efficiency of exploiting tourism resources in Tien Lang are: strengthening the construction of technical facilities and labor force serving tourism, actively promoting and advertising tourism, and expanding forms of capital mobilization for tourism development.
CONCLUDE
I Conclusion
1. Based on the results achieved within the framework of the thesis's needs, some basic conclusions can be drawn as follows:
Tien Lang is a locality with great potential for tourism development. The relatively abundant cultural tourism resources and ecological tourism resources have great appeal to tourists. Based on this potential, Tien Lang can build a unique tourism industry that is competitive enough with other localities within Hai Phong city and neighboring areas.
In recent years, the exploitation of the advantages of resources to develop tourism and build tourist routes in Tien Lang has not been commensurate with the available potential. In terms of quantity, many resource objects have not been brought into the purpose of tourism development. In terms of time, the regular service time has not been extended to attract more visitors. Infrastructure and technical facilities are still weak. The labor force is still thin and weak in terms of expertise. Tourism programs and routes have not been organized properly, the exploitation content is still monotonous, so it has not attracted many visitors. Although resources have not been mobilized much for tourism development, they are facing the risk of destruction and degradation.
2. Based on the results of investigation, analysis, synthesis, evaluation and selective absorption of research results of related topics, the thesis has proposed a number of necessary solutions to improve the efficiency of exploiting tourism resources in Tien Lang such as: promoting the restoration and conservation of tourism resources, focusing on investment and key exploitation of ecotourism resources, strengthening the construction of infrastructure and tourism workforce. Expanding forms of capital mobilization. In addition, the thesis has built a number of tourist routes of Hai Phong in which Tien Lang tourism resources play an important role.
Exploiting Tien Lang tourism resources for tourism development is currently facing many difficulties. The above measures, if applied synchronously, will likely bring new prospects for the local tourism industry, contributing to making Tien Lang tourism an important economic sector in the district's economic structure.
REFERENCES
1. Nhuan Ha, Trinh Minh Hien, Tran Phuong, Hai Phong - Historical and cultural relics, Hai Phong Publishing House, 1993
2. Hai Phong City History Council, Hai Phong Gazetteer, Hai Phong Publishing House, 1990.
3. Hai Phong City History Council, History of Tien Lang District Party Committee, Hai Phong Publishing House, 1990.
4. Hai Phong City History Council, University of Social Sciences and Humanities, VNU, Hai Phong Place Names Encyclopedia, Hai Phong Publishing House. 2001.
5. Law on Cultural Heritage and documents guiding its implementation, National Political Publishing House, Hanoi, 2003.
6. Tran Duc Thanh, Lecture on Tourism Geography, Faculty of Tourism, University of Social Sciences and Humanities, VNU, 2006
7. Hai Phong Center for Social Sciences and Humanities, Some typical cultural heritages of Hai Phong, Hai Phong Publishing House, 2001
8. Nguyen Ngoc Thao (editor-in-chief, Tourism Geography, Hai Phong Publishing House, two volumes (2001-2002)
9. Nguyen Minh Tue and group of authors, Hai Phong Tourism Geography, Ho Chi Minh City Publishing House, 1997.
10. Nguyen Thanh Son, Hai Phong Tourism Territory Organization, Associate Doctoral Thesis in Geological Geography, Hanoi, 1996.
11. Decision No. 2033/QD – UB on detailed planning of Tien Lang town, Hai Phong city until 2020.
12. Department of Culture, Information, Hai Phong Museum, Hai Phong relics
- National ranked scenic spot, Hai Phong Publishing House, 2005. 13. Tien Lang District People's Committee, Economic Development Planning -
Culture - Society of Tien Lang district to 2010.
14.Website www.HaiPhong.gov.vn
APPENDIX 1
List of national ranked monuments
STT
Name of the monument
Number, year of decisiondetermine
Location
1
Gam Temple
938 VH/QĐ04/08/1992
Cam Khe Village- Toan Thang commune
2
Doc Hau Temple
9381 VH/QĐ04/08/1992
Doc Hau Village –Toan Thang commune
3
Cuu Doi Communal House
3207 VH/QĐDecember 30, 1991
Zone II of townTien Lang
4
Ha Dai Temple
938 VH/QĐ04/08/1992
Ha Dai Village –Tien Thanh commune
APPENDIX II
STT
Name of the monument
Number, year of decision
Location
1
Phu Ke Pagoda Temple
178/QD-UBJanuary 28, 2005
Zone 1 - townTien Lang
2
Trung Lang Temple
178/QD-UBJanuary 28, 2005
Zone 4 – townTien Lang
3
Bao Khanh Pagoda
1900/QD-UBAugust 24, 2006
Nam Tu Village -Kien Thiet commune
4
Bach Da Pagoda
1792/QD-UB11/11/2002
Hung Thang Commune
5
Ngoc Dong Temple
177/QD-UBNovember 27, 2005
Tien Thanh Commune
6
Tomb of Minister TSNhu Van Lan
2848/QD-UBSeptember 19, 2003
Nam Tu Village -Kien Thiet commune
7
Canh Son Stone Temple
2160/QD-UBSeptember 19, 2003
Van Doi Commune –Doan Lap
8
Meiji Temple
2259/QD-UBSeptember 19, 2002
Toan Thang Commune
9
Tien Doi Noi Temple
477/QD-UBSeptember 19, 2005
Doan Lap Commune
10
Tu Doi Temple
177/QD-UBJanuary 28, 2005
Doan Lap Commune
11
Duyen Lao Temple
177/QD-UBJanuary 28, 2005
Tien Minh Commune
12
Dinh Xuan Uc Pagoda
177/QD-UBJanuary 28, 2005
Bac Hung Commune
13
Chu Khe Pagoda
177/QD-UBJanuary 28, 2005
Hung Thang Commune
14
Dong Dinh
2848/QD-UBNovember 21, 2002
Vinh Quang Commune
15
President's Memorial HouseTon Duc Thang
177/QD-UBJanuary 28, 2005
NT Quy Cao
Ha Dai Temple
Ben Vua Temple
Tien Lang hot spring
div.maincontent .p { color: black; font-family:"Times New Roman", serif; font-style: normal; font-weight: normal; text-decoration: none; font-size: 14pt; margin:0pt; } div.maincontent p { color: black; font-family:"Times New Roman", serif; font-style: normal; font-weight: normal; text-decoration: none; font-size: 14pt; margin:0pt; } div.maincontent .s1 { color: black; font-family:"Times New Roman", serif; font-style: normal; font-weight: normal; font-size: 16pt; } div.maincontent .s2 { color: black; font-family:"Times New Roman", serif; font-style: italic; font-weight: bold; text-decoration: none; font-size: 14pt; } div.maincontent .s3 { color: black; font-family:"Times New Roman", serif; font-style: italic; font-weight: normal; text-decoration: none; font-size: 14pt; } div.maincontent .s4 { color: black; font-family:"Times New Roman", serif; font-style: normal; font-weight: normal; font-size: 14pt; } div.maincontent .s5 { color: black; font-family:"Times New Roman", serif; font-style: normal; font-weight: bold; font-size: 14pt; } div.maincontent .s6 { color: black; font-family:"Times New Roman", serif; font-style: normal; font-weight: normal; text-decoration: none; font-size: 14pt; } div.maincontent .s7 { color: black; font-family:"Times New Roman", serif; font-style: normal; font-weight: bold; text-decoration: none; font-size: 14pt; } div.maincontent .s8 { color: black; font-family:"Times New Roman", serif; font-style: normal; font-weight: normal; text-decoration: none; font-size: 9pt; vertical-align: 6pt; } div.maincontent .s9 { color: black; font-family:"Times New Roman", serif; font-style: normal; font-weight: bold; text-decoration: none; font-size: 12pt; } div.maincontent .s11 { color: black; font-family:"Times New Roman", serif; font-style: normal; font-weight: normal; tex -
 Perfecting flexible salary payment methods for highly skilled technical workers in Vietnam's oil and gas industry - 26
 -
 Training and development of technical workers in textile and garment enterprises in Hanoi - 2
 -
 Concept and Classification of Technical Workers
 -
 Comparison of economic and technical efficiency of snakehead fish farming model in earthen ponds and cage farming model in Hong Ngu district, Dong Thap province - 1

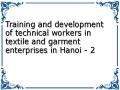
Source: Compiled from 2008 household survey
Rate (%)78.08
80 75 | ||
67.74 | ||
70 | ||
60 | ||
50 | ||
40 32.26 | ||
30 25 21.92 | ||
20 | ||
10 | ||
0 | Household group | |
Households with recovered land < 50% Households with recovered land >= 50% Household group 2 | ||
Trained workers Untrained workers | ||
Chart 2.6: Technical expertise of workers
Thus, through the analysis of the above data, we can see the fact that the cultural level as well as the technical expertise of the laborers in the household groups are still low, not meeting the requirements of the current labor market, which shows that the quality of laborers in the household groups after land recovery is still low. Therefore, to solve the problem of employment, increase income and ensure long-term stability of life for these laborers, we must first pay attention to the issue of improving their qualifications, skills and expertise through training and retraining to suit the requirements of the current labor market.
2.2.2.4 Impact on employment of workers in surveyed households
Most rural people today depend mainly on the sole means of production, land, for their jobs. Therefore, after the land area is recovered, the employment of the people will be affected first. Therefore, to find a reasonable and suitable solution to create jobs, it is necessary to first understand the employment situation of households after land recovery.
Nam Pho Yen Industrial Park is considered a large industrial park with an area of 310 hectares, so after land acquisition, most of the people in the area will be directly affected in terms of employment. To see this impact more clearly, we will examine the employment status of the people through the survey results shown in Table 2.10.
Through the data table, we can see the fluctuations in employment of workers in household groups. In general, after land acquisition, the employment structure of workers fluctuates in the direction of gradually reducing agricultural workers and gradually increasing workers in other fields. However, this fluctuation depends on the nature of each household group, specifically:
In group 1, in general, after land recovery, there was a relatively large change in the employment of workers, but it also varied depending on the proportion of recovered land area. For households with less than 50% of recovered land area, after land recovery, although the proportion of agricultural workers decreased, it was still relatively large. Compared to before recovery, the number of agricultural workers decreased by 18 people. However, the reality is that after losing their land for production, the laborers mainly switch to temporary labor in fields that do not provide high income and lack stability, such as working for hire or doing other jobs during their free time. The survey results show that the number of people working in these two fields is 11 out of a total of 18 people who lost their jobs or were underemployed (accounting for 61.11%), while the rate of people participating in working as workers and other stable jobs is very low, only 7 out of a total of 18 people (accounting for 38.89%). For the group of households with over 50% of the recovered area, this fluctuation is even more obvious. Specifically, the survey results of 50 households show that after land recovery, the rate of agricultural labor decreased by 34 people. If the rate of labor before land recovery is taken as the base, this rate accounts for 36.96%, and at the same time, the rate of labor in other fields also increased accordingly.
But the strongest increase was in hired labor, up to 16 people out of a total of 34 unemployed people, accounting for 47.06%, followed by the number of workers who switched to service business after losing their jobs, with 8 people accounting for 23.53% of the total number of workers who switched from agricultural labor and the number of workers who switched to working as workers was only 6 people accounting for 17.64% of a total of 34 people.
For group 2 households, which are relatively heavily affected by the land acquisition process, the survey results of 20 households show that the proportion of agricultural laborers has decreased relatively sharply, after land acquisition there are only 22 people, accounting for 35.48%, down 29.03% compared to before land acquisition. The proportion of unemployed or unemployed workers after land acquisition mainly shifts to the field of hired labor and labor, accounting for 88.89% of the total number of workers shifting from agriculture.
Through the above analysis, it can be seen that the land acquisition process has a huge impact on the employment of workers in household groups, causing many workers to lose their jobs after losing their production land. On the other hand, after the land acquisition, due to limitations in cultural level as well as professional level, this unemployed labor force mainly turns to hiring and some other jobs to generate additional income. However, these jobs are only temporary and do not bring high and stable income. Therefore, an urgent requirement is to have a suitable vocational training policy to improve the qualifications of workers so that they can find suitable jobs, bringing stable income as well as long-term life for them.
84
Table 2.10: Employment fluctuations of workers in surveyed households
84
Unit: Person
Target
Household group 1 (n=80) | Group 2 (n=20) | |||||||||||
Households with recovered land < 50% (n=30) | Households with recovered land 50% (n=50) | |||||||||||
Before the Conference | After the Conference | Compare | Before the Conference | After the Conference | Compare | Before the Conference | After the Conference | Compare | ||||
Increase (+) | Reduce (-) | Increase (+) | Reduce (-) | Increase (+) | Reduce (-) | |||||||
- Laborer | 67 | 49 | - | 18 | 92 | 58 | - | 34 | 40 | 22 | - | 18 |
- Worker | 12 | 16 | 4 | - | 16 | 22 | 6 | - | 3 | 11 | 8 | - |
- State agency | 4 | 7 | 3 | - | 11 | 11 | 0 | 0 | 5 | 5 | 0 | 0 |
- Laborers do business, DV | 8 | 8 | 0 | 0 | 7 | 15 | 8 | - | 3 | 3 | 0 | 0 |
- Hired labor | 10 | 15 | 5 | - | 14 | 30 | 16 | - | 5 | 13 | 8 | - |
- Other jobs | 3 | 9 | 6 | - | 6 | 10 | 4 | - | 6 | 8 | 2 | - |
Total | 104 | 104 | - | - | 146 | 146 | - | - | 62 | 62 | - | - |
Source: Compiled from 2008 household survey
85
The above data is shown in the following chart.
SL (people) 100
90
80
70
60
50
40
30
20
10
0
Household group
Before the Conference After the Conference Before the Conference After the Conference Before the Conference After the Conference
Households with recovered land <50% Households with recovered land >=50% Household group 2
Foreign labor
Worker
State agency
Laborer in business and service
hired labor
Other jobs
Chart 2.7: Household employment fluctuations
2.2.2.5 Impact on household income
a, Income situation of household groups before and after land acquisition
The recovery of agricultural land has affected the structure of crops, livestock, production orientation, labor structure... Therefore, it also affects household income. Household income includes income from agriculture, service industry and other income. So how has household income changed after the process of recovering agricultural land to build industrial parks? The level of income fluctuation is shown in Table 2.11.
Through the table, we can see that after the land was recovered, in general, the income from agriculture of households decreased sharply, especially the income from cultivation decreased rapidly, thus leading to a decrease in the total income of households, except for the group of households whose agricultural land area was recovered less than 50%, whose income increased compared to before but not significantly, specifically:
86
Table 2.11: Average income structure of surveyed households
86
Unit: Million VND
Target
Household group 1 (n=80) | Group 2 (n=20) | |||||||||||
Households with recovered land < 50% (n=30) | Households with recovered land 50% (n=50) | |||||||||||
Before the Conference | After the Conference | Before the Conference | After the Conference | Before the Conference | After the Conference | |||||||
SL | Rate (%) | SL | Rate (%) | SL | Rate (%) | SL | Rate (%) | SL | Rate (%) | SL | Rate (%) | |
Total TNBQ/household | 40.57 | 100 | 48.82 | 100 | 38.97 | 100 | 36.15 | 100 | 60.17 | 100 | 51.23 | 100 |
1. Revenue from the State | 20.12 | 49.59 | 19.63 | 40.21 | 20.44 | 52.45 | 13.99 | 38.70 | 37.65 | 62.57 | 22.31 | 43.55 |
- Cultivation | 6.89 | 34.24 | 5.18 | 26.39 | 6.44 | 31.51 | 2.28 | 16.30 | 8.81 | 24.04 | 2.91 | 13.04 |
- Animal husbandry | 13.23 | 65.76 | 14.45 | 73.61 | 14.00 | 68.49 | 11.71 | 83.70 | 27.84 | 75.96 | 19.40 | 86.96 |
2. Revenue from business and services | 6.89 | 16.98 | 9.56 | 19.58 | 7.48 | 19.19 | 9.83 | 27.19 | 4.55 | 7.56 | 5.67 | 11.07 |
3. Income from labor salary | 12.17 | 30.00 | 17.23 | 35.29 | 9.16 | 23.51 | 11.09 | 30.68 | 13.76 | 22.87 | 17.52 | 34.20 |
4. Other sources of income | 1.39 | 3.43 | 2.4 | 4.92 | 1.89 | 4.85 | 1.24 | 3.43 | 4.21 | 7.00 | 5.73 | 11.18 |
Source: Compiled from 2008 household survey