LIST OF APPENDIXES
Appendix 1. Banks in the research sample
STT
Symbol | Full name | Stage | Note | |
1 | ABB | An Binh Commercial Joint Stock Bank | 2005-2015 | |
2 | ACB | Asia Commercial Joint Stock Bank | 2005-2015 | |
3 | AGR | Vietnam Bank for Agriculture and Rural Development | 2005-2015 | |
4 | BOARD | Joint Stock Commercial Bank for Industry and Trade | 2005-2015 | |
5 | BID | Joint Stock Commercial Bank for Investment and Development of Vietnam | 2005-2015 | |
6 | CTG | Vietnam Joint Stock Commercial Bank for Industry and Trade | 2005-2015 | |
7 | EAB | Dong A Commercial Joint Stock Bank | 2005-2014 | |
8 | EIB | Vietnam Export Import Commercial Joint Stock Bank | 2005-2015 | |
9 | HDB | Ho Chi Minh City Housing Development Joint Stock Commercial Bank | 2005-2015 | |
10 | KLB | Kien Long Commercial Joint Stock Bank | 2005-2015 | |
11 | LVP | Lien Viet Post Joint Stock Commercial Bank | 2008-2015 | |
12 | MBB | Military Commercial Joint Stock Bank | 2005-2015 | |
13 | MDB | Mekong Development Joint Stock Commercial Bank | 2005-2014 | |
14 | MHB | Mekong Delta Housing Bank | 2005-2014 | Merger in 2015 |
15 | MSB | Maritime Commercial Joint Stock Bank | 2005-2015 | |
16 | NAB | Nam A Commercial Joint Stock Bank | 2005-2015 | |
17 | NSB | North Asia Commercial Joint Stock Bank | 2005-2015 | |
18 | OCB | Orient Commercial Joint Stock Bank | 2005-2015 | |
19 | OEB | Ocean Commercial Joint Stock Bank | 2005-2013 | Renamed to Ocean Commercial Joint Stock Bank |
20 | PGB | Petrolimex Petroleum Joint Stock Commercial Bank | 2005-2015 | |
21 | PVB | Vietnam Public Joint Stock Commercial Bank | 2005-2014 | Previously, NHTMCP West |
22 | PNB | Southern Commercial Joint Stock Bank | 2005-2013 | Merged into Saigon Thuong Tin Commercial Joint Stock Bank 2015 |
Maybe you are interested!
-
 The impact of foreign bank penetration on competition and efficiency of Vietnamese commercial banks - 21
 -
 Testing the credit risk tolerance of Vietnamese commercial banks - Case study of Vietnam Joint Stock Commercial Bank for Industry and Trade - 21
 -
 The influence of factors belonging to bank characteristics on credit risk at Vietnamese commercial banks - 13
 -
 Diversification, efficiency and risk in Vietnamese commercial banks - 20
 -
 Branch management at multinational banks: Experience of Mizuho Corporate Bank, Ltd and lessons for Vietnamese commercial banks - 17
23
SCB | Saigon Commercial Joint Stock Bank | 2005-2015 | ||
24 | SEA | Southeast Asia Commercial Joint Stock Bank | 2005-2015 | |
25 | SGB | Saigon Joint Stock Commercial Bank for Industry and Trade | 2005-2015 | |
26 | SHB | Saigon Hanoi Commercial Joint Stock Bank | 2005-2015 | |
27 | STB | Saigon Thuong Tin Commercial Joint Stock Bank | 2005-2015 | Merger of Phuong Nam Commercial Joint Stock Bank in 2015 |
28 | TCB | Techcombank | 2005-2015 | |
29 | TPB | Tien Phong Commercial Joint Stock Bank | 2008-2015 | |
30 | NCB | National Commercial Joint Stock Bank | 2005-2015 | Formerly South Vietnam |
31 | VAB | Viet A Commercial Joint Stock Bank | 2005-2015 | |
32 | VCB | Joint Stock Commercial Bank for Foreign Trade of Vietnam | 2005-2015 | |
33 | VIB | International Commercial Joint Stock Bank | 2005-2015 | |
34 | VPB | Vietnam Prosperity Joint Stock Commercial Bank | 2005-2015 |
Source: Author's synthesis Typical events related to mergers, consolidations and renaming of commercial banks during the research period include:
On July 27, 2010, the Joint Stock Commercial Bank for Non-State Enterprises changed its name to Vietnam Prosperity Joint Stock Commercial Bank.
On December 15, 2011, 3 joint stock commercial banks: Saigon Commercial Joint Stock Bank, Vietnam Tin Nghia Commercial Joint Stock Bank and De Nhat Commercial Joint Stock Bank merged into Saigon Commercial Joint Stock Bank and officially operated from January 1, 2012.
On October 4, 2013, Western Commercial Joint Stock Bank merged with Vietnam Oil and Gas Finance Joint Stock Corporation to form Vietnam Public Commercial Joint Stock Bank.
On November 23, 2013, Dai A Commercial Joint Stock Bank merged into Ho Chi Minh City Development Commercial Joint Stock Bank.
On January 23, 2014, Nam Viet Commercial Joint Stock Bank officially changed its name to National Commercial Joint Stock Bank.
On March 5, 2015, the State Bank issued Decision 250/QD-NHNN to purchase Construction Joint Stock Commercial Bank for VND0.
On May 6, 2015, the State Bank issued Decision No. 663/QD-NHNN to purchase Ocean Commercial Joint Stock Bank at a price of 0 VND. On May 8, 2015, Ocean Commercial Joint Stock Bank became a one-member limited liability bank and the Vietnam Joint Stock Commercial Bank for Industry and Trade was appointed by the State Bank to manage and operate Ocean Commercial Joint Stock Bank.
On May 25, 2015, MHB merged into BID (after the State Bank issued Document No. 2833/NHNN-TTGSNH dated April 23 on approving in principle and approving the merger in Decision No. 589/QD-NHNN).
On August 12, 2015, Mekong Development Joint Stock Commercial Bank merged into Maritime Commercial Joint Stock Bank (Decision 1391/QD-NHNN of the State Bank dated July 21, 2015, effective from August 12, 2015).
On October 1, 2015, Phuong Nam Commercial Joint Stock Bank merged into Saigon Thuong Tin Commercial Joint Stock Bank.
Appendix 2. Summary of data collection sources of variables
Variable
Data collection sources | ||
Bad debt | NPL | Debt groups 3, 4, 5 are taken from financial statement notes and annual reports. Total outstanding debt is from financial statements. |
Profitability | ROA | Net income from income statement, Total assets from balance sheet |
Cost effective | CE | Calculated from data from financial statements of each bank |
Total assets | TA | Balance sheet of financial statements |
Credit growth rate | LGR | Balance sheet of financial statements |
Equity | ETA | Balance sheet of financial statements |
Outstanding loans/mobilized capital | LDR | Balance sheet of financial statements |
Credit loss provision ratio | LLR | Balance sheet of financial statements |
Share ownership ratio | OWN | Board of Directors Report |
Concentration index of the 4 largest commercial banks | CR4 | Calculated from Total Assets taken from the balance sheet of the financial statement |
Herfindahl-Hirschman index | HHI | Calculated from Total Assets taken from the balance sheet of the financial statement |
Economic growth rate | GDP | International Monetary Fund IFS Database |
Inflationary | INF | International Monetary Fund IFS Database |
Loan interest rate | IR | International Monetary Fund IFS Database |
Exchange rate | EXI | International Monetary Fund IFS Database |
House price growth | ESI | General Statistics Office |
Source: Author's synthesis
Appendix 3. Cost efficiency of Vietnamese commercial banks
1. Concept and classification of efficiency
According to Coelli (2005), an economic unit is said to be more efficient than another unit if it can provide more goods and services to society without using more resources than another unit. In other words, a unit is efficient if it achieves the maximum level of output under the optimal use of given inputs. Technical efficiency is the ability to use the least input to produce a given unit of output or the ability to obtain the greatest output from a given unit of input and the goal of achieving a high level of efficiency is the goal of avoiding waste of the producer.
Coelli (2005) uses different terms for efficiency as follows: Productivity; Technical efficiency; Allocative efficiency; Production frontier; Technical change; Cost efficiency; Scale economies; Total factor productivity and productivity.
- Productivity is measured by the ratio of the output (s) a bank produces to the input (s) it uses. In previous years, the terms productivity and efficiency were often used interchangeably, but they are not exactly the same. To describe the difference between the two terms, consider a simple production process with an input x producing an output y. The OF' curve (Figure 1) is the production frontier that defines the relationship between inputs and outputs, or the line that maximizes the output obtained from using an input. Therefore, it reflects the current technical state of the industry. A firm or bank is technically efficient if it lies above the production frontier, and if it lies below the production frontier, the bank is not technically efficient. Point A is technically inefficient while points B and C are technically efficient.
Point A is not technically efficient because it is technically possible to increase output to the same level as point B without increasing inputs.
- Technical efficiency is the ability to minimize the use of inputs to produce a given output, or the ability to obtain maximum output from a given input, and the goal of avoiding waste of producers becomes the goal of achieving high level of technical efficiency.
- The production frontier is the OF' curve in figure 1.1 used to define the relationship between input and output, or this curve represents the maximization of output obtained from using an input.
Figure 1. Production frontier and technical efficiency
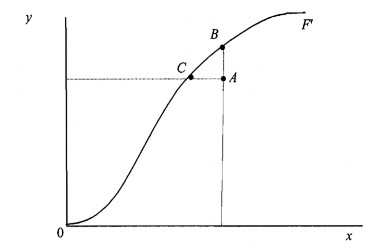
Source: Coelli, T. (2005)
To distinguish between technical efficiency and productivity, we use Figure 1.2. In this figure, we use a line to measure productivity at a particular data point. The slope of this line is y/x, which measures productivity. If the bank operating at point A moves to point B (achieving technical efficiency), the slope of this line will be larger, indicating that point B is more productive. However, if it moves to point C, the line will be tangent to the production frontier, so point C is the maximum production possibility point. The move to point C is an example of scale economies. Point C is
technically optimal scale. Operating at any other point on the production frontier will result in lower productivity.
- Scale economies: From the above analysis, it can be concluded that banks achieve technical efficiency but can still improve productivity by exploiting economies of scale. Changes in the scale of bank operations can be difficult to achieve quickly, technical efficiency and productivity are used to explain in some long-term and short-term cases.
Figure 2. Productivity, technical efficiency and economies of scale
Optimal scale
Source: Coelli (2005)
- Technical change: used to compare productivity over time. In Figure 3, the shift of the production frontier from OF' 0 period 0 to OF' 1 period 1 depicts the change in technical efficiency. At period 1, all banks can produce more output per unit of input than at period 0.
Figure 3. Change in technical efficiency between two periods
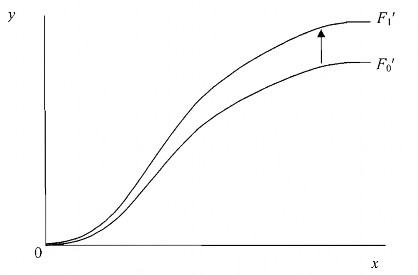
Source: Coelli (2005)
When we observe a bank increasing its productivity over the years, it could be due to improvements in technical efficiency alone, or to improvements in technical efficiency change, or to exploiting economies of scale, or a combination of all three.
- Allocative efficiency: In the previous sections, we did not discuss costs or profits. In addition to technical efficiency, we need to consider allocative efficiency in the case of additional cost information and behavioral assumptions, such as profit maximization and cost minimization. Allocative efficiency is concerned with the choice of inputs (e.g., labor and capital) that produce output at the lowest cost.
- Cost efficiency: Technical efficiency and allocative efficiency combine to create cost efficiency, also known as overall economic efficiency.
- Total factor productivity: used to measure productivity related to all factors of production. Traditional productivity measures are labor productivity in a factory, fuel productivity in a power station, land productivity in a farm, often called individual productivity measures. This measure can lead to incorrect results in overall productivity when only considering separate factors.