Home / 2008 Page 3

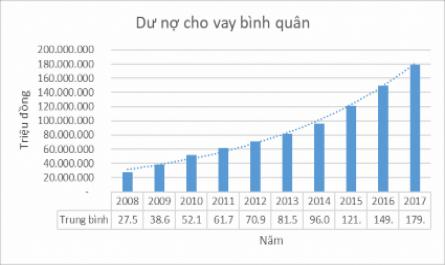
Average Equity Of 24 Banks From 2008-2017

2013 81,545,968 14.99% 384,889,836 BIDV 10,568,462 SGB 107,196,360 2014 96,069,548 17.81% 439,070,127 BIDV 11,139,340 SGB 124,400,565 2015 121,799,891 26.78% 590,917,428 BIDV 11,520,181 SGB 158,546,015 2016 149,327,829 22.60% 713,632,772 BIDV 12,430,861 SGB 191.375.840 2017 179,433,955 20.16% ...

Crop Area and Production From 2000 to 2008

About cultivation: Table 3.2. Crop production area from 2000 to 2008 TT Area, output (whole year) 2000 2005 2006 2007 2008 1 Paddy Annual rice area (ha) 1092 1046 1066 1019 1922 2 Annual rice output (tons) 5287 6319 6027 5748 10142 3 Corn Corn area for the year (ha) 198 238 261 251 436 4 Annual ...

Business Results 2008 – 2011

2.3.4 Guarantee product group Segment customers to apply minimum deposit conditions, credit Specific maximum handicap: Manure group Customer target Group 1 - The customer has a guarantee relationship with VPBank and has liquidated at least 3 guarantees, without having incurred any obligation to pay ...

Home Reference Doccument