RICH AND ACCURATE TOUR INFORMATION
23 | Tour details such as departure date and time, schedule clear presentation, helping you proactively arrange your plans and work a few months in advance. | TTT1 |
24 | The system always has a list of tours available for the whole year. You can choose easily | TTT2 |
25 | Vietravel Tourism Company's online service is good. | TTT3 |
26 | You feel safe with flexible payment methods active for transactions on Vietravel website | TTT4 |
27 | Vietravel Company has rich, flexible and informative tour information. exactly meet customer needs | TTT5 |
Maybe you are interested!
-
 Descriptive Statistics on Banking Service Usage
 -
 Review of service quality of Vung Tau - Con Dao tour at ATZ Travel Company - 2
 -
 Statistics on Internet Banking Service Quality
 -
 Descriptive Statistics of Observed Variables Tangible Media Factor
 -
 Descriptive Statistics of Number of Loans of Families with Student Loans
3.2.2. Formal research step:
This is the quantitative research phase. This quantitative research phase is conducted through direct interviews with customers who have used or are using the services of Vietravel Tourism Company (Official survey form in Appendix 4).
The results of quantitative research are used to re-examine the theoretical model and the initially proposed hypotheses. The process of processing the collected survey forms using SPSS 20.0 software follows these steps:
Descriptive statistics method to analyze the attributes of the research sample Step 1: Descriptive Statistics
Step 2: Test the normal distribution of observed variables for the purpose of regression analysis and ANOVA testing.
Step 3: Test Cronbach's Alpha reliability of the scales
Cronbach's Alpha reliability coefficient test eliminates garbage variables with small Corrected Item - Total Correlation coefficients.
Step 4: Exploratory Factor Analysis (EFA)
- Check the suitability of the survey data set through the KMO parameter (Kaiser – Meyer – Olkin).
- Check factor loading to eliminate factors (i.e. variables) that do not meet requirements.
- Check the extracted factors through Eigenvalue parameter.
- Test the total extracted variance of the factors.
Step 5 : Multiple Regression
- Evaluate the model's suitability through the adjusted coefficient of deterMobile Internetnation
- Testing the suitability of the overall linear regression model
- Test the significance level of the standardized regression coefficient Beta (Standardized Beta Coefficient).
From there, it is possible to check the model's suitability, test hypotheses, and build multiple regression models.
Step 6 : Check the difference
3.3. Research sample design:
This study uses the convenience and random sampling method, the larger the sample size the better. According to Hait & ctg (1998), for exploratory factor analysis (EFA), the best is 5 samples per observed variable. Besides, Tabacnick & Fidel (1996) stated that for the best regression analysis, the sample size must be ensured according to the formula:
n>= 8m + 50
In which: n: is sample size
m: is the number of independent variables of the model
So for this study, there are 5 observed variables and 27 independent variables. The sample size needed for exploratory factor research is: n>= 8*27+50 =266
The sampling method chosen was convenience sampling, data were collected through direct interviews and via email. Specifically as follows:
- Send E-mail: The author sent 100 interview emails to customers who used tourism services at Vietravel Tourism Company. The list of customers that the author approached was a list of regular customers.
Company travel. After sending 100 e-mails, the author received 78 e-mail responses. All 78 responses were valid.
- Direct interviews: The author distributed 250 questionnaires and directly interviewed customers:
+ Random customers come to make transactions at Vietravel agents
+ Customers are in the process of traveling with the Company's tour group
The author interviewed directly the tourist groups where the most diverse customer groups were concentrated. As a result, the author collected 207 questionnaires, the remaining 43 questionnaires were invalid due to incomplete answers, choosing all of one answer or choosing many "Neutral" opinions.
Thus, the author sent out 350 questionnaires, of which 285 questionnaires met the requirements and were used for analysis, while the remaining 65 questionnaires were invalid.
Chapter 3 Conclusion:
Chapter 3 presented the contents of the research process, research design, and research sample design. From there, a set of scales was built based on the original scales of related studies. This is a necessary preparation step to conduct and determine the research results, including analyzing research sample information, evaluating scales, analyzing correlations, and running regression to test the hypotheses proposed in the next chapter.
CHAPTER 4: ANALYSIS OF RESEARCH RESULTS
Chapter 3 presented issues related to research design. The purpose of chapter 4 is to present and evaluate the results after running data using SPSS 20.0 software. This chapter includes 4 main parts: (1) Analysis of research sample,
(2) Verify the scale through Cronbach's Alpha reliability coefficient and evaluate the scale by EFA exploratory factor analysis, (3) Test the hypothesis through regression analysis.
4.1. Analysis of research sample: (Appendix 5)
About gender:
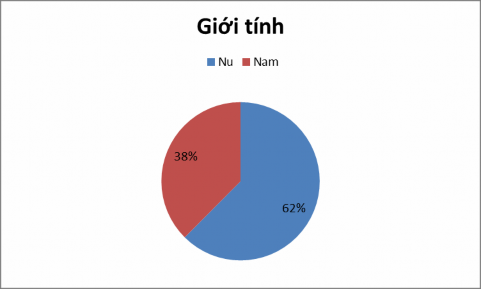
Chart 4.1: Gender
Of the 285 respondents, 107 were male (38%) and 178 were female (62%). There were more females than males in the survey sample.
About age:
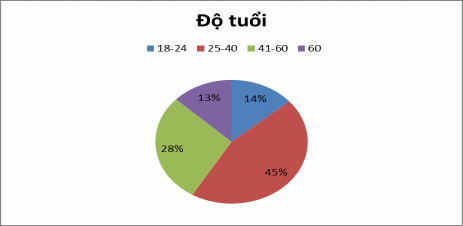
Chart 4.2: Age
Of the 285 people interviewed, 39 were aged 18-24 (13.7%), 128 were aged 25-40 (44.9%), and 81 were aged 41-60 (28.4%). There were 37 people over 60 years old, accounting for 13%. Thus, the proportion of people aged 25-40 was the highest and the proportion of people over 60 years old was the lowest in the total number of people interviewed.
About career:
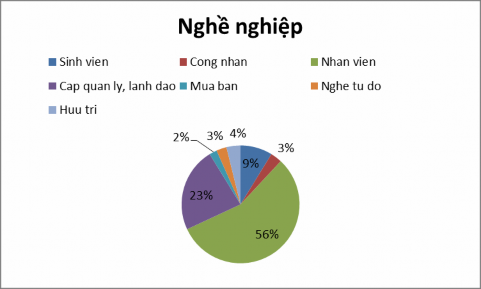
Chart 4.3: Occupation
The company's customers are mostly employees, accounting for 56%; managers and leaders account for 23%; students account for 9%; and retired customers.
accounting for 4%; workers accounting for 3%; freelance customers accounting for 3%, the rest are customers with buying and selling jobs.
On the education level of domestic tourists:
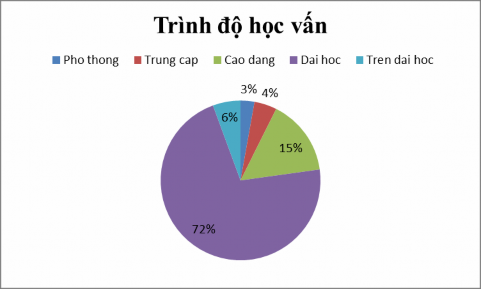
Figure 4.4: Education level of domestic tourists
We see that the majority of the company's customers have university degrees (72%), college degrees (15%), post-graduate degrees (6%), intermediate degrees (4%), and the rest have high school degrees (3%).
From the above results, we can see that the majority of the Company's customers have university, college and post-graduate degrees, which shows that the Company's customers are educated people. Therefore, the Company can choose advertising strategies suitable for this customer group. These customers use information technology very well and have good relationships, so the Company should promote advertising as well as transactions via the Internet and word-of-mouth marketing by strengthening the brand and designing good quality tours, good service and good customer care so that they can introduce the next customers to the Company. This is a very effective and least expensive marketing method. But this is also a feature that helps increase customer satisfaction using Vietravel's tourism services in the market.
About income:
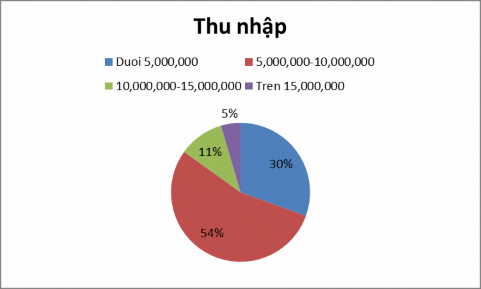
Chart 4.5: Income
We see that the average income of customers from 5 million to 10 million accounts for 54%, under 5 million accounts for 30%, from 10 million to 15 million accounts for 11%, the rest is over 15 million.
5%
Table 4.1: Descriptive statistics When do you usually travel?
When do you usually travel?
Frequency | Percent | Value ratio (%) | Cumulative Percentage (%) | ||
Valid | Weekend | 44 | 15.4 | 15.4 | 15.4 |
Tet | 221 | 77.5 | 77.5 | 93.0 | |
summer | 17 | 6.0 | 6.0 | 98.9 | |
When the whip | 3 | 1.1 | 1.1 | 100.0 | |
Total | 285 | 100.0 | 100.0 | ||
From the results of Table 4.1, it can be seen that out of a total of 285 customers, 221 customers travel during holidays, accounting for 78%, 44 customers travel on weekends, accounting for 15%, 17 customers travel during summer vacation, accounting for 6%. And 3 customers choose to travel when they have free time, accounting for 1%.
Table 4.2: Statistics of reasons why customers choose travel companies?
$GL4 Frequencies
Responses | Value ratio (%) | |||
N | Percent (%) | |||
Liver filter 4a | Cheap tour | 47 | 9.1% | 16.5% |
Good quality | 181 | 35.1% | 63.5% | |
Many types of tours to choose from | 45 | 8.7% | 15.8% | |
Prestigious brand | 218 | 42.3% | 76.5% | |
Rich tour information | 24 | 4.7% | 8.4% | |
Total | 515 | 100.0% | 180.7% | |
a. Group | ||||
Because tourists can give many opinions to this question, the rate exceeds 100%. The results show that tourists choose Vietravel travel company mainly based on brand reputation, accounting for 42.3%. There are 181 opinions of customers choosing the travel company due to good quality, accounting for 35.1%. There are 47 opinions out of 285 customers choosing the company due to cheap tour prices, accounting for 9.1%. There are 45 opinions choosing the company due to many types of tours that are easy to choose, accounting for 8.7%, and 24 opinions choosing the company due to rich tour information, accounting for 4.7%.
Table 4.3: Through which advertising channel did you learn about the company?
$GL5 Frequencies
Responses | Value ratio (%) | |||
N | Percent (%) | |||
Liver filter 5a | TV, radio | 19 | 3.6% | 6.7% |
Pano, poster, banner | 11 | 2.1% | 3.9% | |
Internet | 257 | 49.1% | 90.2% | |
friend | 200 | 38.2% | 70.2% | |
Book, book | 31 | 5.9% | 10.9% | |
Event | 5 | 1.0% | 1.8% | |
Total | 523 | 100.0% | 183.5% | |
a. Group | ||||