Step Size Regression Based on Absolute Value of Gradient
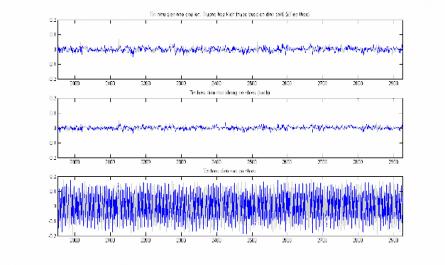
Figure 2.20: EEG before and after noise filtering, segment n 2001 3000 . Figure 2.21: EEG before and after noise filtering, segment n 3001 4000 . Comparison of filtered EEG signal (top) with clean EEG ...