Appendix 11. Crystal Ball results of apartment and land prices calculated according to state prices
Run preferences:
Number of trials run10,000 | |
Extreme speed | |
Monte Carlo | |
Random seed | |
Precision control on | |
Confidence level | 95.00% |
Maybe you are interested!
-

 Improving the effectiveness of office administration at the Office of the People's Council and People's Committee of Loc Binh district, Lang Son province - 1
 -
 Improving the effectiveness of office administration at the Office of the People's Council and People's Committee of Loc Binh district, Lang Son province - 10
 -
 Current Status of Personal Loan Activities at the Transaction Office - An Binh Commercial Joint Stock Bank.
 -
 Evaluation of the quality of lending services for farmers at An Hoa transaction office, branch of the Bank for Agriculture and Rural Development, Huong Tra town, Thua Thien Hue province - 6
 -
 Evaluating customer satisfaction with savings deposit services at National Citizen Commercial Joint Stock Bank NCB Tan Huong Transaction Office - 3
Run statistics:
Total running time (sec) 4.60
Trials/second (average) 2,172
Random numbers per second 2.172
Crystal Ball data:
Assumptions 1
Correlations 0
Correlated groups 0
Decision variables 0
Forecasts 6
Forecasts
Worksheet: [VBH.xls]PtTaichinhThuc_VoiLPhat
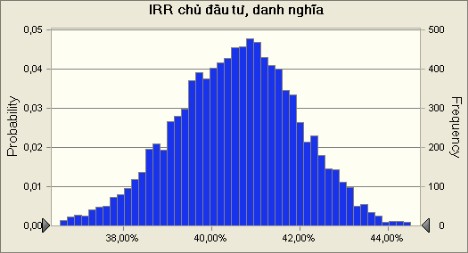
Forecast: Investor IRR, nominal
Summary:
Entire range is from 34.74% to 45.21% Base case is 40.58%
After 10,000 trials, the std. error of the mean is 0.01%
Statistics:
Forecast values
Trials 10,000
Mean 40.53%
Median 40.59%
Mode ---
Standard Deviation 1.42%
Variance 0.02%
Skewness -0.1898
Kurtosis 3.09
Coeff. of Variability 0.0350
Minimum 34.74%
Maximum 45.21%
Range Width 10.48%
Mean Std. Error 0.01%
Forecast: Investor IRR, nominal (cont'd)
Percentiles:
Forecast values
0% 34.74%
10% 38.68%
20% 39.36%
30% 39.80%
40% 40.21%
50% 40.59%
60% 40.93%
70% 41.30%
80% 41.72%
90% 42.32%
100% 45.21%
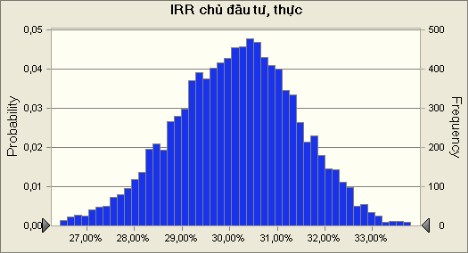
Forecast: Investor IRR, actual
Summary:
Entire range is from 24.75% to 34.46% Base case is 30.17%
After 10,000 trials, the std. error of the mean is 0.01%
Statistics:
Forecast values
Trials 10,000
Mean 30.12%
Median 30.17%
Mode ---
Standard Deviation 1.31%
Variance 0.02%
Skewness -0.1898
Kurtosis 3.09
Coeff. of Variability 0.0436
Minimum 24.75%
Maximum 34.46%
Range Width 9.70%
Mean Std. Error 0.01%
Forecast: Investor IRR, actual (cont'd)
Forecast
Percentiles: values
0% 24.75%
10% 28.41%
20% 29.04%
30% 29.45%
40% 29.83%
50% 30.17%
60% 30.49%
70% 30.83%
80% 31.22%
90% 31.78%
100% 34.46%
Forecast: Project IRR, nominal
Summary:
Entire range is from 30.28% to 39.04% Base case is 35.13%
After 10,000 trials, the std. error of the mean is 0.01%

Statistics:
Forecast values
Trials 10,000
Mean 35.09%
Median 35.14%
Mode ---
Standard Deviation 1.19%
Variance 0.01%
Skewness -0.1766
Kurtosis 3.09
Coeff. of Variability 0.0339
Minimum 30.28%
Maximum 39.04%
Range Width 8.76%
Mean Std. Error 0.01%
Forecast: Project IRR, nominal (cont'd)
Percentiles:
Forecast values
0% 30.28%
10% 33.55%
20% 34.11%
30% 34.49%
40% 34.83%
50% 35.14%
60% 35.43%
70% 35.73%
80% 36.09%
90% 36.59%
100% 39.04%
Forecast: Project IRR, actual
Summary:
Entire range is from 20.6% to 28.7% Base case is 25.1%
After 10,000 trials, the std. error of the mean is 0.0%

Statistics:
Forecast values
Trials 10,000
Mean 25.1%
Median 25.1%
Mode ---
Standard Deviation 1.1%
Variance 0.0%
Skewness -0.1766
Kurtosis 3.09
Coeff. of Variability 0.0439
Minimum 20.6%
Maximum 28.7%
Range Width 8.1%
Mean Std. Error 0.0%
Forecast: Project IRR, actual (cont'd)
Percentiles:
Forecast values
0% 20.6%
10% 23.7%
20% 24.2%
30% 24.5%
40% 24.8%
50% 25.1%
60% 25.4%
70% 25.7%
80% 26.0%
90% 26.5%
100% 28.7%
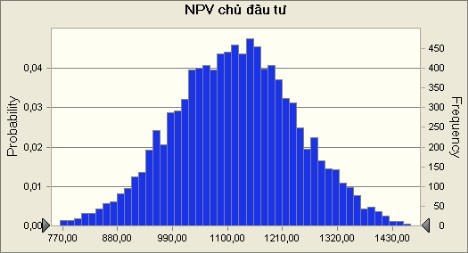
Forecast: Investor NPV
Summary:
Entire range is from 662.42 to 1573.80 Base case is 1116.17
After 10,000 trials, the std. error of the mean is 1.25
Statistics:
Forecast values
Trials 10,000
Mean 1115.84
Median 1116.73
Mode ---
Standard Deviation 125.36
Variance 15714.57
Skewness 0.0097
Kurtosis 3.02
Coeff. of Variability 0.1123
Minimum 662.42
Maximum 1573.80
Range Width 911.39
Mean Std. Error 1.25
Forecast: Investor NPV (cont'd)
Percentiles:
Forecast values | |
0% | 662.42 |
10% | 954.97 |
20% | 1011.03 |
30% | 1048.64 |
40% | 1084.08 |
50% | 1116.70 |
60% | 1147.87 |
70% | 1180.92 |
80% | 1220.18 |
90% | 1277.16 |
100% | 1573.80 |
Forecast: Project NPV
Summary:
Entire range is from 646.88 to 1558.26 Base case is 1100.63
After 10,000 trials, the std. error of the mean is 1.25

Statistics:
Forecast values | ||
Trials | 10,000 | |
Mean | 1100.30 | |
Median | 1101.19 | |
Mode | --- | |
Standard Deviation | 125.36 | |
Variance | 15714.57 | |
Skewness | 0.0097 | |
Kurtosis | 3.02 | |
Coeff. of Variability | 0.1139 | |
Minimum | 646.88 | |
Maximum | 1558.26 | |
Range Width | 911.39 | |
Mean Std. Error | 1.25 | |
Forecast: Project NPV (cont'd) | ||
Percentiles: | Forecast values | |
0% | 646.88 | |
10% | 939.43 | |
20% | 995.49 | |
30% | 1033.10 | |
40% | 1068.54 | |
50% | 1101.16 | |
60% | 1132.33 | |
70% | 1165.38 | |
80% | 1204.64 | |
90% | 1261.62 | |
100% | 1558.26 | |
End of Forecasts | ||
Assumptions | ||
Worksheet: [VBH.xls]PtTaichinhThuc_VoiLPhat | ||
Assumption: USD/m2/month |
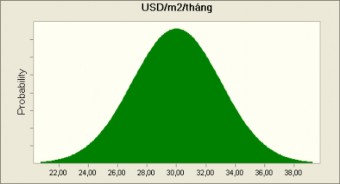
CBRE Q3/2009 Report
Normal distribution with parameters: Mean 30.00
Std. Dev. 3.00
End of Assumptions
Appendix 12. Crystal Ball results for apartment selling price, land price is market price
Run preferences:
Number of trials run10,000 | |
Extreme speed | |
Monte Carlo | |
Random seed | |
Precision control on | |
Confidence level | 95.00% |
Run statistics:
Total running time (sec) 3.32
Trials/second (average) 3.011
Random numbers per second 3.011
Crystal Ball data:
Assumptions 1
Correlations 0
Correlated groups 0
Decision variables 0
Forecasts 6
Forecasts
Worksheet: [VBH.xls]PtTaichinhThuc_VoiLPhat
Forecast: Investor IRR, nominal
Summary:
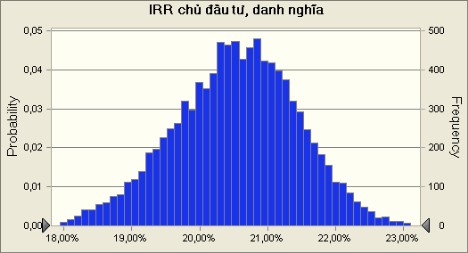
Entire range is from 16.66% to 23.58% Base case is 20.56%
After 10,000 trials, the std. error of the mean is 0.01%