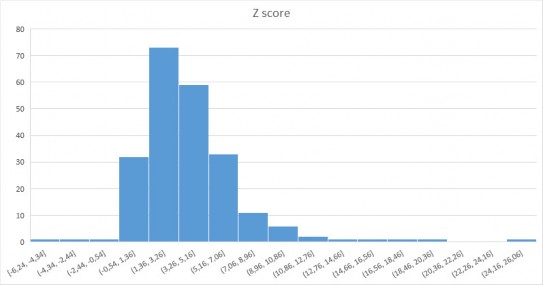
Figure 4.1. Z-score value frequency chart
Figure 4.1 shows that the Z-score values do not have a normal distribution, but tend to be skewed to the right. The Z-score values are concentrated in the range from -0.54 to 7.06. The amplitude of the Z-score index is 31.0 (from -6.24 to 24.76) which is much higher than the model's benchmark (from 1.1 to 2.6), which may raise questions about the suitability of applying the Z-score model to predict bankruptcy of real estate enterprises listed in the Vietnamese market.
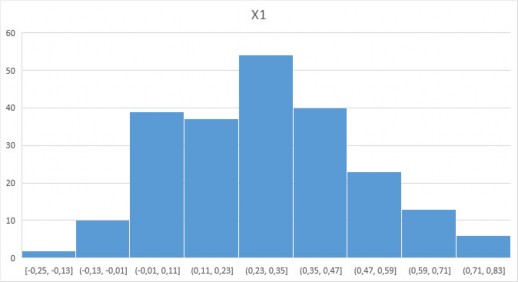
Figure 4.2. X-value frequency histogram 1
Figure 4.2 shows that the X 1 values have a distribution that closely resembles a normal distribution. The X 1 values are concentrated in the range from -0.01 to 0.47.
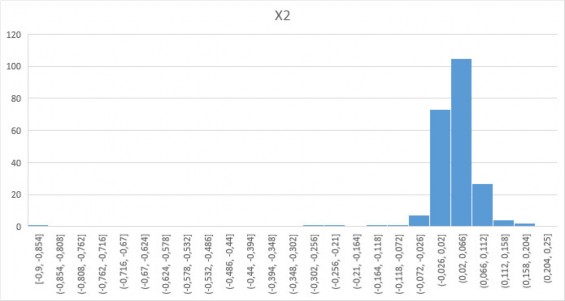
Figure 4.3. X 2 value frequency chart
Figure 4.3 shows that the X 2 values do not have a normal distribution, but tend to be skewed to the left. The X 2 values are concentrated in the range from -0.026 to 0.112.
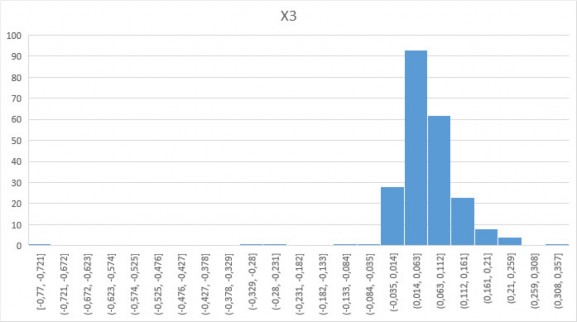
Figure 4.4. X-value frequency chart 3
Figure 4.4 shows that the X 3 values do not have a normal distribution, but tend to be skewed to the left. The X 3 values are concentrated in the range from -0.035 to 0.161.
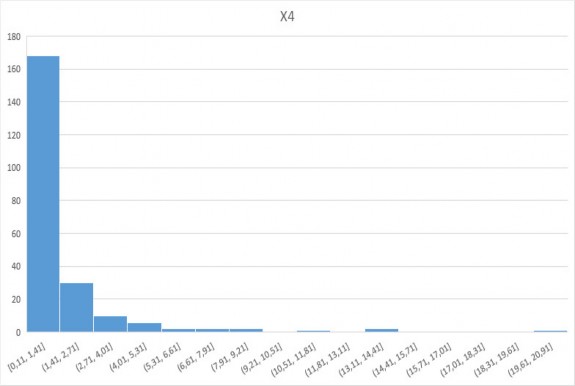
Figure 4.5. X-value frequency chart 4
Figure 4.5 shows that the X 4 values do not have a normal distribution, but tend to be skewed to the right. The X 4 values are concentrated in the range from 0.11 to 2.71.
Table 4.2. Correlation table between Z-score model variables
Variable
Z-score | X 1 | X 2 | X 3 | X 4 | |
Z-score | 1.00 | ||||
X 1 | 0.61 | 1.00 | |||
X 2 | 0.44 | 0.25 | 1.00 | ||
X 3 | 0.51 | 0.28 | 0.92 | 1.00 | |
X 4 | 0.85 | 0.17 | 0.14 | 0.20 | 1.00 |
Maybe you are interested!
-

 The Scope of Entities Entitled to File a Bankruptcy Petition Is Still Too Narrow
 -
 Frequency Distribution of Test Results No. 2
 -
 Relationship Between Gene Frequency and Component Variances
 -
 Average Score of Influencing Factors
 -
![Ui Distances for Determining Z Position Function [13]](https://tailieuthamkhao.com/uploads/2022/05/28/phuong-phap-tinh-toan-kha-nang-chiu-luc-cua-ket-cau-lien-hop-thep-betong-5-1-120x90.gif) Ui Distances for Determining Z Position Function [13]
Ui Distances for Determining Z Position Function [13]
Table 4.2 shows that the Z-score variable is positively correlated and has a relatively strong correlation with variables from X 1 to X 4 . This shows that factors such as working capital, profit and financial leverage all have a great influence on the bankruptcy probability of the enterprise.
On the other hand, most of the correlations between the explanatory variables are weak but individual
The correlation between X 2 and X 3 is very high. This phenomenon can be explained by the fact that X 2 and X 3 have the same denominator, which is total assets, but the only difference is the numerator, which is retained earnings or pre-tax and interest earnings. In addition, the strong positive correlation between X 2 and X 3 raises the question of whether to use both X 2 and X 3 at the same time or whether further research is needed to remove one of these two variables from the model.
4.1.2. H-score model
Table 4.3. Descriptive statistics table of H-score model variables
STT
Variable name | Number of observations | Average value | Standard deviation | Minimum value | Maximum value | |
1 | H-score | 224 | 3.80 | 1.74 | -4.96 | 13.96 |
2 | V 1 | 224 | 0.02 | 0.08 | -0.90 | 0.25 |
3 | V 2 | 224 | 0.27 | 0.20 | 0.00 | 1.01 |
4 | V 3 | 224 | 0.13 | 0.30 | -2.83 | 0.79 |
5 | V 4 | 224 | 0.08 | 0.36 | -1.00 | 2.45 |
6 | V 5 | 224 | 0.51 | 0.19 | 0.05 | 0.84 |
7 | V 6 | 224 | 0.36 | 0.17 | 0.01 | 0.74 |
8 | V 7 | 224 | 12.43 | 0.69 | 10.61 | 14.60 |
9 | V 8 | 224 | 0.83 | 1.22 | -0.61 | 12.29 |
10 | V 9 | 224 | 0.84 | 0.91 | -2.34 | 3.73 |
Table 4.3 shows the descriptive statistics of the explanatory variables V 1 to V 9 and the predictor variable H-score of the model. In which, the variable H-score ranges from -4.96 to 13.96 and has a mean of 3.80 with a standard deviation of 1.74. Variable V 1 ranges from -0.90 to 0.25 and has a mean of 0.02 with a standard deviation of 0.08. Variable V 2 ranges from 0 to 1.01 and has a mean of 0.27 with a standard deviation of 0.2. Variable V 3 ranges from -2.83 to 0.79 and has a mean of 0.13 with a standard deviation of 0.3. Variable V 4 ranges from -1.0 to 2.45 and has a mean of 0.08 with a standard deviation of 0.36. Variable V 5 ranges from 0.05 to 0.84 and has a mean of 0.51 with a standard deviation of
0.19. Variable V 6 ranges from 0.01 to 0.74 and has a mean of 0.36 with a standard deviation of 0.17. Variable V 7 ranges from 10.61 to 14.60 and has a mean of 12.43 with a standard deviation of 0.69. Variable V 8 ranges from
The V 9 variable ranges from -2.34 to 3.73 and has a mean of 0.84 with a standard deviation of 0.91.
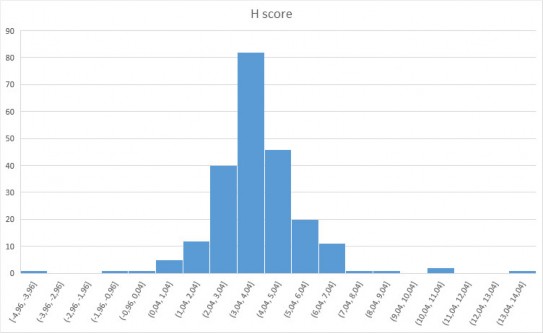
Figure 4.6. Frequency chart of H-score values
Figure 4.6 shows that the H-score values have a distribution shape that closely resembles a normal distribution. The H-score values are concentrated in the range from 2.04 to 6.04 and have 2 values less than 0.
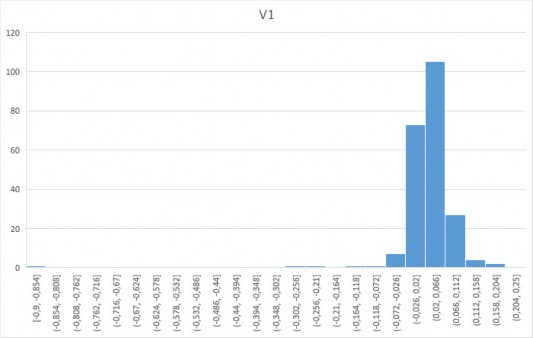
Figure 4.7. Frequency chart of V 1 values
Figure 4.7 shows that the V 1 values do not have a normal distribution, but tend to be skewed to the left. The V 1 values are concentrated in the range from -0.026 to 0.112.
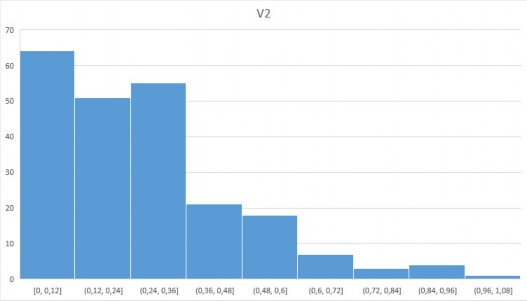
Figure 4.8. Frequency chart of V 2 values
Figure 4.8 shows that the V 2 values do not have a normal distribution, but tend to be skewed to the right. The V 2 values are concentrated in the range from 0 to 0.36.
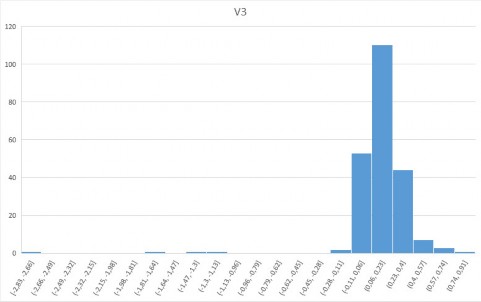
Figure 4.9. Frequency chart of V 3 values
Figure 4.9 shows that the V 3 values do not have a normal distribution, but tend to be skewed to the left. The V 3 values are concentrated in the range from -0.11 to 0.4.
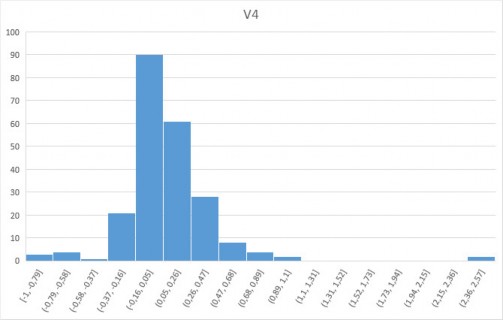
Figure 4.10. Frequency chart of V 4 values
Figure 4.10 shows that the V 4 values do not have a normal distribution, but tend to be skewed to the right. The V 4 values are concentrated in the range from -0.16 to 0.26.
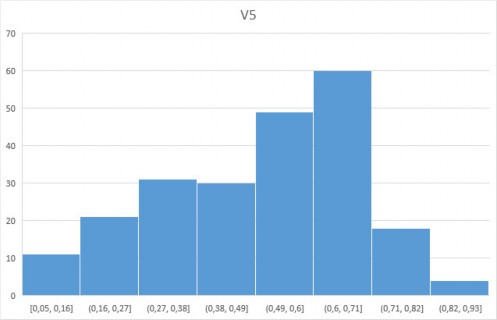
Figure 4.11. Frequency chart of V 5 values
Figure 4.11 shows that the V 5 values do not have a normal distribution, but tend to be skewed to the left. The V 5 values are concentrated in the range from 0.27 to 0.71.
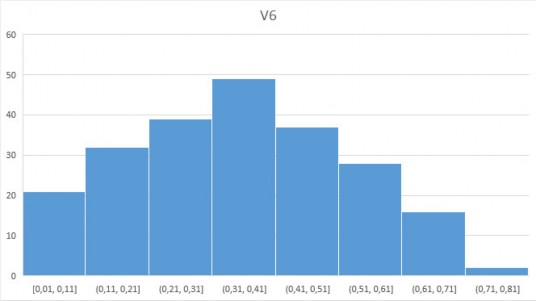
Figure 4.12. V 6 value frequency chart
Figure 4.12 shows that the V 6 values have a distribution that closely resembles a normal distribution. The V 6 values are concentrated in the range from 0.11 to 0.61.