1.2 million USD –
LIBOR + 0.25%
LIBO R
1 million EUR |
Maybe you are interested!
-
 Current Status of Foreign Currency Business Development in the International Market of Vietnamese Commercial Banks
 -
 Advantages and Disadvantages of Swap Contracts in Vietnam
 -
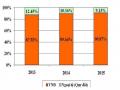 Structure of Mobilized Deposit Sources Classified by Currency Type
 -
 Balancing Supply and Demand of a Country's Currency in the Foreign Exchange Market
 -
 Foreign Currency Demand in the Informal Foreign Exchange Market
USD interest
USD interest
USD interest
USD interest
EUR interest
EUR interest
EUR interest
EUR interest
1.2 million USD | |||||
Present | year 1 | year 2 | year 3 | year 4 | year 5 |
Bank B
Company A
3%
1 million EUR – 3.25%
The actual interest rate the company has to pay is:
LIBOR + 3.25% - (LIBOR + 0.25%) = 3%
The actual interest rate that bank B has to pay is:
3% + LIBOR + 0.25% - 3.25% = LIBOR
Thus, company A has borrowed 1 million EUR with an actual fixed interest rate of 3%/year, avoiding interest rate risk if the LIBOR floating interest rate fluctuates in the market. At the same time, company A can sell 1 million EUR at the present time, collect USD to avoid the risk of EUR devaluation in the next 3 years.
4.3.2. Application of cross-currency contracts for speculation in the foreign exchange market:
a. Situation description :
A speculator A has surplus USD, predicting that in the next 3 years LIBOR interest rates will tend to increase, at the same time EUR will depreciate against USD. The speculator will execute a cross-currency contract to implement his speculative strategy of "selling high, buying low".
b. Steps to follow :
- Step 1 : Speculator A signs a cross-currency swap contract with bank B, in which: speculator A lends bank B 1.2 million USD at a floating interest rate of LIBOR + 0.25%; bank B lends speculator A at a fixed interest rate of 3.25%/year. The swap rate according to the contract is USD/EUR 1.2. Term is 3 years. Interest is paid annually.
1.2 million USD –
LIBOR + 0.25%
Speculator A
1 million EUR – 3.25%
Bank B
- Step 2: predicting that EUR will depreciate in the next 3 years, speculator A signs a 3-year forward contract worth 1 million EUR with a forward exchange rate of USD/EUR 1.15.
- Step 3: At the present time, after swapping the principal loan, speculator A proceeds to sell 1 million EUR on the foreign exchange market. This speculative action causes the EUR to depreciate against the USD.
- Step 4 : At the maturity date, the speculator uses the USD amount received from the swap contract to buy 1 million EUR on the market at the USD/EUR spot rate of only 1.1 (due to speculative behavior, the EUR depreciated sharply).
- Step 5 : The speculator uses the 1 million EUR just purchased to execute a forward contract at the forward exchange rate USD/EUR 1.15, earning the difference of:
1.15 – 1.1 = 0.05 (million USD)
- Suppose that in the next 3 years, the LIBOR interest rate increases as predicted by the speculator. Therefore, speculator A will receive more interest than lending at a fixed interest rate.
Thus, with the strategy of "selling high, buying low", speculator A has earned a profit through swap and forward contracts, and at the same time earned more profit thanks to correctly predicting the trend of increasing LIBOR interest rates.
CHAPTER II . CURRENCY OF CURRENCY SWAP APPLICATION IN THE WORLD AND VIETNAMESE
1. Current status of currency swap application in the world foreign exchange market:
With its own unique characteristics, the foreign exchange market has become the largest trading market in the world with an average daily trading turnover of up to trillions of US dollars.
According to the Bank for International Settlements (BIS) triennial report conducted in December 20076 , the traditional foreign exchange market generally had strong growth periods before the 2007-2009 global financial crisis. From 1992 to 1998, the foreign exchange market grew relatively rapidly. However, the two financial crises that occurred in Asia in 1997-1998 and in Russia in 1998 caused the growth rate of the foreign exchange market to decline by nearly 20% during the period.
from 1998-2001. But by 2001, the foreign exchange market began to recover. In particular, the average daily turnover growth rate in the period 2004-2007 was up to 69%, reaching 3.2 trillion USD in 2007, increasing faster than the period 2001-2004 with only 58% (Chart 2).
6 Triennial Central Bank Survey, 2007, “ Foreign exchange and derivatives market activity in 2007 ”
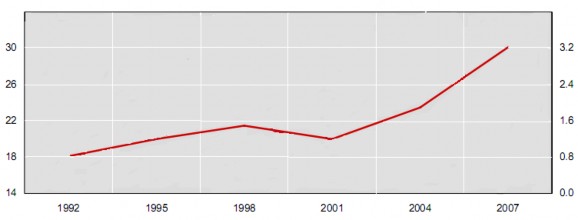
(Source: The Bank for International Settlements' triennial report, conducted on
December 2007)
Figure 2. Average daily turnover of the foreign exchange market from July 1992–July 2007
Among them, foreign exchange swaps have a particularly strong growth rate, contributing the most to the growth of foreign exchange market revenue. Specifically, in the period 2001-2004, the average daily growth rate of foreign exchange swaps was only 45%, but 3 years later it reached 80%, reaching more than 1.7 trillion USD as of July 2007. This is in contrast to what happened in the period 2001-2004, when the growth of foreign exchange swaps was much lower than the growth of spot and forward transactions. (Table 1)
1992 | 1995 | 1998 | 2001 | 2004 | 2007 | |
Immediate delivery | 394 | 494 | 568 | 387 | 631 | 1,005 |
Term | 58 | 7 | 128 | 131 | 209 | 362 |
Under 7 days | … | 50 | 65 | 51 | 92 | 154 |
Over 7 days | … | 46 | 62 | 80 | 116 | 208 |
Forex Swap | 324 | 546 | 734 | 656 | 954 | 1,714 |
Under 7 days | … | 382 | 528 | 451 | 700 | 1,329 |
Over 7 days | … | 162 | 202 | 204 | 252 | 382 |
Other transactions | 44 | 53 | 60 | 26 | 106 | 129 |
Total revenue | 820 | 1,190 | 1,490 | 1,200 | 1,900 | 3,210 |
(Source: The Bank for International Settlements' Triennial Report, conducted in December 2007)
Table 1. Average turnover in the world foreign exchange market from July 1992 to July 2007
Unit: billion US dollars
Compared to other foreign exchange derivatives , foreign exchange swaps are the most widely used with an average daily turnover of over US$1.7 trillion, accounting for nearly 74% of the turnover of foreign exchange derivatives (over US$2.3 trillion in 2007) (Table 2).
1998 | 2001 | 2004 | 2007 | |
Foreign exchange revenue | 959 | 853 | 1,303 | 2,319 |
Foreign exchange forwards and swaps | 862 | 786 | 1,163 | 2,076 |
Currency swap | 10 | 7 | 21 | 32 |
Options | 87 | 60 | 117 | 212 |
Other transactions | 0 | 0 | 2 | 0 |
Interest revenue 7 | 265 | 489 | 1,025 | 1,686 |
FRAs | 74 | 129 | 233 | 258 |
Swap | 155 | 331 | 621 | 1,210 |
Options | 36 | 29 | 171 | 215 |
Other transactions | 0 | 0 | 0 | 1 |
Other revenue | 39 | 43 | 92 | 193 |
Total revenue | 1,265 | 1,385 | 2,420 | 4,198 |
(Source: The Bank for International Settlements' triennial report, conducted on
December 2007 )
Table 2. Average daily turnover in the OTC derivatives market from July 1998–July 2007
7 Includes only interest rate contracts involving a single currency
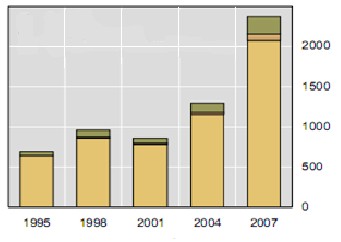
Cross Currency Swap Options Forwards and FX Swaps
(Source: The Bank for International Settlements' triennial report, conducted on
December 2007)
Figure 3. Revenue in the OTC derivatives market from 1995-2007
Unit: billion US dollars
In addition, the average daily turnover of cross-currency swaps also increased by 52% from 21 billion USD in 2004 to 32 billion USD in 2007, although it only accounted for 1.4% of the average total turnover of foreign exchange derivatives (Chart 4). If we consider the indicator: the volume of principal traded (notional amount), cross-currency swap contracts also account for a significant proportion, nearly 25% with more than 14 trillion USD in 2007. In contrast, foreign exchange swaps and forwards only account for nearly 52% of the total principal traded, which is relatively smaller when compared to the turnover ratio (more than 90%). The different nature of the maturity of each type of contract has led to the opposite results between the indicators (revenue growth and volume of principal traded). Foreign exchange swaps have shorter maturities (usually just 1 week), while cross-currency swaps are long-term contracts (Table 3).
End of June 2004 | End of June 2007 | |
Foreign exchange contracts | 31,500 | 57,597 |
Foreign exchange forwards and swaps | 16,764 | 29,771 |
Currency swap | 7,939 | 14,127 |
Options | 6,789 | 13,662 |
Other transactions | 8 | 37 |
Source: The Bank for International Settlements' triennial report, conducted on
December 2007)
Table 3. Volume of principal amount traded on the OTC derivatives market at the end of June 2004 and June 2007
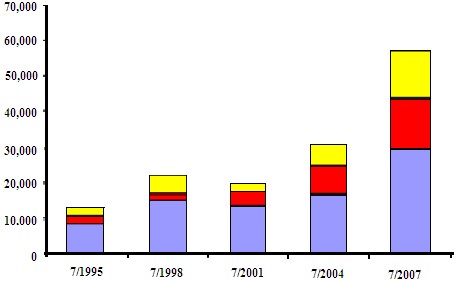
Cross Currency Swap Options Foreign Exchange and Forward Swaps
(Source: Bank for International Settlements)
Chart 4. Principal volume of foreign exchange derivatives traded in the OTC market from July 1995 - July 2007
Unit: billion US dollars
However, foreign exchange swap activities only take place mainly in developed countries and financial centers of the world. As at the time