Descriptive Statistics: Day 14
NN* Mean SE Mean StDev | CoefVar Minimum Q1 Median | |||
14th DC | 30 0 236.50 4.15 22.72 | 9.61 194.50 221.55 236.60 | ||
TN | 1 30 0 239.54 | 4.13 22.60 | 9.43 190.50 | 223.50 237.20 |
TN | 2 30 0 243.74 | 6.07 33.23 | 13.63 191.00 | 226.00 238.50 |
TN | 3 30 0 242.23 | 3.49 19.10 | 7.88 218.90 | 226.38 238.80 |
Maybe you are interested!
-
 Changes in Brown Planthopper Density on Planthopper Resistant Rice Varieties in Phu Vang in Summer-Autumn Crop 2011
 -
 Chemical Composition, Nutritional Value of Brown Rice
 -
 Research on variety selection and technical measures for cultivating Zea mays l. corn on converted rice land in Long An and Dong Thap provinces - 1
 -
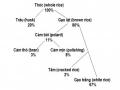
 Chemical Composition of Rice (Calculated as a % of 100g of Rice)
 -
 Current Status of Cultivation and Some Major Obstacles in Corn Production on Rice Land in the Mekong Delta

One-way ANOVA: Day 14 versus Lot
Grouping Information Using Tukey Method
Lot N Mean Grouping TN 2 30 243.74 A
TN 3 30 242.23 A
TN 1 30 239.54 A
DC 30 236.50 A
Descriptive Statistics: Day 24
NN* Mean SE Mean StDev | CoefVar Minimum | Q1 Median | |||
24th DC | 30 0 233.06 4.13 22.62 | 9.71 190.00 | 218.58 234.15 | ||
TN | 1 30 0 239.63 | 4.27 23.38 | 9.76 187.90 | 226.35 234.25 | |
TN | 2 30 0 241.63 | 5.83 31.90 | 13.20 190.00 | 220.95 239.35 | |
TN | 3 30 0 242.17 | 3.45 18.91 | 7.81 214.50 | 224.30 240.55 | |
One-way ANOVA: Day 24 versus Lot
Grouping Information Using Tukey Method Plot N Mean Grouping
TN 3 30 242.17 A
TN 2 30 241.63 A
TN 1 30 239.63 A
DC 30 233.06 A
2. Feed intake of experimental sows
2.1. First experiment
Descriptive Statistics: TB TUAN 1
Lot | NN* Mean SE Mean StDev | Minimum | Q1 Median | |
WEEK 1 | Address | 10 0 5.149 0.102 0.323 | 4,671 | 4,900 5,143 |
TN | 1 10 0 4.603 0.107 0.339 | 4,214 | 4,343 4,521 | |
TN | 2 10 0 4.3943 0.0802 0.2537 | 4.0714 | 4.1286 4.4143 | |
TN | 3 10 0 4.6343 0.0725 0.2292 | 4.0857 | 4.5750 4.6714 |
One-way ANOVA: TB TUAN 1 versus Lot
Grouping Information Using Tukey Method
Lot N Mean Grouping DC 10 5.1486 A
TN 3 10 4.6343 B
TN 1 10 4.6029 B
TN 2 10 4.3943 B
Descriptive Statistics: TB TUAN 2
Lot | Mean | SE Mean | StDev | Minimum | Maximum | |
Week 2 | Address | 7,656 | 0.110 | 0.348 | 7,029 | 8,086 |
TN | 1 6,521 | 0.333 | 1,054 | 4,914 | 8,529 | |
TN | 2 6,490 | 0.340 | 1,075 | 4,929 | 8,443 | |
TN | 3 7.4214 | 0.0829 | 0.2621 | 6.8714 | 7.7571 |
One-way ANOVA: TB TUAN 2 versus Lot
Grouping Information Using Tukey Method
Lot N Mean Grouping DC 10 7.6557 A
TN 3 10 7.4214 AB
TN 1 10 6.5214 B
TN 2 10 6.4900 B
Descriptive Statistics: TB TUAN 3
Lot | Mean SE Mean StDev Minimum | Maximum | ||
WEEK 3 | Address | 8.129 0.153 0.483 7.343 | 8,829 | |
TN | 1 7,546 | 0.328 1.038 | 5,871 | 9,443 |
TN | 2 7,497 | 0.266 0.841 | 6,186 | 8,929 |
TN | 3 8.3100 | 0.0679 0.2147 | 7.8143 | 8.5714 |
One-way ANOVA: TB TUAN 3 versus Lo
Grouping Information Using Tukey Method
N | Mean Grouping | |
TN | 3 10 | 8.3100 A |
Address | 10 | 8.1286 A |
TN | 1 10 | 7.5457 A |
TN | 2 10 | 7.4971 A |
Descriptive Statistics: Average 24 DAYS
Mean SE Mean | StDev Minimum | Maximum | |||
24 DAYS | 7.0129 0.0914 | 0.2891 6.5625 | 7.5708 | ||
TN | 1 6,425 | 0.259 | 0.817 | 5,421 | 8,071 |
TN | 2 6,370 | 0.185 | 0.586 | 5,446 | 7,508 |
TN | 3 6.9758 | 0.0512 | 0.1619 | 6.6625 | 7.2125 |
One-way ANOVA: Mean 24 DAYS versus Lot
Grouping Information Using Tukey Method
Lot N Mean Grouping DC 10 7.0129 A
TN 3 10 6.9758 AB
TN 1 10 6.4246 AB
TN 2 10 6.3700 B
2.2. Second experiment
Descriptive Statistics: TB TUAN 1
Lot | Mean SE Mean | StDev Minimum Maximum | |||
WEEK 1 | Address | 4.5671 0.0584 | 0.1848 4.3000 4.8143 | ||
TN | 1 4,136 | 0.123 | 0.390 | 3,614 | 4,729 |
TN | 2 4.3171 | 0.0913 | 0.2889 | 3.8857 | 4.6857 |
TN | 3 4,580 | 0.121 | 0.384 | 3,657 | 4,886 |
One-way ANOVA: TB TUAN 1 versus Lot
Grouping Information Using Tukey Method
Lot N Mean Grouping TN 3 10 4.5800 A
DC 10 4.5671 A
TN 2 10 4.3171 AB
TN 1 10 4.1357 B
Descriptive Statistics: TB TUAN 2
Lot | Mean SE Mean StDev Minimum | Maximum | ||
Week 2 | Address | 6.764 0.106 0.335 5.986 | 7,071 | |
TN | 1 6,469 | 0.143 0.451 | 5,571 | 6,971 |
TN | 2 6.5243 | 0.0746 0.2358 | 6.1857 | 6.9286 |
TN | 3 6.8171 | 0.0747 0.2361 | 6.4571 | 7.2857 |
One-way ANOVA: TB TUAN 2 versus Lot
Grouping Information Using Tukey Method
N | Mean Grouping | |
TN | 3 10 | 6.8171 A |
Address | 10 | 6.7643 A |
TN | 2 10 | 6.5243 A |
TN | 1 10 | 6.4686 A |
Descriptive Statistics: TB TUAN 3
Lot | Mean SE Mean StDev Minimum | Maximum | |
WEEK 3 | Address | 7.360 0.287 0.909 5.314 | 8,100 |
TN | 1 7.820 0.225 0.710 6.629 | 8,757 | |
TN | 2 8.066 0.163 0.516 7.157 | 8,614 | |
TN | 3 8.061 0.131 0.415 7.357 | 8,557 |
One-way ANOVA: TB TUAN 3 versus Lo
Grouping Information Using Tukey Method
Lot N Mean Grouping TN 2 10 8.0657 A
TN 3 10 8.0614 A
TN 1 10 7.8200 A
DC 10 7.3600 A
Descriptive Statistics: Average 24 DAYS
Mean SE Mean StDev Minimum | Maximum | |||
24 DAYS | 6.414 0.145 0.458 5.579 | 6,950 | ||
TN | 1 6,428 | 0.187 0.591 | 5,450 | 7,267 |
TN | 2 6.6138 | 0.0761 0.2407 | 6.1917 | 6.9708 |
TN | 3 6.7962 | 0.0703 0.2223 | 6.3917 | 7.1583 |
One-way ANOVA: Mean 24 DAYS versus Lot
Grouping Information Using Tukey Method
Lot N Mean Grouping TN 3 10 6.7962 A
TN 2 10 6.6138 A
TN 1 10 6.4275 A
DC 10 6.4138 A
2.3. Third experiment
Descriptive Statistics: TB TUAN 1
Lot | Mean SE Mean StDev Minimum | Maximum | |
WEEK 1 | Address | 4.8871 0.0913 0.2886 4.3714 | 5.2714 |
TN | 1 4.7271 0.0421 0.1331 4.5000 | 4.9571 | |
TN | 2 4.4971 0.0412 0.1302 4.2429 | 4.7000 | |
TN | 3 4.8286 0.0570 0.1803 4.5000 | 5.0429 |
One-way ANOVA: TB TUAN 1 versus Lot
Grouping Information Using Tukey Method
Lot N Mean Grouping DC 10 4.8871 A
TN 3 10 4.8286 A
TN 1 10 4.7271 AB
TN 2 10 4.4971 B
Descriptive Statistics: TB TUAN 2
Lot | Mean SE Mean StDev Minimum | Maximum | |
Week 2 | Address | 7.2043 0.0546 0.1728 6.8429 | 7.5000 |
TN | 1 6.7214 0.0434 0.1372 6.5429 | 6.9143 | |
TN | 2 6.6314 0.0740 0.2340 6.0429 | 6.8571 | |
TN | 3 7.2814 0.0432 0.1365 7.1286 | 7.6429 |
One-way ANOVA: TB TUAN 2 versus Lot
Grouping Information Using Tukey Method
N | Mean Grouping | |
TN | 3 10 | 7.2814 A |
Address | 10 | 7.2043 A |
TN | 1 10 | 6.7214 B |
TN | 2 10 | 6.6314 B |
Descriptive Statistics: TB TUAN 3
Lot | Mean SE Mean StDev Minimum | Maximum | |
WEEK 3 | Address | 8.0871 0.0689 0.2180 7.6143 | 8.2714 |
TN | 1 8.1786 0.0600 0.1897 7.9143 | 8.5857 | |
TN | 2 7.8500 0.0367 0.1161 7.7143 | 8.0857 | |
TN | 3 8.3114 0.0839 0.2652 7.6714 | 8.7143 |
One-way ANOVA: TB TUAN 3 versus Lo
Grouping Information Using Tukey Method
Lot N Mean Grouping TN 3 10 8.3114 A
TN 1 10 8.1786 A
Address 10 8.0871 AB
TN 2 10 7.8500 B
Descriptive Statistics: Average 24 DAYS
Variable LotMean SE Mean StDev Minimum Maximum | |
24 DAYS | 6.8783 0.0233 0.0737 6.7833 7.0292 |
TN | 1 6.7863 0.0292 0.0924 6.6417 6.8833 |
TN | 2 6.5904 0.0324 0.1024 6.4083 6.7250 |
TN | 3 7.0508 0.0514 0.1624 6.7125 7.3292 |
One-way ANOVA: Mean 24 DAYS versus Lot
Grouping Information Using Tukey Method
N | Mean Grouping | |
TN | 3 10 | 7.0508 A |
Address | 10 | 6.8783 B |
TN | 1 10 | 6.7863 B |
TN | 2 10 | 6.5904 C |
2.4. All 3 experiments
Descriptive Statistics: TB TUAN 1
Lot | Mean SE Mean StDev Minimum | Maximum | ||
WEEK 1 | Address | 4.8676 0.0652 0.3569 4.3000 | 5.7571 | |
TN | 1 4.4886 0.0719 0.3941 | 3.6143 | 5.3143 | |
TN | 2 4.4029 0.0435 0.2382 | 3.8857 | 4.8286 | |
TN | 3 4.6810 0.0529 0.2898 | 3.6571 | 5.0429 | |
One-way ANOVA: TB TUAN 1 versus Lot
Grouping Information Using Tukey Method
Lot N Mean Grouping DC 30 4.8676 A
TN 3 30 4.6810 AB
TN 1 30 4.4886 BC
TN 2 30 4.4029 C
Descriptive Statistics: TB TUAN 2
Lot | Mean | SE Mean | StDev | Minimum | Maximum | |
Week 2 | Address | 7.2081 | 0.0854 | 0.4675 | 5.9857 | 8.0857 |
TN | 1 6,570 | 0.119 | 0.653 | 4,914 | 8,529 | |
TN | 2 6,549 | 0.115 | 0.630 | 4,929 | 8,443 | |
TN | 3 7.1733 | 0.0615 | 0.3368 | 6.4571 | 7.7571 |
One-way ANOVA: TB TUAN 2 versus Lot
Grouping Information Using Tukey Method
N Mean | Grouping | |
Address | 30 7.2081 | A |
TN | 3 30 7.1733 | A |
TN | 1 30 6.5705 | B |
TN | 2 30 6.5486 | B |
Descriptive Statistics: TB TUAN 3
Mean SE Mean StDev Minimum | Maximum | |
Week 3 | 7.859 0.125 0.687 5.314 | 8,829 |
TN | 1 7.848 0.138 0.756 5.871 | 9,443 |
TN | 2 7.804 0.110 0.603 6.186 | 8,929 |
One-way ANOVA: TB TUAN 3 versus Lo
Grouping Information Using Tukey Method
N | Mean Grouping | |
TN | 3 30 | 8.2276 A |
Address | 30 | 7.8586 AB |
TN | 1 30 | 7.8481 AB |
TN | 2 30 | 7.8043 B |
Descriptive Statistics: Average 24 DAYS
Mean SE Mean | StDev Minimum Maximum | ||||
24 DAYS | 6.7683 0.0732 | 0.4011 5.5792 7.5708 | |||
TN | 1 6,546 | 0.108 | 0.590 | 5,421 | 8,071 |
TN | 2 6.5247 | 0.0684 | 0.3747 | 5.4458 | 7.5083 |
TN | 3 6.9410 | 0.0381 | 0.2085 | 6.3917 | 7.3292 |
One-way ANOVA: Mean 24 DAYS versus Lot
Grouping Information Using Tukey Method
N | Mean Grouping | |
TN | 3 30 | 6.9410 A |
Address | 30 | 6.7683 AB |
TN | 1 30 | 6.5461 B |
TN | 2 30 | 6.5247 B |
3. Time of return of estrus of sows after weaning
3.1. First experiment
Descriptive Statistics: Time to first return to estrus
NN* Mean SE Mean StDev Minimum | Q1 | ||
Right up to the storm 1 DC | 10 0 4.630 0.237 0.748 3.800 | 3,975 | |
TN | 1 10 0 4.190 0.196 0.621 | 3,400 | 3,725 |
TN | 2 10 0 3.590 0.164 0.520 | 3,000 | 3,075 |
TN | 3 10 0 3.160 0.107 0.337 | 2,600 | 2,875 |
One-way ANOVA: Time to first return to estrus
Grouping Information Using Tukey Method
N | Mean Grouping | |
Address | 10 | 4.6300 A |
TN | 1 10 | 4.1900 AB |
TN | 2 10 | 3.5900 BC |
TN | 3 10 | 3.1600 C |
3.2. Second experiment
Descriptive Statistics: Time to 2nd return to estrus
NN* | Mean | SE Mean StDev | Minimum | Q1 | |
Right up to the storm 2 DC | 10 0 | 5,060 | 0.232 0.735 | 3,900 | 4,450 |
TN | 1 10 0 | 4.210 | 0.205 0.647 | 3,300 | 3,500 |
TN | 2 10 0 | 3,720 | 0.151 0.478 | 3,000 | 3.275 |
TN | 3 10 0 | 3.2500 | 0.0872 0.2759 | 2.9000 | 2.9750 |
One-way ANOVA: Time to return to estrus 2 versus Lot
Grouping Information Using Tukey Method
N | Mean Grouping | |
Address | 10 | 5.0600 A |
TN | 1 10 | 4.2100 B |
TN | 2 10 | 3.7200 BC |
TN | 3 10 | 3.2500 C |
3.3. Third experiment
Descriptive Statistics: Time to 3rd return to heat
NN* | Mean SE Mean | StDev Minimum | Q1 | |
Right up to the storm 3 DC | 10 0 | 4.680 0.227 | 0.718 3.800 | 4,150 |
TN | 1 10 0 | 4.400 0.235 | 0.744 3.300 | 3.475 |
TN | 2 10 0 | 3.740 0.138 | 0.435 3.000 | 3,400 |
TN | 3 10 0 | 3.1700 0.0870 | 0.2751 2.8000 | 2.8750 |
One-way ANOVA: Time to return to estrus 3 versus Lot
Grouping Information Using Tukey Method
N | Mean Grouping | |
Address | 10 | 4.6800 A |
TN | 1 10 | 4.4000 AB |
TN | 2 10 | 3.7400 BC |
TN | 3 10 | 3.1700 C |
3.4. All 3 experiments
Descriptive Statistics: Time to return to estrus 3 times
NN* | Mean | SE Mean StDev | Minimum | Q1 Median | |
Right up to the storm DC | 30 0 | 4,790 | 0.134 0.735 | 3,800 | 4,200 4,650 |
TN | 1 30 0 | 4,267 | 0.120 0.656 | 3,300 | 3,500 4,400 |
TN | 2 30 0 | 3.6833 | 0.0852 0.4669 | 3.0000 | 3.3000 3.5000 |
TN | 3 30 0 | 3.1933 | 0.0529 0.2900 | 2.6000 | 2.9000 3.2000 |
One-way ANOVA: Time to return to estrus 3 times versus Lot
Grouping Information Using Tukey Method
N | Mean Grouping | |
Address | 30 | 4.7900 A |
TN | 1 30 | 4.2667 B |
TN | 2 30 | 3.6833 C |
TN | 3 30 | 3.1933 D |
4. Data of piglets following the experimental sow
4.1. Weight of piglets according to mother
4.1.1. Experiment 1
Descriptive Statistics: Day 1
NN* Mean SE Mean StDev CoefVar | Minimum Q1 | ||
Day 1 DC | 10 0 1.5809 0.00762 0.0241 1.52 | 1.5308 1.5646 | |
TN | 1 10 0 1.5669 0.00681 0.0215 | 1.37 | 1.5333 1.5479 |
TN | 2 10 0 1.5717 0.00908 0.0287 | 1.83 | 1.5308 1.5508 |
TN | 3 10 0 1.5793 0.00559 0.0177 | 1.12 | 1.5500 1.5654 |
One-way ANOVA: Day 1 versus Lot
Grouping Information Using Tukey Method
Lot N Mean Grouping DC 10 1.58090 A
TN 3 10 1.57929 A
TN 2 10 1.57171 A
TN 1 10 1.56692 A
Descriptive Statistics: Day 4
NN* Mean SE Mean StDev CoefVar | Minimum | Q1 | ||
Day 4 DC | 10 0 2.0499 0.0102 0.0322 1.57 | 1.9917 | 2.0292 | |
TN | 1 10 0 2.0707 0.00529 0.0167 | 0.81 | 2.0455 | 2.0562 |
TN | 2 10 0 2.0685 0.00534 0.0169 | 0.82 | 2.0500 | 2.0544 |
TN | 3 10 0 2.0883 0.00544 0.0172 | 0.82 | 2.0615 | 2.0731 |
One-way ANOVA: Day 4 versus Lot
Grouping Information Using Tukey Method
Lot N Mean Grouping TN 3 10 2.08826 A
TN 1 10 2.07070 AB
TN 2 10 2.06846 AB
DC 10 2.04987 B
Descriptive Statistics: Day 11
NN* | Mean SE Mean | StDev | CoefVar | Minimum | Q1 | |
Day 11 DC | 10 0 | 3.4847 0.00800 | 0.0253 | 0.73 | 3.4583 | 3.4659 |
TN | 1 10 0 | 3.5138 0.00762 | 0.0241 | 0.69 | 3.4727 | 3.4920 |
TN | 2 10 0 | 3.5234 0.00572 | 0.0181 | 0.51 | 3.4917 | 3.5063 |
TN | 3 10 0 | 3.5208 0.00559 | 0.0177 | 0.50 | 3.4923 | 3.5063 |
One-way ANOVA: Day 11 versus Lot
Grouping Information Using Tukey Method
N | Mean Grouping | |
TN | 2 10 | 3.52343 A |
TN | 3 10 | 3.52076 A |
TN | 1 10 | 3.51385 A |
Address | 10 | 3.48470 B |
Descriptive Statistics: Day 18
NN* Mean SE Mean StDev | CoefVar | Minimum | Q1 | |
18th DC | 10 0 5.1845 0.00879 0.0278 | 0.54 | 5.1583 | 5.1596 |
TN | 1 10 0 5.2104 0.00702 0.0222 | 0.43 | 5.1818 | 5.1901 |
TN | 2 10 0 5.2011 0.00593 0.0187 | 0.36 | 5.1667 | 5.1843 |
TN | 3 10 0 5.2164 0.00491 0.0155 | 0.30 | 5.1917 | 5.2000 |
One-way ANOVA: Day 18 versus Lot
Grouping Information Using Tukey Method
Lot N Mean Grouping TN 3 10 5.21638 A
TN 1 10 5.21037 AB
TN 2 10 5.20114 AB
DC 10 5.18446 B
Descriptive Statistics: Day 24
NN* Mean SE Mean StDev | CoefVar | Minimum | Q1 | |
24th DC | 10 0 6.8515 0.00589 0.0186 | 0.27 | 6.8250 | 6.8387 |
TN | 1 10 0 6.8820 0.00692 0.0219 | 0.32 | 6.8500 | 6.8607 |
TN | 2 10 0 6.9007 0.00713 0.0226 | 0.33 | 6.8667 | 6.8801 |
TN | 3 10 0 6.9533 0.0113 0.0356 | 0.51 | 6.9000 | 6.9208 |