Tryptophan and Methionine are the most limiting amino acids, especially Lysine. The mutant corn variety Opaque - 2 has a fairly high content of Lysine and Tryptophan. Corn is relatively poor in minerals such as: Ca (0.15%), Mn (7.3 mg/kg) and Cu (5.4 mg/kg).
Table 2.5. Vitamin content in corn kernels (mg/100g)
Corn varieties
Thiamine | Riboflavin | Niacin | Carotene | Total Carotenoids | |
Yellow | 0.48 | 0.10 | 1.85 | 0.30 | 1.32 |
White | 0.34 | 0.08 | 1.64 | 0.15 | - |
Maybe you are interested!
-
 Using brown rice and broken rice instead of corn as pig feed - 17
 -
 Chemical Composition of Rice (Calculated as a % of 100g of Rice)
 -
 Study on botanical characteristics, chemical composition and acetylcholinesterase enzyme inhibitory effects of two species Piper thomsonii (C. DC.) Hook. f. var. thomsonii and Piper hymenophyllum Miq., Piperaceae family - 24
 -
 Study on chemical composition, toxicity and some biological effects supporting the treatment of gastric and duodenal ulcers of Sanchezia nobilis Hook.F. leaves - 2
 -
 Study on botanical characteristics, chemical composition and acetylcholinesterase enzyme inhibitory effects of two species Piper thomsonii (C. DC.) Hook. f. var. thomsonii and Piper hymenophyllum Miq., Piperaceae family - 23
Source: Batal et al. (2010)
b. Rice (Oryza Sativa)
The protein, lipid, and metabolizable energy content of rice is lower than that of corn, but the fiber content is higher. The average crude protein ratio in rice is 7.8 - 8.7%, fiber from 9.0 - 12.0%. Rice can be used as food for laying ducks, ruminants, horses, etc. After turning and separating the husk, rice is obtained as brown rice. The ratio of brown rice to husk is 80:20. Rice husk contains a lot of silicon (>21%). The sharp-edged pieces of rice husk damage the intestinal wall, so pigs should only use brown rice. The chemical composition and nutritional value of rice are shown in Figure 2.1.
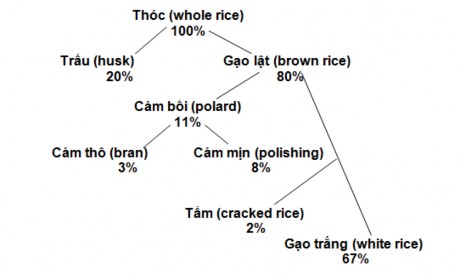
Figure 2.1. Ratio when milling rice
Source: Foulkes (1998)
Paddy and by-products of the rice processing industry include ingredients such as rice husk, accounting for about 20%; brown rice (also known as milled rice) with a ratio of about 80%; bran accounting for 11%, of which: fine bran is 8% and coarse bran is 3%; broken rice is about 2% and white rice accounts for about 67%.
The variation of the proportions of the parts during rice milling is shown in Table 2.6.
Table 2.6. Ratio of products and by-products of rice milling
Subsection
Ratio (by mass) | |
Rice husk | 16 - 28% (average 20%) of paddy |
Brown rice | 72 - 84 % (average 80%) of paddy |
White rice | 90% brown rice |
Bran + rice bran | 10% brown rice |
Source: OECD (2004)
- Chemical composition and nutritional value of brown rice
Chemical composition and nutritional value of brown rice are presented in Table 2.7.
Table 2.7. Chemical composition and nutritional value of brown rice
Unit: %
Target
Study 1 | Study 2 | Study 3 | Study 4 | |
Dry matter | 86.2 | 85.8 - 86.2 | 86.38 | 87.9 |
Crude protein | 8.2 | 7.9 - 8.1 | 8.61 | 8.59 |
Crude fiber | 1.2 | 0.9 | 2.30 | 2.44 |
Crude lipid | 2.42 | 2.1 - 2.3 | 0.60 | 1.0 |
DXKN | 73.7 - 74.3 | 73.57 | 72.4 | |
Raw ash | 1.4 | 1.30 | 1.05 | |
Song | 0.03 | 0.20 | 0.03 | |
P total | 0.24 | 0.33 | ||
P is easily digestible. | 0.15 | - | ||
Na | 0.03 | 0.03 | ||
CL | 0.21 | - | ||
K | 0.19 | 0.19 | ||
Se (ppm) | 0.15 | - | ||
Linoleic acid | 0.73 | - | ||
Methionine | 0.20 | 0.20 | ||
Methionine + Cystine | 0.65 | - | ||
Lysine | 0.31 | 0.35 | ||
Tryptophan | 0.25 | 0.12 | ||
Threonine | 0.32 | 0.32 | ||
Arginine | 0.67 | 0.77 |
Source: Study 1: Leeson & Summers (2008); Study 2: Kosaka (1990); Study 3: Animal Husbandry Institute (1995); Study 4: Li & cs. (2006)
Crude protein content in brown rice ranges from 7.9 - 8.59%; crude lipid content ranges from 0.6 - 2.42%, lipid content fluctuates due to the structure of the milling machines. Crude fiber content in brown rice is low from 0.9 - 2.44%. This is an important factor to help increase the digestibility of nutrients in brown rice when used as feed for pigs. Brown rice is very rich in starch, this is demonstrated by the very high DXKN content in brown rice: 72.4 - 74.3%; brown rice is a high-energy food for pigs.
In their research results, Piao & cs. (2002) reported the fatty acid composition of corn and brown rice (Table 2.8).
Although the fat content of brown rice is only about 2/3 of that of corn, the saturated fatty acid content of brown rice is higher than that of corn (2.007 and 1.384). However, the unsaturated fatty acid content is lower than that of corn (0.9055 and 0.9599). As a result, the ratio of unsaturated fatty acids to saturated fatty acids (USFA/SFA) of brown rice (0.4512) is lower than that of corn (0.6936). This makes the carcass fat of pigs using brown rice for fattening firmer and easier to process than that using corn.
Table 2.8. Fatty acid composition of corn and brown rice (%)
Target
Corn | Brown rice | |
Saturated fatty acids | ||
Palmitic acid (C16:0) | 1,3016 | 1,8931 |
Stearic acid (C18:0) | 0.0824 | 0.1139 |
Total saturated fatty acids | 1,3840 | 2,0070 |
Unsaturated fatty acids | ||
C18:1 | 0.5226 | 0.1169 |
Polyunsatured Oleic acid (C18:2) | 0.4087 | 0.7643 |
Linoleic acid (C18:3) | 0.0286 | 0.0243 |
Total | 0.4373 | 0.7886 |
Total unsaturated fatty acids | 0.9599 | 0.9055 |
Unsaturated/saturated fatty acid ratio | 0.6936 | 0.4512 |
Source: Piao & cs. (2002)
- Chemical composition and nutritional value of broken rice
According to Casas & Stein (2015), broken rice has 7.67% crude protein, equivalent to corn; ADF content is 0.46%, this ratio in corn is 3.11%, so it has a higher digestibility of dry matter and organic matter than corn when used as feed for pigs. According to Brestensky & cs. (2014), broken rice has a higher starch content than corn and a lower non-starch polysaccharide than corn; non-starch polysaccharide reduces the digestibility and efficiency of nutrient use in the digestive tract of pigs. Similarly, the content of amylose and amylose bound to lipids is lower than corn, so rice starch is more easily activated by enzymes, so the digestibility rate in pigs is higher than corn. According to Stein & cs. (2001), the digestibility rate of amino acids in broken rice is over 90% while in corn it is only 80.1%. Broken rice is less contaminated with mycotoxins than corn, according to Ma & cs. (2018) in a study in China showed that the infection rate and content of mycotoxins: aflatoxin B1 (AFB1), zearalenone (ZEN) and deoxynivalenol (DON) in broken rice were lower than in corn.
According to Dadalt & cs. (2016), the nutritional composition of broken rice used as pig feed: DM: 86.97%; CP: 7.75%; ash: 1.18%; crude fiber: 0.72%; lipid: 0.78%;
NDF: 4.81%; ADF: 3.22%.
DE: kcal/kg DM: 3745; ME: kcal/kg DM: 3721; according to 86.97% DM: 3257 kcal DE; 3236 kcal ME/kg.
Schirmann & cs. (2018) determined the chemical composition and DE, ME and NE values of broken rice as feed for pigs. The DE, ME, NE values of broken rice for pigs were: 4060, 3995 and 3356 kcal/kg DM, respectively.
+ Wheat (Triticum spp.)
According to Premier Nutrition (2014), wheat has been grown in the Middle East for over
10,000 years ago and developed in European countries for more than 6,000 years.
Wheat is one of the cereal grains with high nutritional value. According to Leeson & Summers (2008), in wheat grain, crude protein content is from 12 - 15%, higher than corn (8.5%) and brown rice (8.2%). Crude lipid content in wheat (1.5%), lower than corn and rice, even lower than paddy (1.7%). Crude fiber content in wheat is 2.7%, almost twice as high as brown rice (1.2%) and higher than corn (2.5%). Calcium content (0.05%) and easily digestible phosphorus (0.20%) are much higher than corn and brown rice.
Wheat contains all the essential amino acids that are indispensable for pigs. In particular, the lysine content (0.49%) is much higher than that of corn (0.20%) and brown rice (0.31%). Different wheat varieties and microclimate conditions have different nutritional compositions. Adm (2016) reported that wheat contains 11.5% crude protein; 1.9% crude lipid and 3.3% crude fiber. The digestible energy value (DE) for pigs is 3776 - 3896 kcal/kg DM (Gary Partridge, 1995). According to the International Grains Council (2015), 42% of wheat production in 2011 and an estimated 60.66% of wheat production in 2015 in the EU were used as animal feed.
According to the International Grains Council (2016), world wheat production in 2016 was estimated at 736.6 million tons, of which 146 million tons, or 19.8%, were used for animal feed. The EU countries are the largest users of wheat for animal feed in the world, with an annual usage of 56.5 million tons, followed by China and Russia with usage levels of 16 and 14.2 million tons/year, respectively.
- Chemical composition and nutritional value of wheat
Chemical composition and nutritional value of wheat are presented in Table 2.9.
Table 2.9. Chemical composition and nutritional value of wheat and corn for pig feed (air-dried)
Nutrients
Wheat | Corn | |
Dry matter, % | 87.20 | 86.20 |
Crude protein, % | 12.39 | 8.01 |
Crude lipid, % | 1.89 | 3.78 |
Crude fiber, % | 2.47 | 2.15 |
Starch, % | 58.02 | 64.10 |
NDF, % | 13.29 | 8.68 |
ADF, % | 3.50 | 2.41 |
DE, kcal/kg | 3374 | 3458 |
ME, kcal/kg | 3240 | 3364 |
NE, kcal/kg (Sauvant et al., 2004) | 2315 | 2523 |
Source: Stein & cs. (2010)
- Sorghum
Sorghum is the fifth most important cereal grain in the world. In 2010, the world's 25 major sorghum-growing countries produced 45 million tons of sorghum.
In our country, sorghum is often grown in midland and mountainous areas with low yields. According to Grain Council US (2016), the chemical composition of sorghum harvested in the 2015/2016 crop year, % by dry matter: protein 10.9%; starch 73.2%; crude lipid 4.5%, no tannin; moisture 14.1%. Mycotoxin content is below FDA regulations.
The chemical composition and nutritional value of sorghum and corn are presented in Table 2.10.
Table 2.10. Chemical composition and nutritional value of sorghum and corn used as pig feed (air-dried)
Nutrients
Sorghum | Corn | |
Dry matter, % | 89.00 | 89.00 |
Crude protein, % | 9.20 | 8.30 |
Crude lipid, % | 2.90 | 3.90 |
Crude fiber, % | 2.40 | 2.15 |
NDF, % | 18.00 | 9.60 |
ADF, % | 8.30 | 2.80 |
DE, kcal/kg | 3373 | 3516 |
ME, kcal/kg | 3333 | 3412 |
NE, kcal/kg (Sauvant et al., 2004) | 2614 | 2389 |
Source: Tokach & cs. (2011)
The drawback of sorghum is that it contains tannin, is bitter, and is not tasty. Currently, plant geneticists have created a sweet sorghum variety with less tannin, suitable for pig feed.
Comparison of chemical composition and nutritional value of corn, wheat, sorghum, paddy, brown rice and broken rice is presented in Table 2.11.
Table 2.11. Chemical composition and nutritional value of cereal grains
Nutrients
Corn seed 1 | Paddy noodles 1 | High salary 2 | Rice 2 | Brown rice 3 | Rice plate 4 | |
VCK, % | 86 | 89 | 87 | 88.0 | 87.7 | 89 |
Crude protein, % | 7.7 | 11.5 | 9.5 | 8.0 | 7.86 | 8.0 |
Lipids, % | 3.7 | 1.9 | 3.5 | 2.5 | 1.72 | 0.6 |
Crude fiber, % | 2.0 | 3.3 | 2.3 | 9.0 | 1.22 | 0.6 |
NDF, % | 9.6 | 10.5 | 8.0 | 19 | 5.94 | 4.81 |
ADF, % | 2.8 | 3.61 | 2.5 | 11.9 | 2.21 | 3.22 |
Crude ash, % | 1.3 | 1.8 | 2.0 | 4.90 | 1.32 | 1.18 |
DXKN, % | 71.3 | 70.5 | 69.7 | 63.60 | 75.58 | 78.62 |
Ca, % | 0.03 | 0.04 | 0.03 | 0.04 | 0.04 | |
P total, % | 0.28 | 0.39 | 0.28 | 0.24 | 0.16 | |
P digestible, % | 14 | 50 | 20 | |||
K, % | 0.33 | 0.46 | 0.35 | 0.3 | ||
Mg, % | 0.12 | 0.11 | 0.14 | 0.12 | ||
S, % | 0.13 | 0.16 | 0.08 | 0.04 | ||
Cu, ppm | 3 | 8 | 5 | 3 | ||
Fe, ppm | 29 | 32 | 45 | 150 | ||
Mn, ppm | 7 | 38 | 15 | 175 | ||
Zn, ppm | 18 | 47 | 20 | 45 | ||
ME, kcal/kg | 3400 4 | 3113 | 3333 | 2800 4 | 3300 | |
Amino acids (%) | ||||||
Lysine | 0.24 | 0.38 | 0.22 | 0.35 | 0.43 | 0.3 |
Methionine | 0.16 | 0.22 | 0.17 | 0.16 | 1.59 | |
Cystine | 0.17 | 0.27 | 0.17 | 0.17 | 0.12 | |
Methionine + Cystine | 0.33 | 0.49 | 0.34 | 0.33 | - | |
Threonine | 0.27 | 0.39 | 0.31 | 0.29 | 0.48 | |
Tryptophan | 0.06 | 0.26 | 0.10 | 0.10 | 0.03 | |
Isoleucine | 0.25 | 0.45 | 0.37 | 0.29 | 0.45 | |
Valine | 0.35 | 0.57 | 0.47 | 0.43 | 0.21 | |
Arginine | 0.35 | 0.50 | 0.36 | 0.62 | 0.89 | |
Leucine | 1.23 | 0.55 | 0.99 | |||
Source: 1 Adm (2016); 2 Premier Nutrition (2014); 3 Asyifah et al. (2012); 4 Trujillo HAJ (2009)
2.2. SYSTEM FOR DETERMINING THE ENERGY VALUE OF FEED FOR PIG
2.2.1. Energy forms of pig feed
Digestible Energy (DE)
Digestive gas energy (CH 4 ) Urine energy
The term “energy” comes from the ancient Greek word “energeia” which means “activity”, “production”. This also partly explains the important role of energy in the animal world. Energy is necessary for life, from the biosphere to the smallest organisms. For animals, energy is obtained from food. Organic compounds in food such as carbohydrates, lipids, proteins and nucleic acids. Through the metabolic process, energy from food will be transformed and provided to the animal to maintain body activities and serve production/create products as shown in Figure 2.2.
Gross Energy (GE)
Energy breakdown (FE)
Metabolizable Energy (ME)
Thermal energy (HI)
Net Energy (NE)
NE Maintain
- Basic metabolism
- Maintain body temperature
NE Production
- Growth
- Fattening
- Milk production
Figure 2.2. Energy forms of food in pigs
Source: National Research Council (2012)