Code
Tangibility | |
T_1 | The bank's website provides customers with a lot of valuable information. electronic banking |
T_2 | Find information about e-banking on the bank's website simply. simple |
T_3 | The bank's website is very attractive. |
Reliability | |
R_1 | The bank always fulfills its responsibilities in transactions. customer e-banking |
R_2 | Electronic banking transactions are always performed accurately. |
R_3 | When a problem arises with a customer's electronic banking transaction, The bank is serious about handling |
Responsiveness | |
Res_1 | Bank staff tell customers exactly when the service will be available. Customer's e-banking request will be executed. |
Res_2 | Bank staff help customers quickly complete transactions. electronic banking service |
Understanding | |
E_1 | Bank employees put the interests of customers first in all things. electronic banking transactions |
E_2 | Bank staff understand the specific needs of customers in electronic banking transactions |
E_3 | Bank employees care about personal matters customers in electronic banking transactions |
E_4 | The bank's customer helpline is very helpful. |
Maybe you are interested!
-
 Summary of Cronbach'S Alpha Reliability Coefficients of the Scales
 -
 Summary of Results of Cronbach'S Alpha Coefficient of Impact Factors Scale
 -
 Summary of Cronbach'S Alpha Coefficient Results (See Appendix 4)
 -
 Summary of Soft Skills Classes Held at Bidv Bank in the Southeast Region
 -
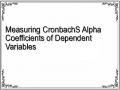 Measuring Cronbach'S Alpha Coefficients of Dependent Variables
* Online information system quality: includes 3 components: ease of use (access), accuracy, security (Jun & Cai (2001)[100]; (Yang et al.
et al., 2004)[1569. In which, ease of use is measured by 5 observed variables, accuracy is measured by 3 observed variables, security is measured by 4 observed variables. Thus, there are a total of 12 observed variables to measure 3 components of online information system quality.
Code
ELECTRONIC INFORMATION SYSTEM QUALITY | |
Accessibility | |
EU_1 | Arranging information on the bank's website helps customers search information in a simple way |
EU_2 | Simple access to your online banking account |
EU_3 | Using the bank's website for electronic banking transactions requires require much effort |
EU_4 | Make an electronic banking transaction through the bank's website. The goods are simple |
EU_5 | I don't waste much time waiting when searching for information about the service. e-banking services via bank website |
Accuracy | |
A_1 | Customer online transactions are always executed accurately. |
A_2 | Information about e-banking services on the bank's website is Exactly |
A_3 | Online transactions are carried out accurately |
Safety | |
S_1 | I trust the bank not to misuse my personal information. of the customer |
S_2 | I feel safe with electronic banking transactions through Bank website |
S_3 | Sensitive customer information in banking transactions electronically through the bank's secure website |
S_4 | Risks associated with online transactions through bank websites is low |
* Quality of banking products and services: measured by 5 observed variables (Jun & Cai (2001)[81]; (Yang et al., 2004)[150].
Code
BANKING PRODUCT AND SERVICE QUALITY | |
BSP_1 | Banks provide electronic banking services that customers want. |
BSP_2 | Banks provide most of the online service functions that customers goods needed |
BSP_3 | All online service needs of customers are represented in bank directory |
BSP_4 | The bank offers a wide range of online services. |
BSP_5 | Many free online services are offered by the Bank. |
* Overall e-banking service quality: measured by two observed variables (Yang et al., 2004)[169].
Code
OVERALL ELECTRONIC BANKING SERVICE QUALITY | |
O_1 | Overall, the quality of the bank's e-services is good. |
O_2 | Overall, the bank has all the elements to make a service provider. good e-banking service |
* Customer satisfaction: measured by 4 observed variables (Yang et al., 2004)[169].
Code
CUSTOMER SATISFACTION | |
CS_1 | Overall, I am satisfied with what happened in my banking transactions. Electronics with banking |
CS_2 | Overall, I am satisfied with the bank's Internet-based transactions. |
CS_3 | Overall, I am satisfied with the products and services provided by the bank. row |
CS_4 | Overall, I am satisfied with the bank I am dealing with. |
* Customer loyalty: measured by 3 observed variables (Homburg and Giering, 2001)[89].
Code
CUSTOMER LOYALTY | |
L_1 | I will continue to do my banking online through my bank. I am trading now |
L_2 | The bank I am dealing with has always been my number one choice in banking. electronic banking transactions |
L_3 | I will recommend the bank I am dealing with to my friends and relatives. my body |
* Switching costs : measured by 5 observed variables (Andreassen & Lindestad,1998[26]; Dawes & Swailes,1999[58]; Harrison, 2000[85]; Lee & Cunningham, 2001[107]; Jones, Mothersbaugh & Beatty, 2002[94]).
Code
CONVERSION COSTS | |
SC_1 | It will take a long time if I do an electronic banking transaction in a other banks |
SC_2 | It will cost a lot if I do my banking online at a bank. other goods |
SC_3 | It will be difficult to get used to the new procedures for electronic banking transactions. died at another bank |
SC_4 | It is not comfortable to do electronic banking transactions at the bank. other |
SC_5 | I have invested a lot (effort, money, time...) in building relationships. banking relations |
* Customer trust: measured by 3 observed variables (Delgado- Ballester and Munuera- Alemans, 2005[62]).
Code
CUSTOMER TRUST | |
Tr_1 | I trust the electronic banking services provided by the bank. |
Tr_2 | My bank account for electronic banking transactions is very safe. |
Tr_3 | I believe that bank leaders always care about the interests of customers. |
For the two variables of online customer service quality and online information system quality, since they consist of many different components, each component is measured by observed variables (items), the author therefore uses a composite scale, in which each component variable is calculated by the average (mean) of the observed variables. Calculating the average like this does not lose the representativeness of the variables (Bagozzy & Heathaton, 1994[29]).
3.1.3.2. Reliability of the scale
To examine the reliability of the scale, the Cronbach Alpha coefficient is applied. This method allows the analyst to eliminate inappropriate variables and limit junk variables during the research process and evaluate the reliability of the scale by coefficient through the Cronbach Alpha coefficient.
Variables with item-total correlation coefficients less than 0.3 will be eliminated. Scales with Cronchbach Alpha coefficients of 0.6 or higher can be used in cases of new research concepts (Nunnally, 1978[129]; Peterson, 1994[137]; Slater, 1995[154]). Normally, scales with Cronchbach Alpha from 0.7 to 0.8 can be used. Many researchers believe that scales with Cronchbach Alpha coefficients from 0.8 to close to 1 are the best measurement scales.
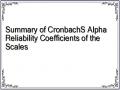
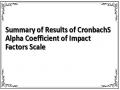
Table 3.1: Summary of Cronchbach Alpha coefficients of variables
STT
Variable name | Cronchbach Alpha | |
1 | Quality of e-banking services | 0.870 |
2 | Quality of online information systems | 0.850 |
3 | Quality of banking products and services | 0.891 |
4 | Overall e-service quality | 0.856 |
5 | Customer satisfaction | 0.908 |
6 | Customer loyalty | 0.845 |
7 | Conversion costs | 0.879 |
8 | Customer trust | 0.861 |
Source: Calculated from survey data Thus, after calculating the Cronbach Alpha coefficient of the variables in the model, it can be seen that all variables have a Cronbach Alpha coefficient > 0.8, proving that the
The scales are all reliable.
3.2. Structural Equation Modeling (SEM)
3.2.1. Overview of SEM model
SEM (Structural Equation Model) is one of the most complex and flexible techniques used to analyze complex relationships in causal models. SEM models are widely used in research fields such as psychology (Anderson & Gerbing, 1988[24]; Hansell & White, 1991[87]), sociology (Lavee, 1988[108]; Lorence & Mortimer, 1985[115]), child development research (Biddle & Marlin, 1987[39]) and in the field of management (Tharenou, Latimer & Conroy, 1994[159]). In particular, this model is also applied in many customer satisfaction models such as: mobile information service industry (MK. Kim et al., 2004)[101].
SEM is an extension of the generalized linear model (GLM) that allows the researcher to test a set of regression equations at once. SEM can provide a complex model fit to data such as longitudinal survey data sets, confirmatory factor analysis (CFA),
non-normalized models, databases with autocorrelated error structures, data with non-normal variables, or missing data. In particular, SEM is used to estimate measurement models and structural models of multivariate theoretical problems.
The measurement model specifies the relationship between latent variables and observed variables. This model provides information about the measurement properties of the observed variables (reliability, validity).
Structural models specify the relationships between latent variables. These relationships can describe theoretical predictions that researchers are interested in.
SEM combines all techniques such as multiple regression, factor analysis and correlation analysis (between elements in the network diagram) to allow us to examine the complex relationships in the model. Unlike other statistical techniques that only allow to estimate the partial relationship of each pair of factors (elements) in the classical model (measurement model), SEM allows to simultaneously estimate the elements in the overall model, estimating the causal relationship.
between latent variables (Latent Constructs) through indicators that combine both measurement and structure of the theoretical model, measure stable (recursive) and unstable (non-recursive) relationships, measure direct and indirect effects, including measurement error and residual correlation. With confirmatory factor analysis (CFA) technique, SEM model allows flexibility to find the most suitable model among proposed models.
3.2.2. Uses and advantages of SEM
Structural Equation Modeling (SEM) has many uses and advantages:
Test whether hypotheses about causality are consistent (FIT) with empirical data.
Confirming relationships between variables.
Is a method that combines regression method, factor analysis method, and variance analysis method.
Estimate the reliability (factor structure) of the scales before analysis
path analysis
Allows simultaneous implementation of multiple dependent (endogenous) variables.
Provide goodness-of-fit indices for testing models.
Allows improvement of poorly fitting models by flexible use of Modification Indices (MI).
SEM provides valuable statistical tools, when using measurement information to calibrate hypothesized relationships between latent variables.
SEM helps to hypothesize models and statistically test them (because EFA and regression may not be statistically stable and consistent).
SEM assumes a causal structure between latent variables that may be linear combinations of observed variables, or variables participating in a causal chain.
3.2.3. Types of SEM models
The SEM model consists of two related models, the measurement model and the structural model. Both models are specifically defined by researchers:
Measurement model
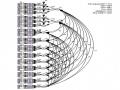
The measurement model, also known as the factor model, describes how the observed variables represent and explain the latent variables: that is, it describes the factor structure (latent variables), and at the same time describes the measurement characteristics (reliability, validity) of the observed variables. Measurement models for independent variables can be unidirectional, can be correlated, or can identify higher-order latent variables. The measurement model shows the statistical relationships between the observed variables, which can be used to standardize the underlying structural model. The latent variables are connected by standardized regression relationships, that is, estimating values for the regression coefficients.
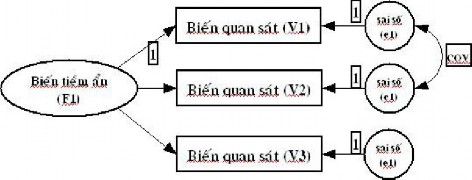
Source: Structural Modeling with Latent Variables, Bollen, KA(1989)
Figure 3.1: Measurement model
The measurement model uses factor analysis to assess the extent to which observed variables load on their latent concepts. To assess the validity (convergent and divergent) of observed variables, confirmatory factor analysis (CFA) and covariance matrix based on SEM model are used.
Structural model
Identify the links (causal relationships) between the latent variables by connecting arrows, and assign them explained and unexplained variances, forming the underlying causal structure. The latent variables are estimated by multiple regression of observed variables. SEM does not allow the use of concepts represented by single observed variables. Usually, the latent variable is measured by at least one variable, or from 3 to a maximum of 7 observed variables (Hair et al., chapter 11, 2000).