Factor
Sample (N) | Minimum | Maximum | Mean | Std. Deviation | |
GC5 | 305 | 1 | 5 | 2.73 | .811 |
GC6 | 305 | 1 | 5 | 2.73 | .794 |
GC7 | 305 | 1 | 5 | 2.87 | .806 |
GC8 | 305 | 1 | 5 | 2.84 | .843 |
GC9 | 305 | 1 | 5 | 2.84 | .862 |
TH1 | 305 | 1 | 5 | 2.64 | .980 |
TH2 | 305 | 1 | 5 | 2.68 | .940 |
TH3 | 305 | 1 | 5 | 2.69 | .927 |
TH4 | 305 | 1 | 5 | 2.62 | .932 |
TH5 | 305 | 1 | 5 | 2.64 | .990 |
QM1 | 305 | 1 | 5 | 3.69 | .834 |
QM2 | 305 | 1 | 5 | 3.70 | .879 |
QM3 | 305 | 1 | 5 | 3.71 | .853 |
QM4 | 305 | 1 | 5 | 3.65 | .894 |
MK1 | 305 | 1 | 5 | 2.88 | .824 |
MK2 | 305 | 1 | 5 | 2.84 | .800 |
MK3 | 305 | 1 | 5 | 2.79 | .813 |
MK4 | 305 | 1 | 5 | 2.81 | .801 |
MK5 | 305 | 1 | 5 | 2.79 | .771 |
RR1 | 305 | 1 | 5 | 3.35 | .826 |
RR2 | 305 | 1 | 5 | 3.35 | .819 |
RR3 | 305 | 1 | 5 | 3.42 | .835 |
RR4 | 305 | 1 | 5 | 3.41 | .850 |
RR5 | 305 | 1 | 5 | 3.31 | .802 |
RR6 | 305 | 1 | 5 | 3.32 | .801 |
RR7 | 305 | 1 | 5 | 3.34 | .799 |
RR8 | 305 | 1 | 5 | 3.31 | .838 |
RR9 | 305 | 1 | 5 | 3.31 | .835 |
NLCT1 | 305 | 1 | 5 | 2.53 | .573 |
NLCT2 | 305 | 1 | 5 | 2.52 | .580 |
NLCT3 | 305 | 1 | 5 | 2.54 | .578 |
Valid N (listwise) | 305 |
Maybe you are interested!
-
 Summary of Results of Cronbach'S Alpha Coefficient of Impact Factors Scale
 -
 Results of Testing Cronbach's Alpha Coefficient of Independent Variable
 -
 Cronbach'S Alpha Coefficient Test Results of the Ability Scale
 -
 Cronbach's Alpha Reliability Coefficient of Components of the Scale of Factors Affecting Investment Capital Attraction for Tourism in Ba Ria Vung Tau Province
 -
 Reliability Testing Using Cronbach'S Alpha Coefficient
(Source: Author's research results)
The average value of the observed variables in the groups: CL; SP; QM; RR is above 3, the majority of respondents agree at a high level with the criteria in the questionnaire. The remaining observed variables in the groups: NL; TC; QT; GC; TH; NLCT, have an average level above 2 and some groups are approximately 3, showing that about 50% agree with the criteria.
Summary of reliability assessment of Cronhbach's Alpha scale
Table 4.3: Summary of Cronbach's Alpha Coefficient results (See Appendix 4)
Factors
Cronbach's Alpha coefficient | Small variable-total correlation coefficient best | Number of initial observed variables | Number of observed variables remaining again | |
Human Resources (NL) | .838 | .657 | 5 | 4 |
Finance (TC) | .828 | .603 | 5 | 5 |
Executive Management (QT) | .895 | .696 | 6 | 6 |
Service Quality (CL) | .818 | .593 | 4 | 4 |
Products – Services (SP) | .859 | .552 | 5 | 5 |
Price (GC) | .906 | .626 | 9 | 9 |
Brand (TH) | .875 | .683 | 5 | 5 |
Scale – Network (QM) | .884 | .733 | 4 | 4 |
Marketing (MK) | .867 | .658 | 5 | 5 |
Risk Management (RR) | .918 | .603 | 9 | 9 |
Competitiveness (NLCT) | .829 | .662 | 3 | 3 |
(Source: Author's research results)
Evaluate the results of Cronbach's Alpha reliability test
Checking the reliability, there are components that are inappropriate observed variables, the author proceeds to remove the variables: NL2 (Employees are diligent in their work). Continuing to perform the test steps after removing the above variables, the results are reliable in the research model.
All Cronbach's Alpha coefficients are > 0.6, no coefficient exceeds 0.95.
All total variable correlation coefficients are > 0.3
Based on the theoretical basis specified above, it shows that the Cronbach's Alpha reliability for the independent variables in the research model has good results and all meet the requirements according to regulations.
Results of scale testing by EFA (See Appendix 5)
Independent variable
Results of the first run: There is a variable TC4 that needs to be removed, because this variable loads on both factors. Remove variable SP3 because this variable has a loading factor of less than 0.5. Continue to run the second run, giving the results:
Table 4.4: KMO coefficient and Bartlett's Test
KMO and Bartlett's Test
Kaiser-Meyer-Olkin Measure of Sampling Adequacy. | .876 | |
Bartlett's Test of Sphericity | Approx. Chi- Square | 8948.058 |
df | 1431 | |
Sig. | .000 | |
(Source: Author's research results)
KMO = 0.876 so factor analysis is appropriate
Sig. (Bartlett's Test) = 0.000 (sig. < 0.05) shows that the observed variables are correlated with each other in the population.
The above results show that the independent variables ensure both convergent and discriminant values, and the coefficients of KMO all meet the requirements.
Total variance extracted: Rotation Sums of Squared Loadings (Cumulative %) = 58.148% > 50 %. This shows that 58.148% of the variation in the data is explained by 10 factors.
Table 4.5: Model matrix
Pattern Matrix a
Factor | ||||||||||
1 | 2 | 3 | 4 | 5 | 6 | 7 | 8 | 9 | 10 | |
RR6 | .830 | |||||||||
RR5 | .797 | |||||||||
RR9 | .758 | |||||||||
RR2 | .754 | |||||||||
RR8 | .744 | |||||||||
RR1 | .739 | |||||||||
RR3 | .720 | |||||||||
RR7 | .705 | |||||||||
RR4 | .606 | |||||||||
GC8 | .777 | |||||||||
GC7 | .744 | |||||||||
GC3 | .736 | |||||||||
GC9 | .735 | |||||||||
GC1 | .725 | |||||||||
GC2 | .717 | |||||||||
GC5 | .687 | |||||||||
GC4 | .674 | |||||||||
GC6 | .604 | |||||||||
QT3 | .782 | |||||||||
QT6 | .776 | |||||||||
QT1 | .759 | |||||||||
QT4 | .744 | |||||||||
QT5 | .742 | |||||||||
QT2 | .741 | |||||||||
TH2 | .795 | |||||||||
TH4 | .788 | |||||||||
TH1 | .783 | |||||||||
TH5 | .715 | |||||||||
TH3 | .696 | |||||||||
Pattern Matrix a
Factor | ||||||||||
1 | 2 | 3 | 4 | 5 | 6 | 7 | 8 | 9 | 10 | |
MK4 | .781 | |||||||||
MK2 | .769 | |||||||||
MK1 | .766 | |||||||||
MK3 | .750 | |||||||||
MK5 | .694 | |||||||||
QM2 | .819 | |||||||||
QM4 | .811 | |||||||||
QM1 | .806 | |||||||||
QM3 | .748 | |||||||||
SP4 | .776 | |||||||||
SP1 | .773 | |||||||||
SP5 | .771 | |||||||||
SP2 | .761 | |||||||||
NL4 | .779 | |||||||||
NL1 | .750 | |||||||||
NL5 | .741 | |||||||||
NL3 | .702 | |||||||||
CL4 | .768 | |||||||||
CL3 | .734 | |||||||||
CL1 | .729 | |||||||||
CL2 | .585 | |||||||||
TC5 | .695 | |||||||||
TC2 | .694 | |||||||||
TC3 | .679 | |||||||||
TC1 | .678 | |||||||||
Extraction Method: Principal Axis Factoring. Rotation Method: Promax with Kaiser Normalization. | ||||||||||
a. Rotation converged in 7 iterations. | ||||||||||
(Source: Author's research results)
In the Pattern Matrix shown with Factor loading
> 0.5, so the variables in the model have practical significance.
Dependent variable
Table 4.6: KMO coefficient and Bartlett's Test
KMO and Bartlett's Test
Kaiser-Meyer-Olkin Measure of Sampling Adequacy. | .720 | |
Bartlett's Test of Sphericity | Approx. Chi-Square | 341,433 |
df | 3 | |
Sig. | .000 | |
(Source: Author's research results)
KMO = 0.720 > 0.5 so factor analysis is appropriate
Sig. (Bartlett's Test) = 0.000 (sig. < 0.05) shows that the observed variables are correlated with each other in the population.
Table 4.7: Explanation of total extracted variance
Total Variance Explained
Factor | Initial Eigenvalues | Extraction Sums of Squared Loadings | ||||
Total | % of Variance | cumulative % | Total | % of Variance | cumulative % | |
1 | 2,237 | 74,563 | 74,563 | 1,858 | 61,948 | 61,948 |
2 | .416 | 13,854 | 88,418 | |||
3 | .347 | 11,582 | 100,000 | |||
Extraction Method: Principal Axis Factoring. | ||||||
(Source: Author's research results)
The rotation matrix results show that there is a factor extracted from the observed variables and included in the EFA analysis. The explained variance is 61.948%.
CFA analysis results (See Appendix 6)
Model Fit indices are all within good range:
CMIN/DF = 1.114 < 2; GFI = 0.849 > 0.8; CFI = 0.981 > 0.9; TLI = 0.979 >
0.9; RMSEA = 0.019 < 0.06; PCLOSE = 1.000 > 0.05.
Conclusion: The model fits the data well.
All standardized weights are greater than 0.5. Thus, all observed variables are significant in CFA.
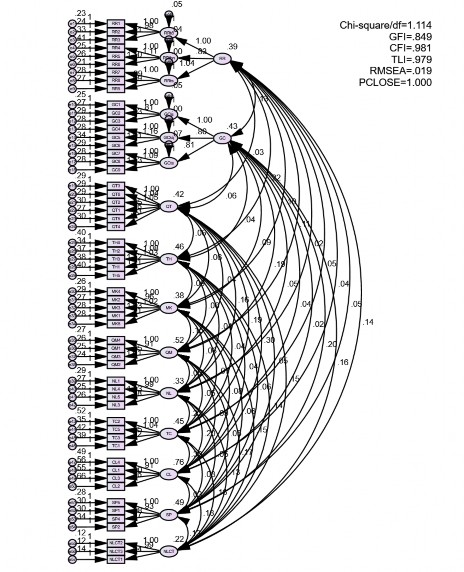
Figure 4.1: CFA research results
(Source: Author's research results)
Results of analysis using SEM linear structural model
(See Appendix 7)
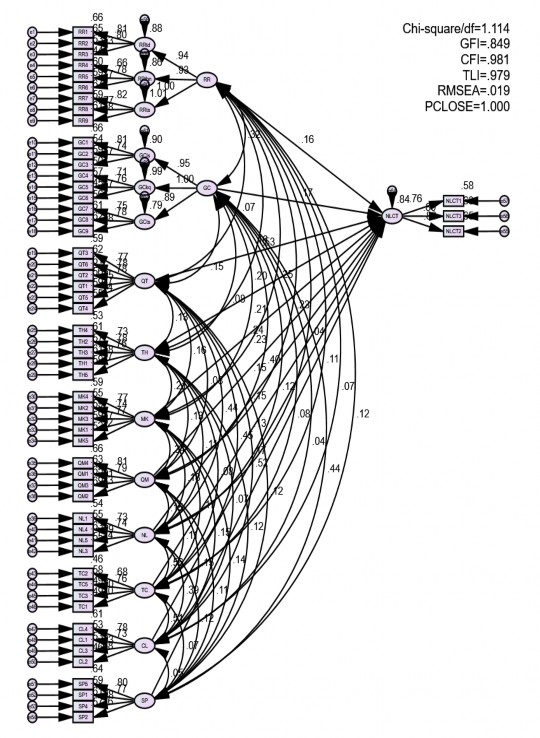
Figure 4.2: SEM research results
(Source: Author's research results)