interval [0.5; 1.0]; Bartlett's test has Sig < 0.05 (observed variables are correlated with each other in the population); total variance explained> 50%; Eigenvalue > 1.
- Confirmatory Factor Analysis (CFA): is one of the techniques that allows testing how well the observed variables (measured variables) represent the concepts (constructs), that is, helps research test whether the scales meet the requirements of a good scale (do the measurement scales represent the same research concept). Does the measurement model meet the requirements (confirm the suitability of the theoretical model with the research data to explain the relationship between the concepts). Confirmatory factor analysis (CFA) is used to evaluate the scale before putting it into the SEM structural model analysis. The measurement model will analyze the relationship of a latent variable with a number of observed variables based on the proposed theoretical model, it provides information about the measurement properties of the observed variables (reliability, validity). The criteria for performing CFA include criteria for assessing the suitability of the model such as: Chi-square (CMIN); Chi-square adjusted for degrees of freedom (CMIN/df); GFI (Goodness of Fit Index); TLI (Tucker & Lewis Index); CFI (Comparative Fit Index); RMSEA (Root Mean Square Error Approximation); p-value. In addition, there are criteria for assessing the model's suitability according to the value aspects of the scale: Reliability of the scale, unidimensionality, convergent validity, discriminant validity, theoretical validity.
- Analyze the SEM structural model using path analysis to analyze complex relationships in the causal model. The structural model specifies the relationships between latent variables.
- ANOVA analysis: To test whether the difference in demographic characteristics makes a difference in the intention and decision to use bank cards of Vietnamese consumers. One-Waw ANOVA method was performed.
2.2.2. Research process
The research will be conducted through two phases: qualitative research and quantitative research. The research process is shown in Figure 2.3.
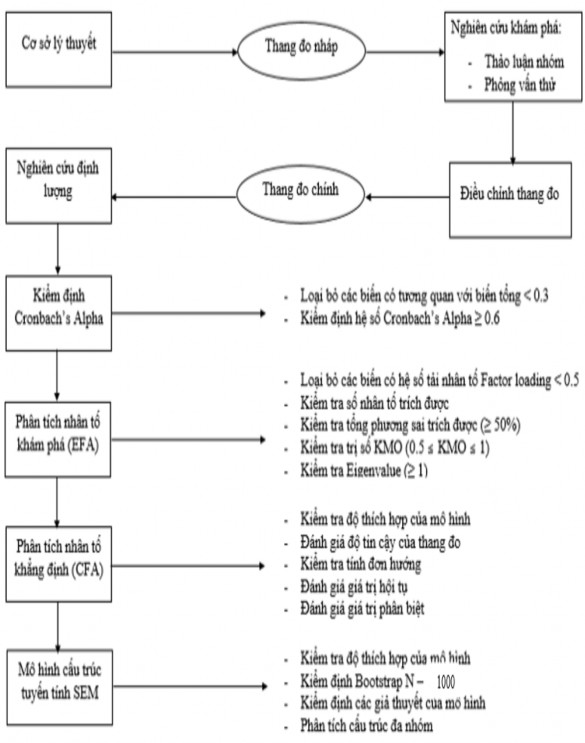
Figure 2.3. Research process
To carry out the above research process, the steps are implemented as follows:
Table 2.5. Progress of research steps
Step
Method of implementation | Data Collection | Time | Location | |
1 | Preliminary | Group discussion | January-February 2017 | Danang City |
2 | Experiment | Live interview next | April 2017 | Danang City |
3 | Official | Face to face interview | June -> 11 years 2017 | Da Nang City, Hanoi, Ho Chi Minh City. |
Maybe you are interested!
-

 Progress of Research Implementation
 -
 Research on treatment of rotator cuff tears using modified Mason-Allen tendon endoscopic suturing technique and creating micro-damage at the attachment area - 2
 -
 Research Model of Factors Impacting Work Motivation of Tour Guide Team in Binh Dinh Province
 -
 Research on the fabrication and gas sensitivity of heterostructures between SnO2 nanowires and some semiconducting metal oxides - 16
 -
 Research Status of Non-Epithelial Gastrointestinal Cancers in Vietnam
Step 1: Preliminary research
This study was conducted according to the process in Figure 2.3. Accordingly, the draft scale was built on the basis of a theoretical overview and previous studies related to factors affecting the intention and decision to use products/services. On this basis, a set of observed variables (draft scale 1) was built to measure latent concepts.
According to Nguyen Dinh Tho and Nguyen Thi Mai Trang [48], in the scientific research of Marketing in general and consumer behavior in particular, due to differences in culture and economic development levels, the scales may have been established in developed countries but are not suitable for the Vietnamese market. Therefore, to build the scales in the thesis research, the author has gathered the adjusted and supplemented scales through discussion and solicited comments from experts (qualitative preliminary research).
After completing the draft of scale 1, qualitative research was conducted through interviews and group discussions with the following subjects: (i) Leaders and employees working at commercial bank branches providing banking services (Three people); (ii) Experts in the Finance - Banking industry (Three people); and (iii) Customers using banking services (Five people).
The content related to the interview and discussion includes: (i) Part 1: Introducing the purpose and meaning of the interview; (ii) Part 2: Questions to test and screen independent variables; and (iii) Part 3: Introducing the scales of independent and dependent variables to solicit comments for additional adjustments.
Two focus group discussions with two groups were conducted in two different sessions:
- Group 1: Includes 3 leaders and employees working at the bank + 3 experts in the banking and finance industry. Due to the specific conditions of the work, discussions and solicitations for comments from members of this group were conducted individually. Discussions were conducted at the interviewee's workplace. Each interview lasted an average of 30 - 45 minutes with the following content: introducing the purpose and meaning of the interview; screening independent variables; especially focusing on introducing the scales of independent variables and dependent variables to solicit comments for adjustment and supplementation. The implementation technique was observation and one-on-one discussion. The content of the discussions was recorded and analyzed to draw conclusions.
- Group 2: Focus group discussion was conducted with 5 customers who are using banking services. The discussion content revolved around the components of marketing policy evaluation, legal factors, science and technology, usefulness, ease of use, social influence and perceived behavioral control, service quality, thereby recording their opinions on bank card services and intentions and decisions to use bank cards. The discussion also focused on introducing the content of the scales to evaluate the appropriateness of the interview questions (do customers understand the content of the questions) and customers gave their complete opinions on the content of the questions, the words used in the questions that will be used in the quantitative survey later.
Conclusions are drawn based on a synthesis of the common views of the stakeholders.
statue:
+ 01 customer does not see the relationship between legal factors and intentions.
decided to use a bank card.
+ 01 customer does not see the strong influence of people around them on their use of the service.
+ The remaining factors such as: marketing policy, legal factors, science and technology factors, perceived ease of use, perceived risk, perceived usefulness, perceived behavioral control, service quality are related to usage intention and usage decision.
After conducting group discussions and asking for comments from experts, the author adjusted and rebuilt the draft 2 scales to serve the purpose of preliminary quantitative research (The preliminary questionnaire is presented in Appendix 1).
Step 2: Experimental research
Preliminary quantitative research was conducted, in this research step, the author assessed the value and reliability of the research concepts. To ensure the validity and value of the questionnaire items, verification through pre-test and pilot test was conducted. The sample size of the preliminary survey was 100 customers in Da Nang city and the factors were put forward for measurement. The study was conducted with 5 questions for the marketing policy factor (MARKET), 4 questions for the legal factor (PL1), 5 questions for the perceived ease of use factor (DESD), 5 questions for the perceived risk factor (RR), 4 questions for the perceived usefulness factor (HI), 4 questions for the science and technology factor (KHCN), 3 questions for the social influence factor (XH), 4 questions for the perceived behavioral control factor (NTKSHV), 3 questions for service quality, 4 questions for the intention to use factor (YD), 3 questions for the decision to use factor (QD) (Details in Appendix 1 of the survey questionnaire).
According to Hair et al. [95], the reliability of a scale is assessed through the level of consistency of measurements between observed variables. The measures are developed from previous studies, so it is necessary to assess the reliability and validity of the scales through preliminary research.
In this research phase, some research techniques are used: using SPSS software to analyze Cronbach alpha to eliminate variables with small correlation coefficients with the total variable and at the same time check the Cronbach alpha coefficient. The Cronbach alpha coefficient is a statistical test of the degree of tightness with which the items in the scale are correlated with each other. Exploratory factor analysis (EFA): is a statistical analysis method used to reduce a set of many interdependent observed variables into a smaller set of variables but they are more meaningful and still contain most of the information content of the original set of variables while still ensuring the interdependent relationship. Confirmatory factor analysis CFA: helps research to test whether the measurement model meets the requirements? Do the scales meet the requirements of a good scale?
Indicators that meet the criteria will be retained to complete the formal questionnaire and conduct formal quantitative research. This stage will help the research to minimize errors in the investigation process and achieve higher efficiency.
Step 3: Formal Research
For the survey of intention and decision to use Vietnamese bank card services, the study uses quantitative research methods through questionnaires. After the survey information is collected, it will be converted into quantitative data for analysis.
This study selected customers in major cities such as Hanoi, Ho Chi Minh City, Da Nang. To conduct analysis and evaluation of basic factors affecting the intention to use bank card services. The study collected samples based on random access and distributed questionnaires to 450 customers coming to transact at banks with the help of bank staff at bank transaction offices.
After collecting field data and entering data, the author checked and cleaned the data. The study was conducted on the results of 410 questionnaires and analyzed. Data cleaning, coding of information in the questionnaire, data entry and analysis were performed using statistical processing software SPSS, AMOS. The factors were manipulated into many empirical indicators with Likert scale, so the author conducted exploratory factor analysis (EFA) to check the unidimensionality of the empirical indicator measures, thereby eliminating some inappropriate criteria. After analyzing EFA for each variable, the indicators' measures were analyzed at the same time to analyze the correlation between the scales, there was a clear distinction between the concepts, whether it was necessary to recombine the factors to achieve practical significance or not and whether it was necessary to adjust the theoretical model initially proposed or not.
During the process of performing EFA factor analysis, some inappropriate measurement criteria continue to be eliminated so that the model has practical application meaning. Confirmatory factor analysis (CFA) helps research to test the measurement model and determine the measurement model. During the process of performing EFA analysis, some inappropriate measurement criteria continue to be eliminated so that the model has practical application meaning. Structural equation analysis (SEM) is performed to test the hypotheses. This combination will help to check and minimize the errors that may occur during the research process.
Research results are synthesized based on model testing results.
From there, conclude and give solutions, suggesting directions for further research.
2.2.3. Building a scale
To conduct quantitative preliminary research, the author performed the following steps:
Step 1: Build theoretical concepts of variables and how to measure variables in the theoretical model based on existing studies.
Step 2: Construct a Vietnamese version of the questionnaire (from the original English version for scales inherited from previous studies) to create draft scale 1.
Step 3: Check the accuracy, clarity, and coherence of the Vietnamese version with the consultation of experts in the research field and adjust and supplement observation variables to create a draft scale 2 suitable for the research field.
After synthesizing the opinions, the author has grouped similar factors and evaluated the important role, representing the characteristics of the factors affecting the intention and decision to use bank card services. The model of factors affecting the intention and decision to use bank cards is proposed, including eleven factors: Marketing policy, legal factors, science and technology, perceived usefulness, perceived ease of use, perceived risk, social influence, perceived behavioral control, service quality, intention to use, and decision to use bank cards of Vietnamese consumers.
2.2.3.1. Perceived usefulness scale
The four questions were inherited from the studies of Davis [71],[73]; Davis et al. [75], Karahanna et al. [105]; Venkatesh and Davis[167]. All these indicators were measured with a 5-point likert scale and the questions were as follows:
Table 2.6. Perceived usefulness scale
CODE
PERCEIVED USEFULNESS SCALE | AUTHOR | |
HI1 | Using bank card is very convenient | Davis [71], [73]; Davis et al. [75]; Karahanna et al. [105]; Venkatesh and Davis[167]. |
HI2 | Bank card services are generally very useful. | |
HI3 | Bank card service saves time | |
HI4 | Bank card effective financial control |
Source: Author's synthesis, 2017.
2.2.3.2. Ease of use perception scale
Perceived ease of use was measured by five indicators adopted from the studies of Nguyen Duy Thanh and Cao Hao Thi [46], Davis [71], [73]; Davis et al. [75]; Park and Chen [136], Pikkarainen [139]; Venkatesh [165]; Venkatesh and Davis[167]. All these indicators were measured by a 5-point Likert scale. The questions were:
Table 2.7. Perceived ease of use scale
CODE
FEEL EASY TO USE | AUTHOR | |
DESD1 | Easy to operate when using bank card goods (transfer money, withdraw money...) | Nguyen Duy Thanh and Cao Hao Thi [46], Davis [71], [73]; Davis and colleagues [75]; Park and Chen [136], Pikkarainen [139]; Venkatesh [165]; Venkatesh and Davis [167]. |
DESD2 | Control operations when using the card | |
DESD3 | Clear and easy to understand transaction process | |
DESD4 | Easy to learn bank card transactions to use | |
DESD5 | Easy to use bank card |
Source: Author's synthesis, 2017.
2.2.3.3. Usage intention scale
These questions were adopted from the studies of Nguyen Duy Thanh and Cao Hao Thi [46]; Davis [73]; Lin et al. [81]; Pikkarainen [139]; Shih [149]; Taylor and Todd [159]. These indicators were measured by likert scale. The questions were:
Table 2.8. Usage intention scale
CODE
USE INTENTION SCALE | AUTHOR | |
YD1 | I find using a bank card a good idea. | Nguyen Duy Thanh and Cao Hao Thi[46]; Davis [73]; Lin et al. [81]; Pikkarainen [139]; Shih [149]; Taylor and Todd [159]. |
YD2 | I intend to use a bank card | |
YD3 | I intend to use the card regularly. | |
YD4 | I intend to recommend to my family/friends use bank card |
Source: Author's synthesis, 2017.
2.2.3.4. Decision scale used
These three questions are accepted from the studies of authors Nguyen Duy Thanh and Cao Hao Thi[46]; Pikkarainen [139]; Shih [149]; Taylor and Todd [159]. The