One-way ANOVA: Vehicle design versus Differential
Method
Null hypothesis All means are equal Alternative hypothesis At least one mean is different Significance level α = 0.05
Equal variances were assumed for the analysis.
Factor Information
Factor Levels Values Distinguishing 2 C9TT, D9TT
Analysis of Variance
Source DF Adj SS Adj MS F-Value P-Value Distinctiveness 1 47.944 47.9444 255.75 0.000
Error 6 1.125 0.1875
Total 7 49,069
Model Summary
R-sq | R-sq(adj) | R-sq(pred) | |
0.432975 | 97.71% | 97.33% | 95.92% |
Means | |||
Differential N | Mean | StDev | 95% CI |
C9TT 4 | 40,528 | 0.570 (39.998, 41.057) | |
D9TT 4 | 45,424 | 0.223 (44.894, 45.953) | |
Maybe you are interested!
-
 Absolute growth rate of experimental chickens over weeks of age
 -
 Evaluation of the effect of DH fertilizer on growth, yield and quality of some fruit trees at Thai Nguyen University of Agriculture and Forestry - 2
 -
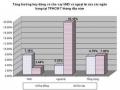 Chart Showing Growth in Deposits and Lending of Commercial Banks in Ho Chi Minh City in the First 7 Months of the Year.
 -
 Evaluation of the effect of DH fertilizer on growth, yield and quality of some fruit trees at Thai Nguyen University of Agriculture and Forestry - 1
 -
 HIV infection status and care and ARV treatment for children under 18 months of age born to infected mothers in Vietnam, 2010-2013 - 19

Pooled StDev = 0.432975
Tukey Pairwise Comparisons
Grouping Information Using the Tukey Method and 95% Confidence Calculation
Distinct N Mean Grouping D9TT 4 45.424 A
C9TT 4 40.528 B
Means that do not share a letter are significantly different.
One-way ANOVA: Test versus Differential
Method
Null hypothesis All means are equal Alternative hypothesis At least one mean is different Significance level α = 0.05
Equal variances were assumed for the analysis.
Factor Information
Factor Levels Values Distinguishing 2 C9TT, D9TT
Analysis of Variance
Source DF Adj SS Adj MS F-Value P-Value Distinctiveness 1 2.05031 2.05031 150.25 0.000
Error 6 0.08187 0.01365
S | R-sq | R-sq(adj) | R-sq(pred) |
0.116815 | 96.16% | 95.52% | 93.17% |
Means | |||
Differential N | Mean | StDev | 95% CI |
C9TT 4 | 4.3000 | 0.0913 (4.1571, 4.4429) | |
D9TT 4 | 5.3125 | 0.1377 (5.1696, 5.4554) | |
Total 7 2.13219 Model Summary
Pooled StDev = 0.116815
Tukey Pairwise Comparisons
Grouping Information Using the Tukey Method and 95% Confidence Calculation
Differential N Mean Grouping D9TT 4 5.3125 A
C9TT 4 4.3000 B
Means that do not share a letter are significantly different.
One-way ANOVA: Mean versus Mean
Method
Null hypothesis All means are equal Alternative hypothesis At least one mean is different Significance level α = 0.05
Equal variances were assumed for the analysis.
Factor Information
Factor Levels Values Distinguishing 2 C9TT, D9TT
Analysis of Variance
Adj SS Adj MS | F-Value P-Value | |
Difference 1 | 22.2682 22.2682 | 275.89 0.000 |
Error 6 | 0.4843 0.0807 | |
Total 7 | 22.7525 |
Model Summary
R-sq | R-sq(adj) | R-sq(pred) | |
0.284102 | 97.87% | 97.52% | 96.22% |
Differential N | Mean | StDev | 95% CI |
C9TT 4 | 30,179 | 0.349 | (29,831, 30,526) |
D9TT 4 | 33.5155 | 0.1997 | (33.1679, 33.8631) |
Pooled StDev = 0.284102
Tukey Pairwise Comparisons
Grouping Information Using the Tukey Method and 95% Confidence
special N
CalculateMean | Grouping | |
D9TT 4 | 33.5155 | A |
C9TT 4 | 30,179 | B |
Means that do not share a letter are significantly different.
One-way ANOVA: KL Xuong versus Calculating
Method
Null hypothesis All means are equal Alternative hypothesis At least one mean is different Significance level α = 0.05
Equal variances were assumed for the analysis.
Factor Information
Factor Levels Values Distinguishing 2 C9TT, D9TT
Analysis of Variance
DF | Adj SS | Adj MS | F-Value | P-Value | |
Distinction | 1 | 0.28125 | 0.281250 | 45.00 | 0.001 |
Error | 6 | 0.03750 | 0.006250 | ||
Total | 7 | 0.31875 |
Model Summary
S R-sq R-sq(adj) R-sq(pred) 0.0790569 88.24% 86.27% 79.08%
Means Calculation
N Mean StDev 95% CI C9TT 4 1.4250 0.0645 (1.3283, 1.5217)
D9TT 4 1.8000 0.0913 (1.7033, 1.8967)
Pooled StDev = 0.0790569
Tukey Pairwise Comparisons
Grouping Information Using the Tukey Method and 95% Confidence Calculation
Differential N Mean Grouping D9TT 4 1.8000 A
C9TT 4 1.4250B
Means that do not share a letter are significantly different.
One-way ANOVA: TL Xuong versus Tinh discriminant
Method
Null hypothesis All means are equal Alternative hypothesis At least one mean is different Significance level α = 0.05
Equal variances were assumed for the analysis.
Factor Information
Factor Levels Values Distinguishing 2 C9TT, D9TT
Analysis of Variance
Source DF Adj SS Adj MS F-Value P-Value Distinctiveness 1 3.6634 3.66343 37.71 0.001
Error 6 0.5828 0.09714
S | R-sq | R-sq(adj) R-sq(pred) |
0.311671 | 86.27% | 83.99% 75.60% |
Total 7 4.2463 Model Summary
Differential N | Mean | StDev | 95% | CI |
C9TT 4 | 9,998 | 0.292 | ( 9,616, | 10,379) |
D9TT 4 | 11,351 | 0.330 | (10,970, | 11,733) |
Pooled StDev = 0.311671
Tukey Pairwise Comparisons
Grouping Information Using the Tukey Method and 95% Confidence Calculation
Distinct N Mean Grouping D9TT 4 11.351 A
C9TT 4 9,998 B
Means that do not share a letter are significantly different.
3. Meat yield at 12 months of age
Descriptive Statistics: Number of songs, Number of motorbikes, Number of motorbikes, Number of car parts, Number of car parts,
...
N | N* | Mean | SE Mean | StDev | Variance | CoefVar | Minimum | Maximum | |
KL song | 8 | 0 | 19,325 | 0.586 | 1,658 | 2,748 | 8.58 | 17,500 | 21,200 |
Kl moc ham | 8 | 0 | 10,675 | 0.420 | 1,188 | 1.411 | 11.13 | 9,300 | 12,100 |
TL moc ham | 8 | 0 | 55,135 | 0.525 | 1,485 | 2.205 | 2.69 | 53,143 | 57,075 |
car design | 8 | 0 | 8,500 | 0.423 | 1,198 | 1,434 | 14.09 | 7,200 | 9,900 |
TL car design | 8 | 0 | 43,802 | 0.863 | 2,442 | 5,962 | 5.57 | 41,143 | 46,698 |
KL refined meat | 8 | 0 | 6.325 | 0.316 | 0.893 | 0.797 | 14.12 | 5,300 | 7,400 |
TL meat | 8 | 0 | 32,594 | 0.648 | 1,834 | 3.363 | 5.63 | 30,286 | 34,906 |
KL Down | 8 | 0 | 2,095 | 0.107 | 0.303 | 0.092 | 14.45 | 1,790 | 2,450 |
TL Down | 8 | 0 | 10,794 | 0.233 | 0.658 | 0.434 | 6.10 | 9,945 | 11,611 |
4. Meat yield at 12 months of age
One-way ANOVA: KL song versus Differential
Method
Null hypothesis All means are equal Alternative hypothesis At least one mean is different Significance level α = 0.05
Equal variances were assumed for the analysis. Factor Information
Factor Levels Values
Difference between C12TT and D12TT Analysis of Variance
Source DFAdj SS Adj MS | F-Value P-Value | |
Difference 1 | 18.6050 18.6050 | 177.19 0.000 |
Error 6 | 0.6300 0.1050 | |
Total 7 | 19.2350 |
Model Summary
S R-sq R-sq(adj) R-sq(pred) 0.324037 96.72% 96.18% 94.18%
Means
Difference N Mean StDev 95% CI C12TT 4 17.800 0.294 (17.404, 18.196)
D12TT 4 20,850 0.351 (20,454, 21,246)
Pooled StDev = 0.324037
Tukey Pairwise Comparisons
Grouping Information Using the Tukey Method and 95% Confidence
N | Mean Grouping | |
D12TT | 4 | 20,850 A |
C12TT | 4 | 17,800 B |
Means that do not share a letter are significantly different.
One-way ANOVA: Kl moc ham versus Calculating differences
Method
Null hypothesis All means are equal Alternative hypothesis At least one mean is different Significance level α = 0.05
Equal variances were assumed for the analysis.
Factor Information
Factor Levels Values
Differentiate 2 C12TT, D12TT
Analysis of Variance
Source DF Adj SS Adj MS F-Value P-Value Distinctiveness 1 9.2450 9.2450 88.05 0.000
Error 6 0.6300 0.1050
S | R-sq R-sq(adj) | R-sq(pred) |
0.324037 | 93.62% 92.56% | 88.66% |
Total 7 9.8750 Model Summary
Distinction | N | Mean | StDev | 95% CI |
C12TT | 4 | 9,600 | 0.294 | (9,204, 9,996) |
D12TT | 4 | 11,750 | 0.351 | (11,354, 12,146) |
Pooled StDev = 0.324037
Tukey Pairwise Comparisons
Grouping Information Using the Tukey Method and 95% Confidence
Mean | Grouping | |
D12TT 4 | 11,750 | A |
C12TT 4 | 9,600 | B |
Means that do not share a letter are significantly different.
One-way ANOVA: TL moc ham versus Calculation
Method
Null hypothesis All means are equal Alternative hypothesis At least one mean is different Significance level α = 0.05
Equal variances were assumed for the analysis.
Factor Information
Factor Levels Values
Differentiate 2 C12TT, D12TT
Analysis of Variance
Source DF Adj SS Adj MS F-Value P-Value Distinctiveness 1 11.730 11.7295 19.00 0.005
Error 6 3.703 0.6172
Total 7 15,433
Model Summary
R-sq R-sq(adj) | R-sq(pred) | |
0.785644 | 76.00% 72.00% | 57.34% |
Distinction | N | Mean StDev | 95% CI |
C12TT | 4 | 53.924 0.833 | (52,963, 54,885) |
D12TT | 4 | 56.346 0.735 | (55,384, 57,307) |
Pooled StDev = 0.785644
Tukey Pairwise Comparisons
Grouping Information Using the Tukey Method and 95% Confidence
Mean | Grouping | |
D12TT 4 | 56,346 | A |
C12TT 4 | 53,924 | B |
Means that do not share a letter are significantly different.