fi(%)
Maybe you are interested!
-
 Frequency Distribution of Test Results No. 2
 -
 Frequency Distribution Table, Frequency, Cumulative Frequency
 -
 Study on species diversity and genetic relationships of the family Gekkonidae in some limestone mountain areas in the Lao People's Democratic Republic - 22
 -
 Study on species diversity and genetic relationships of the family Gekkonidae in some limestone mountain areas in the Lao People's Democratic Republic - 20
 -
 Solution to complete the car tire distribution channel system at Danang Rubber Joint Stock Company - 1
12
9
6
3
0 cm
30 40 50 60 70 80 90 100 110
Figure 3.11 Frequency distribution of growth of all 821 rubber accessions at 15 years of age originating from Rondonia state (Brazil)
Table 3.22 The most vigorous varieties at age 15 in experiments with a selection ratio of 5%
Breed group | Experiment | Born at 15 | ||
Specimen | cm | Compared with control GT1 (%) | ||
RO/A/7/147 | RO/A/7 | SGLK85 | 94.7 | 149.4 |
RO/A/7/165 | RO/A/7 | SGLK85 | 90.6 | 142.9 |
RO/A/7/224 | RO/A/7 | SGLK85 | 90.4 | 142.6 |
RO/A/7/241 | RO/A/7 | SGLK85 | 86.8 | 136.9 |
RO/A/7/254 | RO/A/7 | SGLK85 | 105.1 | 165.7 |
RO/A/7/288 | RO/A/7 | SGLK05 | 86.3 | 139.4 |
RO/A/7/298 | RO/A/7 | SGLK06 | 87.8 | 149.0 |
RO/A/7/383 | RO/A/7 | SGLK85 | 92.9 | 146.5 |
RO/A/7/398 | RO/A/7 | SGLK05 | 84.3 | 136.2 |
RO/A/7/518 | RO/A/7 | SGLK85 | 90.9 | 143.4 |
RO/C/8/16C | RO/C/8 | SGLK05 | 93.1 | 150.3 |
RO/C/8/206 | RO/C/8 | SGLK85 | 95.1 | 149.9 |
RO/C/8/21 | RO/C/8 | SGLK85 | 91.5 | 144.3 |
RO/C/8/283 | RO/C/8 | SGLK85 | 92.0 | 145.1 |
RO/C/8/339 | RO/C/8 | SGLK04 | 96.6 | 176.5 |
Table 3.22 The most vigorous varieties at age 15 in experiments with a selection ratio of 5% (cont.)
Breed group | Experiment | Born at 15 | ||
Specimen | cm | Compared with control GT1 (%) | ||
RO/C/8/435 | RO/C/8 | SGLK05 | 91.2 | 147.3 |
RO/C/8/47 | RO/C/8 | SGLK85 | 96.2 | 151.7 |
RO/C/8/59 | RO/C/8 | SGLK85 | 88.4 | 139.4 |
RO/C/9/290 | RO/C/9 | SGLK04 | 83.8 | 153.1 |
RO/C/9/33C | RO/C/9 | SGLK03 | 88.4 | 148.3 |
RO/C/9/353 | RO/C/9 | SGLK85 | 87.0 | 137.3 |
RO/C/9/365 | RO/C/9 | SGLK85 | 98.4 | 155.2 |
RO/C/9/83 | RO/C/9 | SGLK96 | 75.9 | 144.1 |
RO/CM/10/268 | RO/CM/10 | SGLK85 | 99.4 | 156.7 |
RO/CM/10/320 | RO/CM/10 | SGLK85 | 87.6 | 138.1 |
RO/CM/10/481 | RO/CM/10 | SGLK04 | 96.0 | 175.4 |
RO/CM/10/661 | RO/CM/10 | SGLK03 | 86.9 | 145.8 |
RO/J/5/69 | RO/J/5 | SGLK85 | 90.4 | 142.6 |
RO/J/6/104 | RO/J/6 | SGLK94 | 90.3 | 159.8 |
RO/J/6/23 | RO/J/6 | SGLK96 | 80.2 | 152.1 |
RO/J/6/49 | RO/J/6 | SGLK05 | 84.3 | 136.2 |
RO/J/6/57 | RO/J/6 | SGLK96 | 81.4 | 154.4 |
RO/JP/3/111 | RO/JP/3 | SGLK94 | 76.6 | 135.6 |
RO/JP/3/334 | RO/JP/3 | SGLK04 | 107.0 | 195.5 |
RO/JP/3/37C | RO/JP/3 | SGLK05 | 89.9 | 145.2 |
RO/JP/3/473 | RO/JP/3 | SGLK91 | 77.9 | 121.4 |
RO/JP/3/501 | RO/JP/3 | SGLK04 | 85.1 | 155.5 |
RO/OP/4/100 | RO/OP/4 | SGLK06 | 84.4 | 143.2 |
RO/OP/4/17C | RO/OP/4 | SGLK03 | 84.2 | 141.2 |
RO/OP/4/85 | RO/OP/4 | SGLK85 | 86.8 | 136.9 |
RO/OP/4/98 | RO/OP/4 | SGLK85 | 90.5 | 142.8 |
In terms of latex yield, 616 rubber accessions from sub-regions of Rondonia state (Brazil) were capable of producing latex, corresponding to 75% of the 821 accessions evaluated in 8 experiments. The results of the analysis of variance (ANOVA) showed that the latex yield between accessions in the experiments had a significant difference with a probability of P ≤ 0.001 and between groups of accessions from the experiments also had a significant difference with a probability of P ≤ 0.01 (Appendix 11); therefore, the latex yield of accessions in the experiments and between groups of accessions from the experiments was not uniform, so the latex yield data were included in the analysis according to the normal distribution method using the λ 2 test .
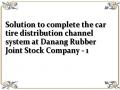
The results of the analysis using the multiple-choice test (λ 2 ) obtained in Table 3.23 and Figure 3.12 showed that most of the latex productivity of the samples in the experiments followed the distribution rule with the frequency completely skewed towards one side of low latex productivity and had a significant difference with a probability from P ≤ 0.05 to P ≤ 0.001; the level of variation between the samples in the experiments was very large, reaching from 56% to 124%. However, the samples in the two experiments SGLK96 and SGLK05 did not have a significant difference, but the samples still followed the distribution rule with the frequency of samples skewed towards one side of low latex productivity. Therefore, the average value cannot represent the latex yield of the experimental samples, the average latex yield in the experiments fluctuated from 5.0 g to 16.1 g/c/c with a difference of 3.4 g to 10.4 g/c/c. Similarly, the results presented in Table 3.23 and Figure 3.13 showed that the latex yield characteristics of 616 samples from 8 experiments also followed the general distribution rule with the frequency of samples completely skewed to one side of low latex yield and the difference was very significant at the confidence level P ≤ 0.001; the average latex yield reached 7.9 g/c/c with a difference of 7.1 g and the variation between samples was very large reaching 89.8%, so the average value did not represent the latex yield of the samples. Wild rubber varieties originating from Rondonia state (Brazil) evaluated in experiments mostly had very low latex yield compared to the GT1 control, a clone from Wickham's genetic source. The results in Table 3.24 identified 31 varieties with the best 4-year average latex yield in experiments according to the selection ratio.
Filtered at 5%, the average latex yield over 4 years was from 13.4 g to 63.9 g/c/c, equivalent to 53.1% to 161.2% compared to the GT1 control clone; of which, 7 varieties had very high latex yield, equal to and exceeding 61% compared to the GT1 control clone but only accounted for 1% of the total 616 varieties evaluated.
In general, the wild rubber tree genetic resources from Rondonia state (Brazil) have very low latex yield compared to the clones from Wickham's genetic resources; the distribution characteristics of latex yield of the experimental samples as well as all 616 samples of 8 experiments follow the same general distribution rule with the frequency of samples completely skewed to one side of low latex yield and the difference is very significant, so the average value does not represent the latex yield of the experimental samples, the number of samples with the highest latex yield was determined to include 31 samples and these are very valuable samples for the purpose of growing wood-latex rubber.
Table 3.23 Testing the distribution rule by multiple choice test (λ 2 ) on latex yield of rubber varieties originating from Rondonia state on experiments
Average latex yield 4 years (g/cm/cm) | |||||||
Experiment | Number of samples | Medium | Smallest | Biggest | Standard deviation (S) | Coefficient of variation (CV%) | Multiple choice (λ 2 ) |
SGLK85 | 276 | 5.0 | 1.2 | 30.3 | 3.4 | 68.6 | 53.1 *** |
SGLK91 | 35 | 7.3 | 1.5 | 45.0 | 9.0 | 123.9 | 7.98 ** |
SGLK94 | 71 | 6.0 | 1.3 | 28.5 | 5.0 | 82.7 | 6.39 ** |
SGLK96 | 33 | 8.8 | 2.3 | 30.9 | 5.6 | 64.2 | 2.43 NS |
SGLK03 | 52 | 7.7 | 1.9 | 38.5 | 6.7 | 87.4 | 6.60 ** |
SGLK04 | 48 | 16.1 | 3.7 | 63.9 | 10.4 | 64.7 | 4.45 * |
SGLK05 | 61 | 14.1 | 1.3 | 40.6 | 7.8 | 55.5 | 3.00 NS |
SGLK06 | 40 | 12.4 | 4.4 | 35.9 | 7.4 | 59.7 | 6.52 ** |
Total | 616 | 7.9 | 1.2 | 63.9 | 7.1 | 89.8 | 195.5 *** |
NS is a non-significant difference with probability P > 0.05; a significant difference with probability P ≤ 0.05*, P ≤ 0.01** and P ≤ 0.001***.
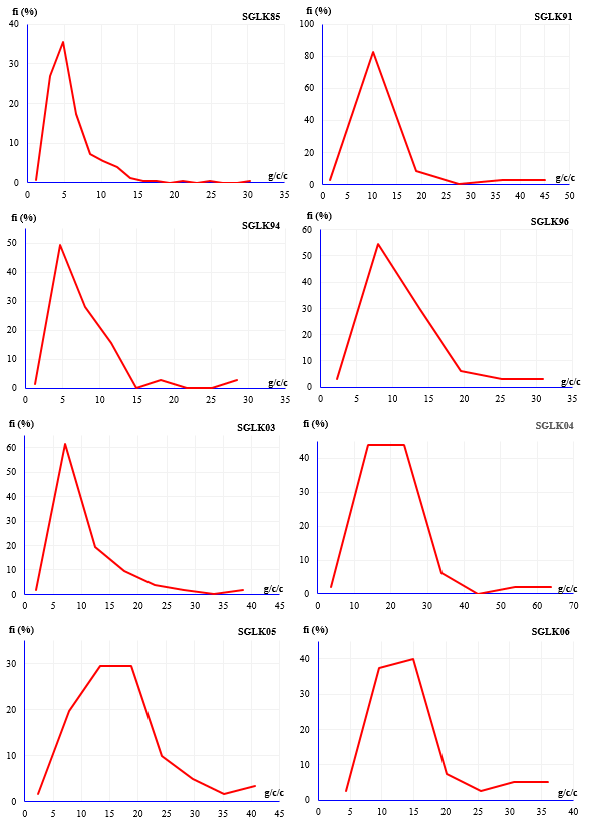
Figure 3.12 Frequency distribution of the 4-year average latex yield of the varieties originating from Rondonia state (Brazil) evaluated in the experiments
fi(%)
30
25
20
15
10
5
0
0 5 10 15 20 25 30 35 40 45 50 55 60 65
g/c/c
Figure 3.13 Frequency distribution of the average 4-year latex yield of 616 rubber accessions originating from Rondonia state (Brazil)
Table 3.24 Varieties with the highest average latex yield over 4 years in experiments at a selection rate of 5%
Breed group | Experiment | Average latex yield 4 years | ||
Specimen | g/c/c | Compared with control GT1 (%) | ||
RO/A/7/15 | RO/A/7 | SGLK96 | 30.9 | 74.3 |
RO/A/7/298 | RO/A/7 | SGLK06 | 32.5 | 84.7 |
RO/A/7/307 | RO/A/7 | SGLK05 | 24.7 | 58.8 |
RO/A/7/75C | RO/A/7 | SGLK03 | 18.3 | 58.9 |
RO/C/8/163 | RO/C/8 | SGLK85 | 30.3 | 120.1 |
RO/C/8/272 | RO/C/8 | SGLK85 | 16.9 | 67.0 |
RO/C/8/76 | RO/C/8 | SGLK94 | 27.7 | 88.8 |
RO/C/9/117 | RO/C/9 | SGLK94 | 16.7 | 53.5 |
RO/C/9/20C | RO/C/9 | SGLK05 | 40.6 | 96.7 |
RO/C/9/398 | RO/C/9 | SGLK05 | 30.0 | 71.6 |
RO/C/9/51C | RO/C/9 | SGLK03 | 27.5 | 88.3 |
RO/C/9/72 | RO/C/9 | SGLK85 | 13.4 | 53.1 |
RO/CM/10/481 | RO/CM/10 | SGLK04 | 25.6 | 64.7 |
Table 3.24 The varieties with the highest average latex yield over 4 years in experiments with a selection ratio of 5% (cont.)
Breed group | Experiment | Average latex yield 4 years | ||
Specimen | g/c/c | Compared with control GT1 (%) | ||
RO/CM/11/452 | RO/CM/11 | SGLK04 | 46.4 | 117.2 |
RO/CM/11/6 | RO/CM/11 | SGLK85 | 19.4 | 76.9 |
RO/CM/12/26 | RO/CM/12 | SGLK91 | 45.0 | 152.9 |
RO/CM/12/54 | RO/CM/12 | SGLK91 | 35.5 | 120.7 |
RO/J/5/3C | RO/J/5 | SGLK04 | 28.6 | 72.2 |
RO/J/5/42 | RO/J/5 | SGLK04 | 31.5 | 79.6 |
RO/J/5/44 | RO/J/5 | SGLK06 | 22.5 | 58.6 |
RO/JP/3/210 | RO/JP/3 | SGLK06 | 35.9 | 93.6 |
RO/JP/3/24C | RO/JP/3 | SGLK03 | 21.8 | 69.9 |
RO/JP/3/334 | RO/JP/3 | SGLK04 | 63.9 | 161.2 |
RO/JP/3/37C | RO/JP/3 | SGLK05 | 40.2 | 95.8 |
RO/JP/3/473 | RO/JP/3 | SGLK91 | 17.3 | 58.6 |
RO/JP/3/495 | RO/JP/3 | SGLK85 | 14.1 | 55.8 |
RO/JP/3/61C | RO/JP/3 | SGLK03 | 38.5 | 123.7 |
RO/JP/3/73C | RO/JP/3 | SGLK05 | 26.3 | 62.6 |
RO/OP/4/100 | RO/OP/4 | SGLK06 | 27.2 | 71.0 |
RO/OP/4/131 | RO/OP/4 | SGLK94 | 28.5 | 91.5 |
RO/OP/4/23C | RO/OP/4 | SGLK06 | 27.3 | 71.1 |
Comparison of the agronomic value of wild rubber tree genetic resources from Rondonia state (Brazil) conserved in Vietnam with other genetic resources originating from the Amazon basin was evaluated on small-scale experiments in many different countries. The latex yield of wild sources all had very low latex yield, the average latex yield after 4 years was only 32.5% compared to the popular clone RRIM 600 in Thailand (RRIT, 2002) and the average after 3 years of 379 accessions was 25.2% compared to the clone GT 1 in Ivory Coast (Clement-Demange et al., 2002). Evaluation on
In the IRRDB'81 germplasm in Malaysia and Indonesia, the average 8-year latex yield of all cultivar groups from the IRRDB'81 germplasm was lower than that of the Wickham clones, but the germplasm from Rondonia state gave higher latex yield than the germplasm from Acre and Mato Grosso states (Aidi et al., 2002; Ramli et al., 2004); in China, the latex yield of the IRRDB'81 germplasm was only 15.1% - 88.7% compared to the RRIM 600 clone (Hu et al., 2005).
The potential of the rubber germplasm collection was most recently collected in 1995 by the Rubber Research Institute of Malaysia (RRIM) in the state of Amazonas, Brazil. The results of agronomic evaluation of the accessions of 6 species of the genus Hevea in this collection showed that most of the accessions had low latex yield, 81% of the accessions had latex yield lower than 25 g/c/c; however, all agronomic traits of H. brasiliensis were superior to the other 5 species of the genus Hevea , the evaluation of the agronomic characteristics of this genepool is very important to select potential accessions as well as to preserve genetic variation; In addition, the 1995 genetic source has almost good disease resistance, so this new source of material is very valuable for improving varieties and breeding rubber - latex in Malaysia (Adifaiz et al., 2018).
In addition, the evaluation of the IRRDB'81 genetic resources in Africa showed that latex yield had a large variation and the intrinsic nature of the accessions accounted for 81% of the total variation (Clement-Demange et al., 1997); Nkengafac and Nkumbe (2021), analysis of leaf phenotype of accessions from the IRAD Ekona (Cameroon) gene pool collection of 36 accessions showed that all leaf characteristics were different; the proportion of variable components accounted for 88% of the total variation and the accessions were divided into 6 genetic clusters; therefore, research on leaf morphology will also contribute to the assessment of genetic diversity and the expansion of the genetic pool in breeding programs. Similarly, in Vietnam, the IRRDB'81 genetic resource also recorded variation due to the samples themselves with a rate of 83% to 96% and the study suggested that the large variation contributed to enriching the genetic resource and