1.1.4.3. Impact of climate change on sectors
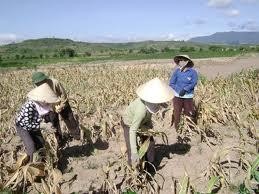
a) Impact on food production
- Yields of some food crops are expected to increase slightly in high and mid latitudes with temperatures increasing by 1-3 0 C.
- At low latitudes, especially in tropical monsoon regions, with a temperature increase of 1 – 2 0C , food productivity is expected to decrease.
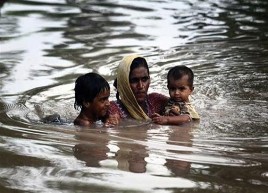
b) Impact on coastal zones
- Coastal zones are more at risk than other zones from erosion. This effect is amplified by the increase of other human pressures.
- Every year, millions of people are flooded by rising sea levels, especially in low-lying, densely populated areas in the deltas of Asia, Africa and small islands.
c) Impact on industry and residents
- Many industrial zones and coastal residential areas in river deltas are particularly sensitive to the increase in extreme weather due to climate change.
- Many poor communities, especially in areas prone to natural disasters and extreme weather events, may face serious risks and losses.
d) Impact on health
The health of millions of people has declined, even seriously.
Although climate change brings some benefits to some temperate regions, such as reducing deaths from cold, it is generally negative, due to rising temperatures.
e) Impact on water resources
- The impact of climate change on water resources is the most serious, considering each region as well as each basin.
- On a global scale, climate change amplifies the risk of water shortages. On a regional scale, climate change leads to water losses due to melting glaciers and reduced snow cover.
- Changes in temperature and precipitation lead to changes in streamflow. Streamflows are expected to decline by 10–40% by mid-century in high latitudes and the humid tropics, including densely populated areas of East Asia and Southeast Asia, and by 10–30% in dry mid-latitudes and the tropics due to reduced precipitation and increased evapotranspiration. Drought areas are expected to increase, affecting many related sectors: agriculture, water supply, production and health.
- There will be a significant increase in future rainfall-related disasters in some areas, including those projected to experience a decrease in average rainfall. Increased flood risk is likely to pose a challenge to social, infrastructure and water quality issues. Up to 20% of the population will be living in areas with increased flood risk by the 2080s. The increase in the frequency and severity of floods and droughts will undoubtedly have negative impacts on sustainable development.
1.2. Current status
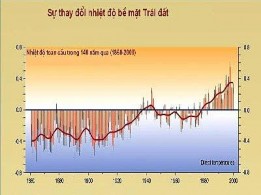
1.2.1. Status of global climate change, recent trends and current situation
The average temperature of the Earth has now increased by 0.74 o C, sea level
increased by about 20 cm compared to 1850, the highest in the past 10,000 years. Natural disasters, extreme weather events and extreme weather events such as storms, floods, droughts... are occurring with increasing intensity, frequency, abnormality and severity [18].
| |
|
|

Maybe you are interested!
-
 Impact of Socio-Economics and Climate Change on Tourism Resources
 -
 Areas, Sectors and Subjects Vulnerable to Climate Change Impacts in Quang Ninh Province
 -
 Study on assessing the impact of climate change on national highways in the Central region - 18
 -
 Study on the impact of floods and droughts on agricultural land use in Quang Dien district, Thua Thien - Hue province in the context of climate change - 24
 -
 Study on assessing the impact of climate change on national highways in the Central region - 2
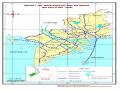
Figure 1.4. Climate change affects every region and area globally.
Source: According to Truong Quang Hoc (editor), 2012. Vietnam, nature, environment and sustainable development
1.2.2. Climate change in Vietnam
1.2.2.1. Trends of Climate Change in Vietnam
Scientific data have shown that Vietnam is a country that is particularly vulnerable to the negative impacts of climate change (UN Vietnam, 2009). In order to respond appropriately to these impacts, it is important to understand the climate change situation in Vietnam over a long period of time, from the past to the present and the future [48].
Climate change is becoming increasingly evident in Vietnam. Climate change, manifested by global warming and rising sea levels, is one of the greatest challenges facing humanity in the 21st century. The increase in average temperature, rainfall, sea level and other extreme weather events is becoming increasingly evident in Vietnam. Temperatures have been steadily increasing. During the period 1900–2000, the average annual temperature increased by 0.1 o C per decade. Summers are getting hotter with average temperatures increasing by about 0.1–0.3 o C per decade (UNDP, 2007). Average temperatures will increase faster in the North than in the South; in winter, average temperatures will increase faster and more than in summer (MONRE, 2009). The above data show a warming trend in Vietnam. Over the past 70 years, the average annual temperature has increased by about 0.5 o C [5; 50]
Average annual rainfall in the rainy season has increased, and will continue to increase, while dry season rainfall is predicted to decrease. According to the Ministry of Natural Resources and Environment (2009), changes in rainfall are quite complex and specific to season and region. Average monthly rainfall has decreased nationwide in July and August (corresponding to the dry season) and increased from September to November (the rainy season). The change in rainfall is also not the same across regions: average annual rainfall has decreased in the North while it has increased in the South. [5]
The number of cold spells has decreased significantly over the past two decades . During the period 1994-2007, there were about 15-16 cold spells each year, equivalent to 56% of the average value of many previous years. The current cold spell also leads to severe cold spells such as the cold spell that lasted for 38 consecutive days in January and February 2008. This has caused significant damage to agricultural production [51].
Typhoon patterns are changing and high intensity typhoons are becoming more frequent in Vietnam . The number of typhoons making landfall in Vietnam increased between the 1950s and 1980s but decreased significantly in the 1990s (UNDP, 2007). The month with the most typhoons has shifted from August in the 1950s to November in the 1990s. The path of the typhoons has gradually shifted southwards and many typhoons have unusual paths (Ministry of Natural Resources and Environment, 2003)[3, 50].
Tropical depressions have been, are and will appear more frequently, with greater intensity in Vietnam . It is predicted that storms and tropical depressions with high wind speeds will appear more frequently and last longer. Storms that used to occur once every 30 years may now appear more frequently, about once every 10 years (Government Office and Ministry of Natural Resources and Environment, 2009).
Several studies have demonstrated sea level rise in Vietnam. Sea levels rose about 20cm during the period 1958 - 2007 (Ministry of Natural Resources and Environment, 2009) and are rising at a rate of about 3mm per year during the period 1993-2008. This is consistent with the general global trend. Coastal erosion has also occurred, for example in Nam Can District, Ca Mau Province, 600ha of land was eroded, in some places a strip of land up to 200m long was lost (UNDP, 2007). [44]
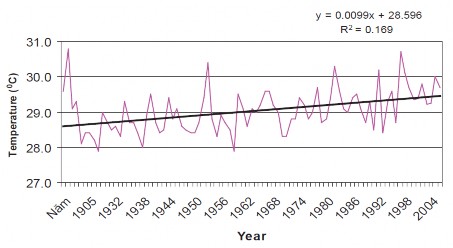
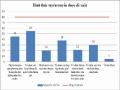
Hanoi Measuring Station
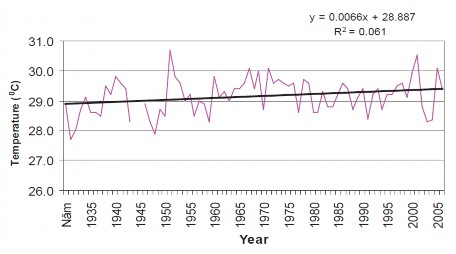
Da Nang Measuring Station
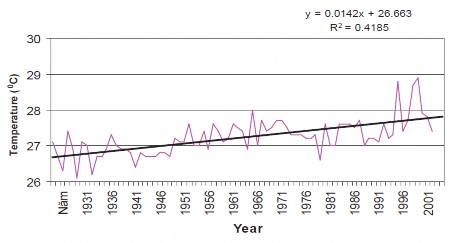
Tan Son Nhat Measuring Station
Figure 1.5. Average annual temperature increase in the period 1930-200 (Institute of Climate Change, 2009)
DHmax DHmean DHmin Linear (DHmax) Linear (DHmean) Linear (DHmin)
60.0
50.0
40.0
30.0
Length (cm)
20.0
10.0
0.0
-10.0
-20.0
-30.0
1960 1965 1970 1975 1980 1985 1990 1995 2000 2005
Time (year)
Figure 1.6. Sea levels have risen about 20 cm over the past 50 years (Ministry of Natural Resources and Environment, 2009)
Climate change scenarios in Vietnam
In 2011, the second scenario of climate change and sea level rise in Vietnam was issued (Ministry of Natural Resources and Environment, 2011) [8].
Average annual temperature (dT in 2100 compared with 1980-1999)
Medium emission scenario: Temperature increases from 1.9 - 3.1 0 C across most of the country, with the highest increase being the area from Ha Tinh to Quang Tri with an increase of over 3.1 0 C. Part of the Central Highlands and Southwest regions has the lowest increase, from 1.6 - 1.9 0 C.
Annual extreme temperatures ( dT in 2100 compared to 1980-1999 )
Medium scenario: Average Tm increases from 2.2-3.0 0 C, while average Tx increases from 2.2-3.5 0 C. The Northeast, Northern Delta and Southern Central Highlands are the areas where extreme temperatures increase faster than other areas of our country. The number of hot days increases from 10-20 days in most of the country, the Northern mountainous areas and Central Highlands have a smaller increase, from 5-10 days.
Seasonal rainfall ( dR in 2100 compared to 1980-1999 ) Medium emissions scenario:
- Winter: Rainfall increases in the North and decreases in the South.
- Spring: Rainfall decreases nationwide
- Summer: Rainfall increases a lot in the North, increases a little in the South
- Autumn: Rainfall increases slightly in the North and increases more from Nghe An onwards, especially in the South Central region.
The general increase in annual rainfall in Vietnam is from 2-7%. The Central Highlands is the region with a lower increase than other regions in the country, with an increase of about less than 1 to nearly 3%. In some places along the Central Coast, annual rainfall has increased by nearly 10%.
Maximum daily rainfall in the North could increase by about 50% compared to the period 1980-1999 and by about 20% in the North Central region. In contrast, maximum daily rainfall would decrease in the South Central region, the Central Highlands and the South, with a decrease of about 10-30%. However, in different regions, abnormal daily rainfall could appear with rainfall double the current record.
Sea level rise ( dR in 2100 compared to 1980-1999 )
Low emission scenario: Sea level rise is highest in the area from Ca Mau to Kien Giang (54-72cm); lowest in Mong Cai area (42-57cm). Average for the whole of Vietnam: 49-64cm.
Medium emission scenario : Sea level rise is highest in the area from Ca Mau to Kien Giang (62-82cm); lowest in Mong Cai area (49-64cm). Average for the whole of Vietnam: 57-73cm.
High emission scenario: Sea level rise is highest in the area from Ca Mau to Kien Giang (85-105cm); lowest in Mong Cai area (66-85cm). Average for the whole of Vietnam: 78-95cm.
Sea level rise ( dR in 2100 compared to 1980-1999 )
Source: Ministry of Natural Resources and Environment, 2011
1.2.2.2. Impacts and consequences of climate change in Vietnam
Similar to the general picture globally, in Vietnam, over the past 50 years, the average annual temperature has increased by about 0.5 o C, and sea levels have risen by about 20 cm. The El-Nino and La-Nina phenomena are increasingly having a strong impact on Vietnam.