LIST OF FIGURES
Figure 1.1. Diagram of the interaction between climate change and ecosystem components 11
Figure 2.1. Route map of National Highway 49B 22
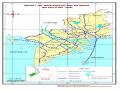
Figure 2.2. Ho Chi Minh route map 28
Maybe you are interested!
-
 Study on assessing the impact of climate change on national highways in the Central region - 18
 -
 Study on the impact of floods and droughts on agricultural land use in Quang Dien district, Thua Thien - Hue province in the context of climate change - 24
 -
 Assessing the impact of climate change on livelihood security of ethnic minority communities in Dak Lak - 13
 -
 Impact of Socio-Economics and Climate Change on Tourism Resources
 -
 Assessing vulnerability and proposing solutions to enhance resilience to climate change in Lao Cai city, Lao Cai province - 11
Figure 3.1. Average temperature variation in July in Hue 33
Figure 3.2. Variation of highest temperature in July at Hue station 33
Figure 3.3. Variation of lowest temperature in July at Hue station 34
Figure 3.4. Variation of lowest temperature in January at Hue station 34
Figure 3.5. Average annual rainfall curve of Hue station 35
Figure 3.6. Highest daily rainfall curve at Hue station 35
Figure 3.8 Variation of flood number at Kim Long station 37
Figure 3.9. Average hourly flood level variation at Kim Long station 37
Figure 3.10. Maximum flood level variation at Kim Long 37 station
Figure 3.11. Average temperature variation in June at Thanh Hoa station 44
Figure 3.12. Variation of highest temperature in June at Thanh Hoa station 44
Figure 3.13. Variation of highest temperature in June at Thanh Hoa station 44
Fig. 3.15. Average temperature variation in July of each year at Tay Hieu station 45
Fig. 3.16. Variation of highest temperature in July of each year at Tay Hieu station 45
Fig. 3.17. Variation of lowest temperature in July of each year at Tay Hieu station 45
Fig. 3.19. Average temperature variation in June over the years at Ky Anh station 46
Fig. 3.20. Variation of highest temperature in June of Ky Anh station 47
Fig. 3.21. Variation of lowest temperature in June of each year at Ky Anh station 47
Fig. 3.22. Variation of lowest temperature in January of each year at Ky Anh station 47
Fig. 3.23. Average temperature variation in April over the years at Khe Sanh station 48
Fig. 3.24. Variation of highest temperature in April of each year at Khe Sanh station 48
Fig. 3.25. Variation of lowest temperature in April of each year at Khe Sanh station 48
Fig. 3.26. Variation of lowest temperature in January of each year at Khe Sanh station 48
Figure 3.28. Variation of lowest temperature in April in years at Kon Tum station 49
Figure 3.29. Variation of lowest temperature in January of each year at Kon Tum station 49
Fig. 3.31. Evolution of average annual rainfall at Thanh Hoa station 51
Fig. 3.32. Development of the number of rainy days in a year at Thanh Hoa station 51
Fig. 3.33. Development of maximum daily rainfall at Tay Hieu station 52
Fig. 3.34. Changes in total rainfall at Tay Hieu station 52
Fig. 3.35. Development of the number of rainy days in a year at Tay Hieu station 52
Fig. 3.36. Development of maximum daily rainfall at Ky Anh station 53
Fig. 3.37. Total rainfall variation at Ky Anh station 53
Fig. 3.39. Development of maximum daily rainfall at Khe Sanh station 54
Fig. 3.40. Evolution of total rainfall at Khe Sanh station 54
Fig. 3.41. Development of the number of rainy days in a year at Khe Sanh station 54
Fig. 3.43. Average hourly flood level variation at Cam Thuy station 55
Fig. 3.44. Development of maximum flood level at Cam Thuy station 56
Fig. 3.45. Development of the number of floods over the years at Nghia Khanh station 56
Fig. 3.46. Average hourly flood level changes over the years at Nghia Khanh station 56
Fig. 3.47. Development of maximum flood levels in each year at Nghia Khanh station 56
Fig. 3.48. Development of the number of floods over the years at Do Luong station 57
Fig. 3.49. Average hourly flood level changes over the years at Do Luong station 57
Fig. 3.50. Development of maximum flood levels in years at Do Luong station 57
Fig. 3.51. Development of the number of floods over the years at Son Diem station 57
Fig. 3.52. Average hourly flood level changes over the years at Son Diem station 58
Fig. 3.55. Evolution of maximum average flood level over the years at Son Diem station 58
Fig. 3.56. Development of the number of floods over the years at Hoa Duyet station 58
Fig. 3.57. Average hourly flood level changes over the years at Hoa Duyet station 58
Fig. 3.58. Evolution of the maximum average flood level over the years at Hoa Duyet station ..58 Fig. 3.59. Evolution of the number of floods over the years at Cam Le station 59
Fig. 3.60. Average hourly flood level changes over the years at Cam Le station 59
Fig. 3.61. Evolution of the maximum hourly average flood level in years at Cam Le station.59 Fig. 3.62. Low flooded sections have had their slopes reinforced with built-up rubble 67
Fig. 3.63. The deeply flooded sections have been marked with warning water level stakes 67.
Fig. 3.64. Floods cause subsidence of roadbed, potholes, and potholes 68
Fig. 3.65. The historic flood of 1999 68
Fig. 3.66. Reinforcement with reinforced concrete piles in Thuan An to prevent erosion 69
Fig. 3.68. Road surface cracks due to heat and rainwater 73
Fig. 3.69. Weathered rocks rolling down the road 73
Fig. 3.70. Rain and high humidity cause rapid deterioration of road surfaces 74
Fig. 3.71. Water level indicator column indicating flooded road section on HCM 75 road
Fig. 3.72. Rain carries rocks and rotten trees onto the road 75
Fig. 3.73. Many points on Ho Chi Minh road continue to be at risk of landslides 75
INTRODUCTION
1. Urgency of the topic
Climate change (CC), first and foremost global warming and rising sea levels (SLR), is the most serious challenge facing humanity in the 21st century. CC has truly impacted all areas, including natural resources, environment, socio-economics (SE) and human health. Natural disasters and extreme climate events as a consequence of CC are now occurring more and more frequently and severely everywhere in the world. CC has a direct impact on the millennium development goals (MDGs) and is considered a major challenge for sustainable development (SDGs) [IPCC, 2007].
Vietnam is considered one of the few countries most strongly affected by climate change, in particular, the Mekong Delta is one of the three deltas in the world most vulnerable to sea level rise [WB, 2007; Ministry of Natural Resources and Environment, 2008, 2009, 2011].
The impact of sea level rise is very serious because Vietnam has a coastline of 3,260 km, more than 1 million km2 of territorial waters, over 3,000 nearshore islands and two offshore archipelagos, many low-lying coastal areas, so these areas are subject to severe flooding every year during the rainy season and drought, and saltwater intrusion in the dry season. Climate change and sea level rise will aggravate the above situation, increasing the flooded area, causing difficulties in drainage, increasing coastal erosion and salinization of water sources, affecting agricultural production.
industrial and domestic water, posing great risks to coastal construction works such as roads, ports, factories, urban areas and residential areas. The regions and areas expected to be most affected by the above extreme climate phenomena are the Central coastal strip, the Northern mountainous region, the Northern Delta and the Mekong Delta.
The Central strip of land is surrounded by mountain ranges running along the West coast and the East coast, the area with the narrowest East-West width in Vietnam (about 50 km) and located in Quang Binh province. The rivers here flow in the Northwest - Southeast direction to the sea, often with narrow riverbeds, large slopes, and small basin areas, so with relatively large amounts of rain falling, they will create
floods, rising rapidly and causing flooding in the low-lying eastern plains. With such harsh terrain and climate, the Central region is a vulnerable area to the impacts of climate change.
The transport sector in general and the road transport sector in particular are directly affected by climate change. In fact, in recent years, the number of major storms, flash floods, landslides, floods, droughts, etc. has tended to increase significantly and the consequences of natural disasters are extremely severe. According to statistics, each year Vietnam suffers a loss of about 1.5% of GDP due to natural disasters. According to the Standing Office of the Central Steering Committee for Flood and Storm Prevention, in 2009, the damage caused by storms and floods was 23,745 billion VND, in 2008 the damage caused by natural disasters was estimated at about 13,301 billion VND, in 2007 the estimated damage was 11,514 billion VND.
Therefore, "Researching and assessing the impact of climate change and proposing response solutions for the Vietnam National Highway system is very necessary. However, research for the entire Vietnam National Highway system is very difficult and time-consuming due to its scope spanning across the country with a length of thousands of kilometers. Therefore, to suit the research time and requirements of the thesis, I chose the Ho Chi Minh Road section in the Central region, National Highway 49B, Thua Thien Hue province for research.
2. Research objectives
- Identify the manifestations and trends of climate change in the research area.
- Assess the impact of climate change and the risk of damage due to climate change on the two studied national highways.
- On that basis, propose orientations to respond to climate change for coastal and mountainous national highways, contributing to the implementation of the National Target Program on Climate Change Response of the Transport sector.
3. Research object and scope
3.1. Research subjects
The main research object of the thesis is the climatic factors and national highway system of the Central research area.
3.2. Scope of research
3.2.1. Time range
The thesis was conducted from April 2013 to December 2013. Data on climate change assessment, natural disasters/weather phenomena, extreme climate and sea level rise in the Central region were analyzed from 1991 to 2010.
3.2.2. Spatial scope
The spatial scope of the study includes two National Highways:
- Ho Chi Minh Road from Thanh Hoa to Quang Nam Pass. The research area is narrow but stretches through the provinces of Thanh Hoa, Nghe An, Ha Tinh, Quang Binh, Quang Tri, Thua Thien Hue, and Quang Nam.
- National Highway 49B runs from the Thac Ma River junction, Quang Tri to Tu Hien estuary, Thua Thien Hue province. The national highway runs close to the sea and the largest lagoon system in Southeast Asia (Tam Giang lagoon, Thanh Lam lagoon, Ha Trung lagoon and Cau Hai lagoon) with a rich ecosystem and beautiful natural scenery.
4. Significance of the topic 4.1. Scientific significance
Based on the interdisciplinary-system approach and IPCC guidelines, concretized in the conditions of Vietnam, the thesis has built a scientific and practical basis contributing to the development and implementation of the national target program to respond to climate change, including:
- Assess climate change in the past, current situation and future climate change scenarios in the locality where the route passes through;
- Assess the impact of climate change and the risk of damage to areas along the research route;
- Proposing directions for responding to climate change for national highways.
4.2. Practical significance
The results of the thesis can be used for the implementation of the Action Plan to respond to climate change of the research localities in particular and for the road transport sector in particular.
5. Research approach and methods
5.1. Approach
The Systems and Interdisciplinary Ecosystem-based (HST) approach is the dominant approach for current research on sustainable development and climate change.
For the road transport sector, the HST approach helps to explain the interactions between roads and ecosystems, landscapes and adjacent ecoregions, ultimately providing a more complete environmental assessment and reducing the ecological footprint of road development (CBD, 2004; Davenport and Davenport, 2006).
Ecosystems and climate change interact with each other. The impact of climate change, in essence, is an impact on the components of the ecosystem and on the entire ecosystem in general; and responding to climate change is, in principle, also a solution to restore and maintain the balance of the ecosystem. The activities of the road transport sector in general are activities that impact the entire ecosystem. Responding to climate change for the road transport sector is an activity to maintain the balance of the ecosystem (it should be noted that current road transport activities destroy the balance of the ecosystem and are very difficult to restore).
In this thesis, I have used the HST approach as the main approach, considering issues of resources, environment, climate change, socio-economics in a holistic interaction in the socio-ecosystem. However, due to the characteristics of the road transport sector, which is a route that stretches through many localities with many different economic - social - environmental forms, the scope of research on both sides of the route is narrow, so it is difficult to fully research and evaluate climate change. Furthermore, because the research purpose of this thesis is to study the impact of climate change on national highways in the Central region in order to propose response solutions to minimize construction investment costs, maintenance costs and above all, safety for people and vehicles participating in traffic. Therefore, the study of climate change impacts here is
conducted on a case-by-case basis instead of the usual point-by-point basis (studying past, present, and future climate developments; compiling statistics on extreme weather events and their damage to road transport to confirm the presence of climate change in the road transport sector).
5.2. Research methods
5.2.1. Methods of collecting, analyzing and synthesizing published documents (secondary data)
This is a fairly common method and brings high efficiency in the research process. In this study, through contact and work with the authorities to collect documents and data related to the content of the thesis. All data and documents after collection are statistically analyzed and synthesized to provide a general picture of natural conditions, socio-economic as well as the impacts of climate change on the research area.
In addition, this method is also used in the laboratory research stage, helping to clarify the theoretical basis and research directions as well as the research projects that have been carried out. Analyzing and synthesizing documents and previous research projects brings some basic benefits: helping to avoid duplication; inheriting previous research results; knowing the limitations of previous studies and proposing research directions for the topic. These documents are continuously updated, supplemented and analyzed in detail to find appropriate and necessary content.
5.2.2. Field survey method (primary data collection)
Each route is designed based on statistics on meteorological and hydrological conditions and extreme weather events that have occurred in the locality. Therefore, to determine the impact of climate change on the route, the survey is conducted by area and by point. By area means collecting data, surveying the entire route to determine all damaged, flooded, landslide locations... on the route. By point means that from the results of the area study, we must screen and select typical locations that are vulnerable to the impact of climate change. From the research perspective