24
.272 | 1,009 | 97,372 | |||
25 | .260 | .963 | 98,335 | ||
26 | .238 | .880 | 99,215 | ||
27 | .212 | .785 | 100,000 |
Maybe you are interested!
-

 Factors Affecting Employee Job Satisfaction at Mitrudoor Trading & Engineering Company Limited, Da Nang - 17
 -
 General Assessment of Factors Affecting Tourism Development in Vientiane City
 -
 Factors affecting job satisfaction of bank credit officers in Ho Chi Minh City - 13
 -
 Factors affecting job satisfaction of employees of Joint Stock Commercial Bank for Foreign Trade of Vietnam in Ho Chi Minh City - 17
 -
 Assessment of Factors Affecting the Tourism Environment of Da Lat City.
Extraction Method: Principal Component Analysis.
Rotated Component Matrix a
Component | |||||||
1 | 2 | 3 | 4 | 5 | 6 | 7 | |
DTTT4 | .862 | ||||||
DTTT3 | .796 | ||||||
DTTT2 | .790 | ||||||
DTTT1 | .721 | ||||||
SALARY2 | .824 | ||||||
SALARY 1 | .767 | ||||||
SALARY3 | .739 | ||||||
SALARY4 | .737 | ||||||
DIEUUKIEN4 | .797 | ||||||
DIEUUKIEN1 | .790 | ||||||
DIEUKIEN3 | .784 | ||||||
DIEUUKIEN2 | .682 | ||||||
LANHDAO1 | .841 | ||||||
LANHDAO2 | .780 | ||||||
LANHDAO3 | .735 | ||||||
LANHDAO4 | .686 | ||||||
PHUCLOI2 | .805 | ||||||
PHUCLOI1 | .804 | ||||||
PHUCLOI3 | .731 | ||||||
PHUCLOI4 | .614 | ||||||
DONGNGHIEP4 | .782 | ||||||
DONGNGHIEP3 | .721 | ||||||
DONGNGHIEP2 | .705 | ||||||
DONGNGHIEP1 | .675 | ||||||
BCCV1 | .795 | ||||||
BCCV4 | .744 | ||||||
BCCV2 | .678 | ||||||
BCCV3 | .609 | ||||||
Extraction Method: Principal Component Analysis. Rotation Method: Varimax with Kaiser Normalization.
a. Rotation converged in 6 iterations.
KMO Test and Bartlett's Test of Dependent Variable
KMO and Bartlett's Test
.684
103,622
3
.000
Kaiser-Meyer-Olkin Measure of Sampling Adequacy.
Approx. Chi-Square
Bartlett's Test of Sphericity Df Sig.
Total Variance Explained
Component
Initial Eigenvalues | Extraction Sums of Squared Loadings | |||||
Total | % of Variance | Cumulative % | Total | % of Variance | Cumulative % | |
1 | 1,998 | 66,608 | 66,608 | 1,998 | 66,608 | 66,608 |
2 | .559 | 18,637 | 85,245 | |||
3 | .443 | 14,755 | 100,000 | |||
Extraction Method: Principal Component Analysis.
1. Correlation and regression analysis
Correlation analysis
Correlations
LANHDAO | BCCV | DIEUKIEN | DONGNGHIEP | SALARY | ||
LANHDAO BCCV DIEUKIEN DONGNGHIEP SALARY DTTT RETURN HLCV | Pearson Correlation Sig. (2-tailed) N Pearson Correlation Sig. (2-tailed) N Pearson Correlation Sig. (2-tailed) N Pearson Correlation Sig. (2-tailed) N Pearson Correlation Sig. (2-tailed) N Pearson Correlation Sig. (2-tailed) N Pearson Correlation Sig. (2-tailed) N Pearson Correlation Sig. (2-tailed) N | 1 | .050 | .003 | .103 | .164 * |
.542 | .975 | .210 | .045 | |||
150 .050 | 150 1 | 150 .002 | 150 .272 ** | 150 -.006 | ||
.542 | .984 | .001 | .938 | |||
150 | 150 | 150 | 150 | 150 | ||
.003 | .002 | 1 | .036 | -.034 | ||
.975 | .984 | .663 | .683 | |||
150 .103 | 150 .272 ** | 150 .036 | 150 1 | 150 .010 | ||
.210 | .001 | .663 | .902 | |||
150 .164 * | 150 -.006 | 150 -.034 | 150 .010 | 150 1 | ||
.045 | .938 | .683 | .902 | |||
150 .023 | 150 .084 | 150 .119 | 150 .052 | 150 .213 ** | ||
.778 | .306 | .147 | .525 | .009 | ||
150 .014 | 150 .048 | 150 .275 ** | 150 .004 | 150 .025 | ||
.862 | .562 | .001 | .966 | .763 | ||
150 .337 ** | 150 .376 ** | 150 .100 | 150 .386 ** | 150 .506 ** | ||
.000 | .000 | .226 | .000 | .000 | ||
150 | 150 | 150 | 150 | 150 |
Correlations
PHUCLOI | DTTT | HLCV | ||
LANHDAO BCCV DIEUKIEN DONGNGHIEP LUONG PHUCLOI DTTT HLCV | Pearson Correlation Sig. (2-tailed) N Pearson Correlation Sig. (2-tailed) N Pearson Correlation Sig. (2-tailed) N Pearson Correlation Sig. (2-tailed) N Pearson Correlation Sig. (2-tailed) N Pearson Correlation Sig. (2-tailed) N Pearson Correlation Sig. (2-tailed) N Pearson Correlation Sig. (2-tailed) N | .023 | .014 | .337 |
.778 | .862 | .000 | ||
150 | 150 | 150 | ||
.084 | .048 | .376 | ||
.306 | .562 | .000 | ||
150 | 150 | 150 | ||
.119 | .275 | .100 | ||
.147 | .001 | .226 | ||
150 .052 | 150 .004 ** | 150 .386 | ||
.525 | .966 | .000 | ||
150 .213 * | 150 .025 | 150 .506 | ||
.009 | .763 | .000 | ||
150 | 150 | 150 | ||
1 | .015 | .457 | ||
.853 | .000 | |||
150 .015 | 150 1 | 150 .099 ** | ||
.853 | .229 | |||
150 .457 ** | 150 .099 ** | 150 1 | ||
.000 | .229 | |||
150 | 150 | 150 |
Regression analysis
Correlations
HLCV | LANHDAO | BCCV | DIEUKIEN | DONGNGHIEP | ||
Pearson Correlation Sig. (1-tailed) N | HLCV LANHDAO BCCV DIEUKIEN DONGNGHIEP LUONG PHUCLOI DTTT HLCV LANHDAO BCCV DIEUKIEN DONGNGINDEP LUONG PHUCLOI DTTT HLCV LANHDAO BCCV DIEUKIEN DONGNGHIEP LUONG PHUCLOI DTTT | 1,000 | .337 | .376 | .100 | .386 |
.337 | 1,000 | .050 | .003 | .103 | ||
.376 | .050 | 1,000 | .002 | .272 | ||
.100 | .003 | .002 | 1,000 | .036 | ||
.386 | .103 | .272 | .036 | 1,000 | ||
.506 | .164 | -.006 | -.034 | .010 | ||
.457 | .023 | .084 | .119 | .052 | ||
.099 | .014 | .048 | .275 | .004 | ||
. | .000 | .000 | .113 | .000 | ||
.000 | . | .271 | .487 | .105 | ||
.000 | .271 | . | .492 | .000 | ||
.113 | .487 | .492 | . | .332 | ||
.000 | .105 | .000 | .332 | . | ||
.000 | .022 | .469 | .342 | .451 | ||
.000 | .389 | .153 | .073 | .263 | ||
.115 | .431 | .281 | .000 | .483 | ||
150 | 150 | 150 | 150 | 150 | ||
150 | 150 | 150 | 150 | 150 | ||
150 | 150 | 150 | 150 | 150 | ||
150 | 150 | 150 | 150 | 150 | ||
150 | 150 | 150 | 150 | 150 | ||
150 | 150 | 150 | 150 | 150 | ||
150 | 150 | 150 | 150 | 150 | ||
150 | 150 | 150 | 150 | 150 |
Correlations
SALARY | PHUCLOI | DTTT | ||
HLCV | .506 | .457 | .099 | |
LANHDAO | .164 | .023 | .014 | |
BCCV | -.006 | .084 | .048 | |
Pearson Correlation | DIEUKIEN DONGNGHIEP | -.034 .010 | .119 .052 | .275 .004 |
SALARY | 1,000 | .213 | .025 | |
PHUCLOI | .213 | 1,000 | .015 | |
DTTT | .025 | .015 | 1,000 | |
HLCV | .000 | .000 | .115 | |
LANHDAO | .022 | .389 | .431 | |
BCCV | .469 | .153 | .281 | |
Sig. (1-tailed) | DIEUKIEN DONGNGHIEP | .342 .451 | .073 .263 | .000 .483 |
SALARY | . | .004 | .382 | |
PHUCLOI | .004 | . | .427 | |
DTTT | .382 | .427 | . | |
HLCV | 150 | 150 | 150 | |
LANHDAO | 150 | 150 | 150 | |
N | BCCV DIEUKIEN | 150 150 | 150 150 | 150 150 |
DONGNGHIEP | 150 | 150 | 150 | |
SALARY | 150 | 150 | 150 |
PHUCLOI
DTTT
150 150 | 150 150 | 150 150 |
Coefficients a
Model
Unstandardized Coefficients | Standardized Coefficients | t | Sig. | |||
B | Std. Error | Beta | ||||
(Constant) | -.167 | .280 | -.595 | .553 | ||
LANHDAO | .144 | .033 | .223 | 4,323 | .000 | |
BCCV | .167 | .033 | .264 | 5.013 | .000 | |
1 | DIEUKIEN DONGNGHIEP | .036 .200 | .039 .039 | .049 .269 | .924 5,092 | .357 .000 |
SALARY | .242 | .032 | .400 | 7,606 | .000 | |
PHUCLOI | .216 | .035 | .323 | 6,178 | .000 | |
DTTT | .032 | .032 | .054 | 1,021 | .309 | |
Coefficients a
Model
Correlations | Collinearity Statistics | |||||
Zero-order | Partial | Part | Tolerance | VIF | ||
(Constant) | ||||||
LANHDAO | .337 | .341 | .218 | .962 | 1,040 | |
BCCV | .376 | .388 | .253 | .917 | 1,091 | |
1 | DIEUKIEN DONGNGHIEP | .100 .386 | .077 .393 | .047 .257 | .905 .916 | 1.105 1,092 |
SALARY | .506 | .538 | .384 | .923 | 1,083 | |
PHUCLOI | .457 | .460 | .312 | .930 | 1,076 | |
DTTT | .099 | .085 | .052 | .920 | 1,087 | |
Model Fit Assessment
order
R | R Square | Adjusted R Square | Std. Error of the Estimate | Change Statistics | |||
R Square Change | F Change | df1 | |||||
1 | .799a | .638 | .620 | .342 | .638 | 35,789 | 7 |
Model Summary b
Model
Change Statistics | Durbin-Watson | ||
df2 | Sig. F Change | ||
1 | 142a | .000 | 1,867 |
a. Predictors: (Constant), DTTT, DONGNGHIEP, LUONG, LANHDAO, PHUCLOI, BCCV, DIEUKIEN
b. Dependent Variable: HLCV
ANOVA a
Model
Sum of Squares | Df | Mean Square | F | Sig. | ||
1 | Regression Residual Total | 29,272 | 7 | 4,182 | 35,789 | .000 b |
16,592 | 142 | .117 | ||||
45,864 | 149 |
a. Dependent Variable: HLCV
b. Predictors: (Constant), DTTT, DONGNGHIEP, LUONG, LANHDAO, PHUCLOI, BCCV, DIEUKIEN
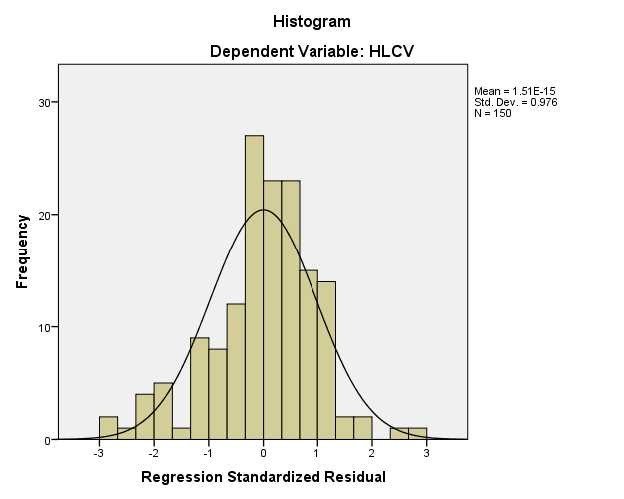
Test for normal distribution of residuals
2. Employee assessment of factors affecting job satisfaction
working at 207 Joint Stock Company
Leader
LANHDAO1 | LANHDAO2 | LANHDAO3 | LANHDAO4 | LANHDAO | ||
N | Valid Missing Mean Mode | 150 | 150 | 150 | 150 | 150 |
0 | 0 | 0 | 0 | 0 | ||
4.13 | 4.03 | 3.79 | 3.83 | 3.94 | ||
5 | 5 | 5 | 4 | 4 |
LANHDAO1
Frequency | Percent | Valid Percent | Cumulative Percent | ||
Totally disagree | 2 | 1.3 | 1.3 | 1.3 | |
Disagree | 15 | 10.0 | 10.0 | 11.3 | |
Valid | Central Agree | 22 | 14.7 | 14.7 | 26.0 |
33 | 22.0 | 22.0 | 48.0 | ||
Totally agree | 78 | 52.0 | 52.0 | 100.0 | |
Total | 150 | 100.0 | 100.0 |
LANHDAO2
Frequency | Percent | Valid Percent | Cumulative Percent | ||
Totally disagree | 2 | 1.3 | 1.3 | 1.3 | |
Disagree | 15 | 10.0 | 10.0 | 11.3 | |
Valid | Central Agree | 25 | 16.7 | 16.7 | 28.0 |
43 | 28.7 | 28.7 | 56.7 | ||
Totally agree | 65 | 43.3 | 43.3 | 100.0 | |
Total | 150 | 100.0 | 100.0 |
LANHDAO3
Frequency | Percent | Valid Percent | Cumulative Percent | ||
Totally disagree | 12 | 8.0 | 8.0 | 8.0 | |
Disagree | 10 | 6.7 | 6.7 | 14.7 | |
Valid | Central Agree | 27 | 18.0 | 18.0 | 32.7 |
50 | 33.3 | 33.3 | 66.0 | ||
Totally agree | 51 | 34.0 | 34.0 | 100.0 | |
Total | 150 | 100.0 | 100.0 |
LANHDAO4
Frequency | Percent | Valid Percent | cumulative Percent | ||
Totally disagree | 5 | 3.3 | 3.3 | 3.3 | |
Disagree | 14 | 9.3 | 9.3 | 12.7 | |
Valid | Central Agree | 32 | 21.3 | 21.3 | 34.0 |
50 | 33.3 | 33.3 | 67.3 | ||
Totally agree | 49 | 32.7 | 32.7 | 100.0 | |
Total | 150 | 100.0 | 100.0 |
Nature of work
Statistics
BCCV1 | BCCV2 | BCCV3 | BCCV4 | BCCV | ||
N | Valid Missing Mean Mode | 150 | 150 | 150 | 150 | 150 |
0 | 0 | 0 | 0 | 0 | ||
3.75 | 3.07 | 3.38 | 3.53 | 3.44 | ||
5 | 2 | 2 | 4 | 4 |
BCCV1
Frequency | Percent | Valid Percent | Cumulative Percent | ||
Totally disagree | 8 | 5.3 | 5.3 | 5.3 | |
Disagree | 16 | 10.7 | 10.7 | 16.0 | |
Valid | Central Agree | 38 | 25.3 | 25.3 | 41.3 |
31 | 20.7 | 20.7 | 62.0 | ||
Totally agree | 57 | 38.0 | 38.0 | 100.0 | |
Total | 150 | 100.0 | 100.0 |
BCCV2
Frequency | Percent | Valid Percent | Cumulative Percent | ||
Totally disagree | 9 | 6.0 | 6.0 | 6.0 | |
Disagree | 53 | 35.3 | 35.3 | 41.3 | |
Valid | Central Agree | 34 | 22.7 | 22.7 | 64.0 |
26 | 17.3 | 17.3 | 81.3 | ||
Totally agree | 28 | 18.7 | 18.7 | 100.0 | |
Total | 150 | 100.0 | 100.0 |
BCCV3
Frequency | Percent | Valid Percent | Cumulative Percent | ||
Totally disagree | 3 | 2.0 | 2.0 | 2.0 | |
Disagree | 42 | 28.0 | 28.0 | 30.0 | |
Valid | Central Agree | 35 | 23.3 | 23.3 | 53.3 |
35 | 23.3 | 23.3 | 76.7 | ||
Totally agree | 35 | 23.3 | 23.3 | 100.0 | |
Total | 150 | 100.0 | 100.0 |
BCCV4
Frequency | Percent | Valid Percent | Cumulative Percent | ||
Totally disagree | 8 | 5.3 | 5.3 | 5.3 | |
Valid | Disagree Central | 25 36 | 16.7 24.0 | 16.7 24.0 | 22.0 46.0 |
Agree | 41 | 27.3 | 27.3 | 73.3 |
Totally agree
Total
40 150 | 26.7 100.0 | 26.7 100.0 | 100.0 |
Working conditions
Statistics
DIEUUKIEN1 | DIEUUKIEN2 | DIEUKIEN3 | DIEUUKIEN4 | DIEUKIEN | ||
N | Valid Missing Mean Mode | 150 | 150 | 150 | 150 | 150 |
0 | 0 | 0 | 0 | 0 | ||
3.66 | 3.92 | 3.66 | 3.67 | 3.73 | ||
3 | 4 | 4 | 4 | 4 |
DIEUUKIEN1
Frequency | Percent | Valid Percent | Cumulative Percent | ||
Totally disagree | 4 | 2.7 | 2.7 | 2.7 | |
Disagree | 6 | 4.0 | 4.0 | 6.7 | |
Valid | Central Agree | 58 | 38.7 | 38.7 | 45.3 |
51 | 34.0 | 34.0 | 79.3 | ||
Totally agree | 31 | 20.7 | 20.7 | 100.0 | |
Total | 150 | 100.0 | 100.0 |
DIEUUKIEN2
Frequency | Percent | Valid Percent | cumulative Percent | ||
Totally disagree | 1 | .7 | .7 | .7 | |
Disagree | 12 | 8.0 | 8.0 | 8.7 | |
Valid | Central Agree | 34 | 22.7 | 22.7 | 31.3 |
54 | 36.0 | 36.0 | 67.3 | ||
Totally agree | 49 | 32.7 | 32.7 | 100.0 | |
Total | 150 | 100.0 | 100.0 |
DIEUKIEN3
Frequency | Percent | Valid Percent | Cumulative Percent | ||
Totally disagree | 5 | 3.3 | 3.3 | 3.3 | |
Disagree | 9 | 6.0 | 6.0 | 9.3 | |
Valid | Central Agree | 51 | 34.0 | 34.0 | 43.3 |
52 | 34.7 | 34.7 | 78.0 | ||
Totally agree | 33 | 22.0 | 22.0 | 100.0 | |
Total | 150 | 100.0 | 100.0 |
DIEUUKIEN4
Frequency | Percent | Valid Percent | Cumulative Percent | ||
Totally disagree | 5 | 3.3 | 3.3 | 3.3 | |
Disagree | 16 | 10.7 | 10.7 | 14.0 | |
Valid | Central | 30 | 20.0 | 20.0 | 34.0 |
Agree | 71 | 47.3 | 47.3 | 81.3 | |
Totally agree | 28 | 18.7 | 18.7 | 100.0 |