3.3. Early results.
3.3.1. Postoperative mechanical ventilation time.
Number of patients
70
64
60
50
40
30
20
10
8
0
Mechanical ventilation > 24 hours
Mechanical ventilation <24 hours
Figure 3.12. Distribution of patients according to postoperative mechanical ventilation time.
The patients' mechanical ventilation time was 11.3 ± 7.1 (hours).
08 patients (11.1% of patients) had mechanical ventilation time > 24 hours, the mechanical ventilation time of this group was 29.9 ± 6.4 (hours).
o 01 patient had bleeding in the left chest area after surgery, the patient was operated again to stop the bleeding.
o 01 patient had pneumonia and sternitis after surgery. Re-surgery to curettage and reconstruct the sternum.
o 06 patients had reduced left ventricular ejection fraction (< 50%) before surgery, postoperative bleeding or pneumonia.
Group with mechanical ventilation time ≤ 24 hours, average mechanical ventilation time was 9.2 ± 3.3 hours.
Table 3.12. Multivariate regression analysis assessing prognostic factors affecting duration of mechanical ventilation
Mechanical ventilation > 24 hours
Are not (n = 64) | Have (n = 8) | OR [IC95%] | P | |
Age, mean ± standard, year | 52.2 ± 13.8 | 59 ± 11.8 | 0.99 [0.99;1.01] | 0.64 |
BMI, Average ± Standard | 22.3 ± 2.9 | 20.6 ± 2.5 | 1.01 [0.98;1.03] | 0.64 |
Hypertension, n (%) | ||||
Yes (n = 34) | 29 (85.3) | 5 (14.7) | 1.04 [0.87;1.25] | 0.67 |
No (n = 38) | 35 (92.1) | 3 (7.9) | REF | REF |
Diabetes, n (%) | ||||
Yes (n = 2) | 2 (100) | 0 (0) | 0.74 [0.36; 1.5] | 0.41 |
No (n = 70) | 64 (91.4) | 8 (8.6) | REF | REF |
Dyslipidemia, n (%) | ||||
Yes (n = 4) | 3 (75) | 1 (25) | 1.13 [0.78;1.63] | 0.53 |
No (n = 68) | 69 (89.7) | 7 (10.3) | REF | REF |
Smoking, n (%) | ||||
Yes (n = 37) | 32 (86.5) | 5 (13.5) | 1.1 [0.86; 1.18] | 0.93 |
No (n = 35) | 32 (91.4) | 3 (8.6) | REF | REF |
Dyspnea n (%) | ||||
NYHA I (n = 3) | 3 (100) | 0 (0) | 1 [0.68;1.47] | 0.99 |
NYHA II (n = 26) | 26 (100) | 0 (0) | 0.98 [0.62;1.55] | 0.93 |
NYHA III (n = 37) | 30 (81.1) | 7 (18.9) | 1.21 [0.83;1.78] | 0.33 |
NYHA IV (n = 6) | 5 (83.3) | 1 (16.7) | 1.15 [0.72;1.83] | 0.56 |
Chest pain, n (%) | ||||
CCS I (n = 27) | 25 (92.6) | 2 (7.4) | 0.96 [0.71;1.3] | 0.8 |
CCS II (n = 30) | 26 (86.7) | 4 (13.3) | 0.94 [0.78;1.15] | 0.57 |
CCS III (n = 13) | 11 (84.6) | 2 (15.4) | 0.87 [0.67;1.13] | 0.3 |
CCS IV (n = 2) | 2 (100) | 0 (0) | 0.7 [0.42;1.16] | 0.17 |
EuroScore II, Average [IQR], % | 1.2 [0.6;4.4] | 1.7 [0.8;2.8] | 1.14 [1.0; 1.25] | 0.05 * |
Morphology of aortic valve lesions, n (%) | ||||
Valve stenosis, (n = 30) | 26 (86.7) | 4 (13.3) | 1.1 [0.93;1.29] | 0.3 |
Valve regurgitation, (n = 20) | 17 (85) | 3 (15) | 0.91 [0.75; 1.1] | 0.35 |
Maybe you are interested!
-

 Research on the treatment of seafood wastewater by electrocoagulation method combined with USBF - 19 tank
 -
 Revenue Forecast of Nam Viet Corporation 2014 Using Brown Method
 -
 Comparison of Distribution by Number of Cesarean Sections Between Studies
 -
 Equivalent Annual Payment Method
 -
 Teaching Process of Science Subject Using Btnb Method
Left ventricular ejection fraction, n(%)
LVEF < 50%, (n = 13) | 7 (53.8) | 6 (46.2) | 1.34 [1.21; 2.1] | 0.003 * |
LVEF > 50%, (n = 59) | 57 (96.6) | 2 (3,4) | REF | REF |
Time of the DMC pair, Average ± DLC, minutes | 106.5 ± 16.8 | 117.8 ± 5.4 | 1 [0.99; 1.01] | 0.15 |
Machine running time, Average ± DLC, minutes | 139.6 ± 35.6 | 155.5 ± 16.7 | 1 [0.99; 1.01] | 0.72 |
Amount of blood loss, Average ± DLC, liters | 0.39 ± 0.2 | 0.8 ± 0.33 | 1.6 [1.31; 1.9] | 0.0002 * |
Comment:
The average age of the group of patients on long-term mechanical ventilation was 59 years old, higher than the group on mechanical ventilation ≤ 24 hours, the difference was not statistically significant (p = 0.64).
Risk factors of hypertension, dyslipidemia and smoking history increased the risk of prolonged mechanical ventilation with OR coefficients of 1.04 times, 1.13 times and 1.1 times, the difference was not statistically significant.
EuroSCORE II score in the group with mechanical ventilation > 24 hours was 1.7% higher than that in the group with mechanical ventilation ≤ 24 hours was 1.2%, the difference with p = 0.05.
Left ventricular ejection fraction < 50% increases the risk of prolonged mechanical ventilation
> 24 hours increased 1.34 times compared with the normal left ventricular ejection fraction group (> 50%), p = 0.003.
The time of artificial heart-lung machine operation and the time of arterial coupling in the mechanical ventilation group > 24 hours were higher than the mechanical ventilation group ≤ 24 hours, the difference was not statistically significant.
In the group with mechanical ventilation > 24 hours, the average amount of blood lost through drainage was 800 ml, higher than in the group with mechanical ventilation ≤ 24 hours at 390 ml. Every 1000 ml of blood lost through drainage increased the risk of prolonged mechanical ventilation by 1.6 times.
3.3.2. Complications within the first 30 days after surgery.
Table 3.13. Complications within the first 30 days after surgery (n = 72).
Complications
Quantity patient | Percentage | |
Perioperative mortality | 1 | 1.4 |
Postoperative bleeding requiring reoperation | 1 | 1.4 |
Sternum inflammation | 1 | 1.4 |
Pneumonia | 5 | 6.9 |
Kidney failure requiring dialysis | 0 | 0 |
New postoperative atrial fibrillation | 3 | 4.2 |
Irreversible neurological complications | 0 | 0 |
Complications requiring permanent pacemaker placement | 0 | 0 |
Comments: The most common early complications occurring within the first 30 days after surgery in the study were pneumonia and new atrial fibrillation. Other complications such as sternitis, postoperative bleeding requiring reoperation, and death were less common.
3.3.3. Time spent in the recovery room after surgery and time spent in the hospital after surgery.
Table 3.14. Time spent in intensive care and hospital after surgery (n = 72).
Parameter
Value | |
Postoperative recovery time, mean ± standard, days | 4.1 ± 1.9 |
Postoperative hospital stay, mean ± standard, days | 12.5 ± 6.5 |
Time in recovery room after surgery
o 01 patient died on the first day after surgery due to bleeding and acute cardiac tamponade.
o 02 patients were in the intensive care unit for 20 days due to re-operative sternitis and pneumonia.
Prolonged hospital stay
o 01 patient was hospitalized 100 days after surgery due to sternitis causing mediastinal abscess, infection leading to pseudoaneurysm of the ascending aorta.
3.3.4. Echocardiogram results 1 month after surgery
Table 3.15. Echocardiographic parameters 1 month after surgery (n = 69, excluding 02 patients with valve replacement and 01 patient who died).
Ultrasound parameters
Value | |
Aortic valve regurgitation No regurgitation, n (%) Mild regurgitation, n (%) Moderate regurgitation, n (%) Severe open, n (%) | 57 (82.6) 11 (15.9) 1 (1.5) 0 (0) |
Aortic valve stenosis, n (%) | 0 (0) |
Maximum pressure difference across valve, TB ± DLC, mmHg | 16.1 ± 2.3 |
Average pressure difference across valve, TB ± DL, mm Hg | 7.4 ± 1.5 |
Effective valve area, TB ± DLC, cm² | 2.3 ± 0.4 |
Vmax, Average ± DLC, m/s | 1.8 ± 0.2 |
Left ventricular systolic function, mean ± standard deviation, % | 59.2 ± 3.5 |
Comments: Results of transthoracic echocardiography 1 month after surgery, no patient had severe aortic regurgitation, 01 patient with aortic regurgitation was also a patient with aortic regurgitation and was diagnosed immediately after surgery by esophageal echocardiography. The cardiac function of the patients was preserved within normal limits.
Table 3.16. Multivariate regression analysis assessing factors associated with perioperative complications (n = 72).
Perioperative complications
Are not (n = 61) | Have (n = 11) | OR [IC95%] | P | |
Age, mean ± standard, year | 51.9 ± 13.9 | 58.7 ± 11 | 1 [0.99;1.01] | 0.9 |
BMI, Average ± Standard | 22.5 ± 2.8 | 20.5 ± 2.9 | 0.98[0.96;1.02] | 0.43 |
Hypertension, n (%) | ||||
Yes (n = 34) | 26 (76.5) | 8 (23.5) | 0.98[0.82;1.17] | 0.81 |
No (n = 38) | 35 (92.1) | 3 (7.9) | REF | REF |
Diabetes, n (%) | ||||
Yes (n = 2) | 2 (100) | 0 (0) | 1 [0.5; 2.01] | 0.99 |
No (n = 70) | 59 (84.3) | 11 (15.7) | REF | REF |
Dyslipidemia, n (%) | ||||
Yes (n = 4) | 3 (75) | 1 (25) | 0.17[0.71;1.46] | 0.53 |
No (n = 68) | 58 (85.3) | 10 (14.7) | REF | REF |
Smoking, n (%) | ||||
Yes (n = 37) | 32 (86.5) | 5 (13.5) | 0.9 [0.77; 1.06] | 0.22 |
No (n = 35) | 29 (82.9) | 6 (17.1) | REF | REF |
Dyspnea n (%) | ||||
NYHA I (n = 3) | 2 (66.7) | 1 (33.3) | 0.7[0.46;1.11] | 0.14 |
NYHA II (n = 26) | 26 (91.2) | 0 (0) | 0.67[0.4;1.14] | 0.15 |
NYHA III (n = 37) | 28 (75.7) | 9 (24.3) | 0.88[0.57;1.37] | 0.57 |
NYHA IV (n = 6) | 5 (83.3) | 1 (16.7) | 0.8[0.47;1.37] | 0.42 |
Chest pain, n (%) | ||||
CCS I (n = 27) | 25 (92.6) | 2 (7.4) | 1[0.71;1.42] | 0.98 |
CCS II (n = 30)
24 (80) | 6 (20) | 1[0.83;1.3] | 0.72 | |
CCS III (n = 13) | 10 (76.9) | 3 (23.1) | 0.98[0.73;1.32] | 0.9 |
CCS IV (n = 2) | 2 (100) | 0 (0) | 0.75[0.42;1.33] | 0.33 |
EuroScore II | 1,1[0,6;3,8] | 1.84[0.6;4.4] | 1.12[1.01;1.26] | 0.04 * |
Morphology of aortic valve lesions, n(%) | ||||
Valve stenosis, (n = 30) | 24 (80) | 6 (20) | 1.1 [0.89; 1.29] | 0.49 |
Valve regurgitation, (n = 20) | 17 (85) | 3 (15) | 1.1 [0.93; 1.29] | 0.29 |
Left ventricular ejection fraction, n(%) | ||||
LVEF < 50%,(n = 13) | 8 (61.5) | 5 (38.5) | 1 [0.99; 1] | 0.32 |
LVEF > 50%,(n = 59) | 53 (89.8) | 6 (10.2) | REF | REF |
Time of DMC pair, Average ± DLC, minute | 105.2 ± 14.2 | 121.5 ± 20.3 | 1 [0.99; 1.01] | 0.84 |
Machine running time, Average ± DLC, minute | 137.7 ± 33.4 | 161.9 ± 32.3 | 1 [0.99; 1.01] | 0.15 |
Amount of blood loss, Average ± DLC, liters | 0.37 ± 0.18 | 0.84 ± 0.25 | 1 [1; 1] | <0.001 * |
(TB: Average value; DLC: Standard deviation; BMI (Body Mass Index): Body mass index)
Comment:
The average age of the group of patients with perioperative complications was 58.7 years old, higher than the group without perioperative complications at 51.9 years old, however the difference was not statistically significant (p = 0.9).
The EuroSCORE II score in the group with perioperative complications was 1.84% higher than that in the group without perioperative complications was 1.1%, a difference with p = 0.04.
No difference was noted in perioperative complications related to the level of dyspnea according to NYHA classification of patients in the study.
The time of cardiopulmonary bypass and the time of arterial grafting in the group with perioperative complications were higher than in the group without perioperative complications, however the difference was not statistically significant.
In the group with perioperative complications, the average blood loss through drainage was 840 ml, higher than the group without perioperative complications at 370 ml, the difference with p < 0.001.
3.4. Medium-term results.
The average follow-up period in the study was 26.5 months, with the shortest being 12 months and the longest being 42 months.
3.4.1. Postoperative survival rate during mid-term follow-up.
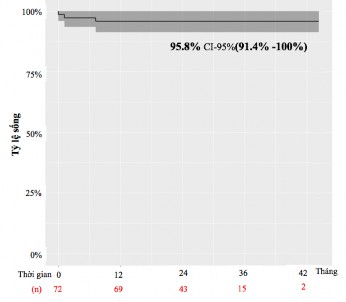
Figure 3.13. Kaplan-Meier plot showing mid-term postoperative survival rates.
Comments: After a mean follow-up period of 26.5 months, the survival rate of patients after surgery was 95.8%. 03 patients (4.2% of patients) died during the follow-up period. Of these, 01 patient died on the first day after surgery, 02 patients died in the 3rd and 8th months after surgery due to sternitis, mediastinal abscess invading the ascending aorta causing pseudo-aneurysm and rupture of the ascending aorta.