5.2. BUSINESS RESULTS FORECAST
5.2.1. Revenue forecast
5.2.1.1. Navifico's revenue situation in some years
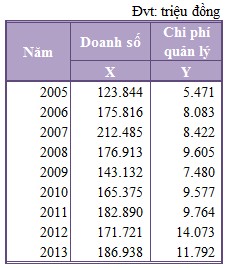
Revenue fluctuations over the years 2005 - 2013 of Nam Viet Joint Stock Company are shown in the following table and chart:
Table 5.1: Revenue of Nam Viet Corporation 2005 - 2013
Unit: million VND
Revenue | |
2005 | 123,844 |
2006 | 175,816 |
2007 | 212,485 |
2008 | 176,913 |
2009 | 143,132 |
2010 | 165,375 |
2011 | 182,890 |
2012 | 171,721 |
2013 | 186,938 |
Maybe you are interested!
-

 Applying the Revenue Item Audit Process of Sao Viet Auditing Company
 -
 Management accounting of revenue, costs and business results at Viet Anh Production and Trading Limited Company - 2
 -
 Orientation and Solutions for Perfecting Credit Risk Management at Lien Viet Post Joint Stock Commercial Bank - Ha Nam Branch
 -
 Management accounting of revenue, costs and business results at Viet Anh Production and Trading Company Limited - 14
 -
 Revenue and Net Profit Growth of Vietnam-Italy Steel Corporation in Recent Years
Chart 5.1: Revenue fluctuations of Nam Viet Corporation 2003 - 2013
250000.0
200000.0
150000.0
100000.0
Revenue
50000.0
-
2005 2006 2007 2008 2009 2010 2011 2012 2013
Comment:The chart showing the Company's revenue fluctuations over 8 years shows that although revenue fluctuates up and down each year, the general trend is increasing.
5.2.1.2. Navifico revenue forecast 2014
Because the moving average method and the exponential smoothing method are only valid for data series with uniform fluctuations without considering trends, they are not suitable for forecasting Navifico's 2014 revenue. Here, we only consider the two methods Brown and Holt for Navifico's data. We have the following revenue forecast results after processing and calculating on Excel:
 According to Brown's method
Figure 5.1: Using Solver to find the optimal alpha value
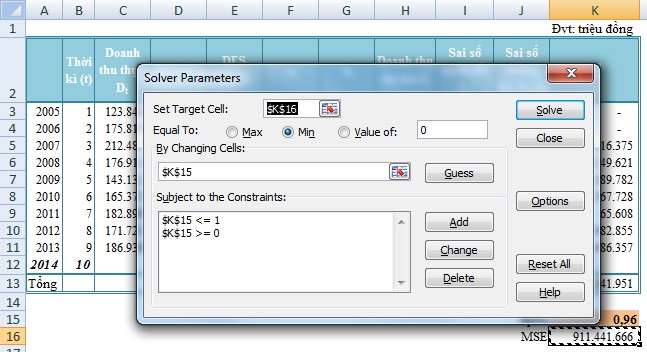
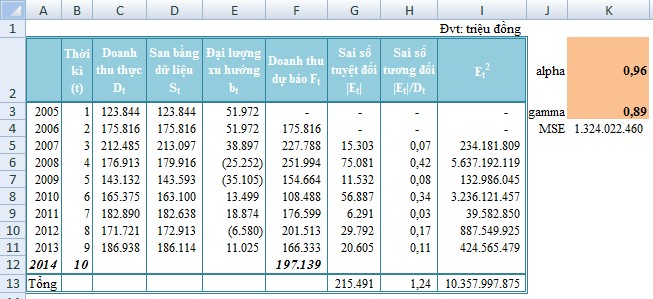
Figure 5.2: Revenue forecast of Nam Viet Corporation in 2014 using Brown method
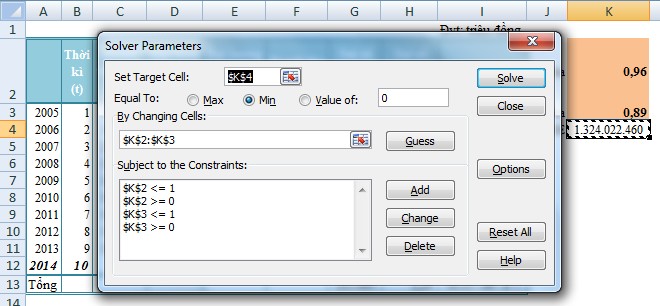
 According to Holt method
Figure 5.3: Using Solver to find optimal alpha and gamma values
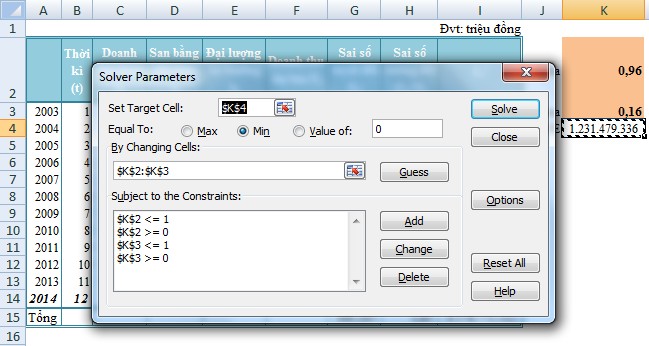
Figure 5.4: Revenue forecast of Nam Viet Corporation in 2014 using Holt method
 Choosing the official forecasting method
To get the best forecast results, we calculate the error quantities as follows:
Table 5.2: Errors of forecast results
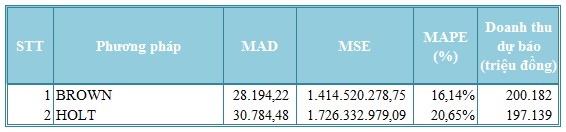
From the table above, it can be seen that the forecast using the Brown method gives the results with the smallest error. So, choose the Brown method as the official forecasting method and the company's forecasted revenue in 2014 is: 200,182 million VND
5.2.2. Forecast of cost of goods sold:
5.2.2.1. Forecast basis:
Net revenue of Nam Viet Corporation mainly comes from the sale of roofing sheets and the sale of wooden furniture. Because each product will have different input material prices and production costs, to determine more accurately the cost of goods sold for 2014, we forecast the cost of goods sold separately for each product type.
To do this, we rely on the ratio figures of cost of goods sold/Revenue of 2 businesses trading in these 2 separate types of products: Dong Nai Construction Materials Roofing Sheet JSC (specializing in the production and trading of roofing sheets) and Duc Thanh Wood Processing JSC (specializing in the production and trading of wood products).
However, first of all, it is necessary to determine the revenue structure of each item in the total revenue of the company (Because there is no specific data for each item in previous years, here we only rely on the data provided in 2013).
Table 5.3: Revenue structure of Nam Viet Corporation 2013
Unit: million VND
Year
2013 | Proportion | |
Roofing sheet revenue | 95,483 | 51.27% |
Wood revenue | 91,905 | 48.73% |
Total revenue | 186,938 | 100% |
In 2014, the forecasted proportion of each item will remain the same as in 2013, respectively:
Table 5.4: Forecast of revenue structure of Nam Viet Corporation 2014
Unit: million VND
Year
2014 | Proportion | |
Roofing sheet revenue | 102,633 | 51.27% |
Wood revenue | 97,549 | 48.73% |
Total revenue | 200,182 | 100% |
5.2.2.2. Forecast of cost of goods sold of roofing panels:
Table 5.5: Ratio of sales revenue/revenue of Dong Nai Construction Materials Roofing Sheet JSC 2009 - 2013
Unit: million VND
Year
2009 | 2010 | 2011 | 2012 | 2013 | |
Revenue | 313,524 | 339,295 | 312.131 | 531,441 | 279,688 |
Cost of goods sold | 245,905 | 275,932 | 223,030 | 492,626 | 275,524 |
Proportion | 78% | 81% | 71% | 93% | 98% |
5 year average | 85% | ||||
Average of 2 years 2012 - 2013 | 96% | ||||
As analyzed in the above chapter, in the period of 2012 - 2013, input prices, especially costs for roofing sheets, increased significantly. This situation is forecasted to continue in 2014, so to forecast the cost of goods sold for roofing sheets at Nam Viet Corporation this year, to ensure accuracy, the cost of goods sold/Revenue ratio of 96% is used instead of the 5-year average.
Table 5.6: Forecasted cost of goods sold of roofing sheets of Nam Viet Corporation 2014
Unit: million VND
Year
2014 | |
Roofing sheet revenue | 102,633 |
Cost of goods sold | 98,015 |
Proportion | 96% |
5.2.2.3. Forecast of cost of goods sold of wood products:
Table 5.7: Ratio of GVHB/DT of Duc Thanh Wood Processing JSC 2009 - 2013
Unit: million VND
Year
2009 | 2010 | 2011 | 2012 | 2013 | |
Revenue | 174,268 | 175,017 | 219,685 | 231,284 | 237,267 |
Cost of goods sold | 109,961 | 110,034 | 146,358 | 162,021 | 156,567 |
Proportion | 63% | 63% | 67% | 70% | 66% |
5 year average | 66% |
Unlike roofing products, the price of raw materials and the cost of producing wooden products, although always high, have not fluctuated much during this period. Figures from Duc Thanh Wood Processing JSC also show this. Thus, to ensure the accuracy of the forecast of the cost of goods sold of wooden products of Nam Viet JSC in 2014, using data from Duc Thanh Wood Processing JSC is 66%.
Table 5.8: Forecasted cost of goods sold of wood products of Nam Viet Corporation 2014
Unit: million VND
Year
2014 | |
Wood revenue | 98,015 |
Cost of goods sold | 64,382 |
Proportion | 66% |
5.2.2.4. Forecast of cost of goods sold in 2014:
Cost of goods sold (2014) = 98,015 + 64,382 = 162,397 million VND
5.2.3. Forecasting selling and administrative expenses
5.2.3.1. Forecast basis:
Based on the relationship between costs and production and business volume, the costs of a business are divided into 2 types of costs:
Variable costs:are costs that vary with output or revenue. Such as: raw material costs, direct labor costs, etc.
Fixed cost:are costs that do not change with the volume of production and business. Such as: depreciation, management, advertising costs, etc.
Administrative expenses and selling expenses are dual costs, meaning they have a fixed cost component and a variable cost component. Therefore, to properly consider these costs, we need to determine their relationship to revenue.
To determine this relationship assuming that the correlation between each cost and revenue is linear, we perform univariate regression techniques to estimate the overall regression model.
5.2.3.2. Forecasting sales costs:
From the data on sales costs and revenue for the period 2005 - 2013, use Excel to calculate the regression coefficients and establish the regression equation.
Table 5.9: Sales cost and revenue data of Nam Viet Corporation 2005 - 2013
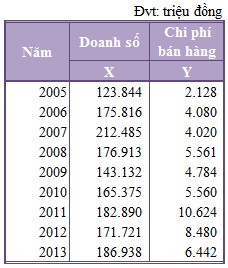
Figure 5.5: Results of univariate regression parameters of the cost of sales model
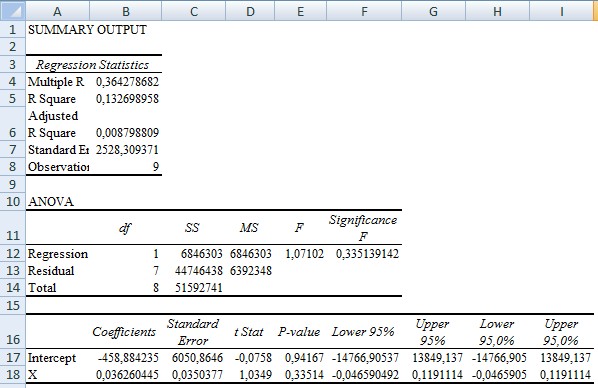
We have the following model for cost of sales by revenue:
Y 1 = 0.036X – 459
Meaning:For every 1 dong increase in revenue, selling expenses will increase by 0.036 dong.
From the forecast revenue in 2014 of 200,182 million VND, the company's corresponding selling expenses in 2014 are:
Cost of sales (2014) = 0.036 x 200,182 – 459 = 6,800 million VND
5.2.3.3. Management cost forecast:
From the management cost and revenue data for the period 2005 - 2013, use Excel to calculate the regression coefficients and establish the regression equation.
Table 5.10: Data on business management costs and revenue of Nam Viet Joint Stock Company 2005 - 2013