The mean values of the factors reflecting the readiness of individuals for organizational change are all greater than 3. The highest is the perception of the suitability of change with the organization (Mean = 3.69) and the lowest is the level of perception of the ability to implement change and the benefits of trade-offs of individuals, the Mean values are 3.31 and 3.3 respectively (Table 4.17). This shows that the readiness of individuals for changes in production and business strategies at the surveyed equitized state-owned enterprises is at an average level, not high. In the study of Holt et al. (2007) on the readiness of individuals for changes in applying an information management system, the readiness level is higher when the mean value is from 4.0 to 4.9. On the contrary, the study of Mohamed Haffar (2014) showed that the level of individual readiness for change when the organization applies total quality management (TQM) in companies in Syria is quite low (from 2.32 to 2.42).
5.1.2. Discuss research results on factors influencing individual readiness for change
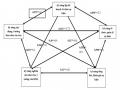
As the research model proposed by the author in chapter 2, the proposed factors influencing individual readiness for change are (1) personal characteristics including extroversion and emotional stability and (2) factors belonging to the organizational context of change including management trust, communication climate and organizational justice. Testing the research model has given very different results on the level of influence of these factors on readiness for change.
Personal characteristics
Of the two personality traits proposed to influence change readiness, extroversion (the TCHN factor) had no impact on change readiness. Four out of five hypotheses about the impact of emotional stability were accepted. Individuals with emotionally stable personalities had no impact on the perception of benefits affected by change, and hypothesis H2e was rejected. The impacts of emotional stability on each component of change readiness had estimated impact coefficient values ranging from 0.062 (for LIDD) to 0.212 (for SSCX). All impacts were positive.
Hypothesis
Content | Result | |
The relationship between extroversion and readiness for change | ||
Hypothesis H1a | Extraversion personality has a positive influence on individual's feelings towards organizational change. | Reject |
Hypothesis H1b | Extraversion personality has a positive influence on perceptions of the appropriateness of change to the organization. | Reject |
Hypothesis H1c | Extraversion personality positively influences perceptions of leadership support for change | Reject |
Hypothesis H1d | Extraversion has a positive influence on perceptions of an individual's ability to implement change. | Reject |
Hypothesis H1e | Extraversion has a negative effect on trade-off perceptions | Reject |
The relationship between emotional stability and readiness for change | ||
Hypothesis H2a | Emotional stability has a positive influence on individual's feelings of change. | Acceptance |
Hypothesis H2b | Emotional stability has a positive influence on perceptions of change fit with the organization. | Acceptance |
Hypothesis H2c | Emotional stability positively influences perceptions of leadership support for change. | Acceptance |
Hypothesis H2d | Emotional stability has a positive influence on perceptions of ability to implement change. | Acceptance |
Hypothesis H2e | Emotional stability negatively affects individuals' perceptions of trade-offs | Reject |
Maybe you are interested!
-

 Identify Rating Levels and Rating Scales
zt2i3t4l5ee
zt2a3gstourism,quan lan,quang ninh,ecology,ecotourism,minh chau,van don,geography,geographical basis,tourism development,science
zt2a3ge
zc2o3n4t5e6n7ts
of the islanders. Therefore, this indicator will be divided into two sub-indicators:
a1. Natural tourism attractiveness a2. Cultural tourism attractiveness
b. Tourist capacity
The two island communes in Quan Lan have different capacities to receive tourists. Minh Chau Commune is home to many standard hotels and resorts, attracting high-income domestic and international tourists. Meanwhile, Quan Lan Commune has many motels mainly built and operated by local people, so the scale and quality are not high, and will be suitable for ordinary tourists such as students.
c. Time of exploitation of Quan Lan Island Commune:
Quan Lan tourism is seasonal due to weather and climate conditions and festivals only take place on certain days of the year, specifically in spring. In Quan Lan commune, the period from April to June and from September to November is considered the best time to visit Quan Lan because the cultural tourism activities are mainly associated with festivals taking place during this time.
Minh Chau island commune:
Tourism exploitation time is all year round, because this is a place with a number of tourist attractions with diverse ecosystems such as Bai Tu Long National Park Research Center, Tram forest, Turtle Laying Beach, so besides coming to the beach for tourism and vacation in the summer, Minh Chau will attract research groups to come for tourism combined with research at other times of the year.
d. Sustainability
The sustainability of ecotourism sites in Quan Lan and Minh Chau communes depends on the sensitivity of the ecosystems to climate changes.
landscape. In general, these tourist destinations have a fairly high level of sustainability, because they are natural ecosystems, planned and protected. However, if a large number of tourists gather at certain times, it can exceed the carrying capacity and affect the sustainability of the environment (polluted beaches, damaged trees, animals moving away from their habitats, etc.), then the sustainability of the above ecosystems (natural ecosystems, human ecosystems) will also be affected and become less sustainable.
e. Location and accessibility
Both island communes have ports to take tourists to visit from Van Don wharf:
- Quan Lan – Van Don traffic route:
Phuc Thinh – Viet Anh high-speed boat and Quang Minh high-speed boat, depart at 8am and 2pm from Van Don to Quan Lan, and at 7am and 1pm from Quan Lan to Van Don. There are also wooden boats departing at 7am and 1pm.
- Van Don - Minh Chau traffic route:
Chung Huong high-speed train, Minh Chau train, morning 7:30 and afternoon 13:30 from Van Don to Minh Chau, morning 6:30 and afternoon 13:00 from Minh Chau to Van Don.
f. Infrastructure
Despite receiving investment attention, the issue of infrastructure and technical facilities for tourism on Quan Lan Island is still an issue that needs to be resolved because it has a direct impact on the implementation of ecotourism activities. The minimum conditions for serving tourists such as accommodation, electricity, water, communication, especially medical services, and security work need to be given top priority. Ecotourism spots in Minh Chau commune are assessed to have better infrastructure and technical facilities for tourism because there are quite complete and synchronous conditions for serving tourists, meeting many needs of domestic and foreign tourists.
3.2.1.4. Determine assessment levels and assessment scales
Corresponding to the levels of each criterion, the index is the score of those levels in the order of 4, 3, 2, 1 decreasing according to the standard of each level: very attractive (4), attractive (3), average (2), less attractive (1).
3.2.1.5. Determining the coefficients of the criteria
For the assessment of DLST in the two communes of Quan Lan and Minh Chau islands, the students added evaluation coefficients to show the importance of the criteria and indicators as follows:
Coefficient 3 with criteria: Attractiveness, Exploitation time. These are the 2 most important criteria for attracting tourists to tourism in general and eco-tourism in particular, so they have the highest coefficient.
Coefficient 2 with criteria: Capacity, Infrastructure, Location and accessibility . Because the assessment area is an island commune of Van Don district, the above criteria are selected by the author with appropriate coefficients at the average level.
Coefficient 1 with criteria: Sustainability. Quan Lan has natural and human-made ecotourism sites, with high biodiversity and little impact from local human factors. Most of the ecotourism sites are still wild, so they are highly sustainable.
3.2.1.6. Results of DLST assessment on Quan Lan island
a. Assessment of the potential for natural tourism development
For Minh Chau commune:
+ Natural tourism attractiveness is determined to be very attractive (4 points) and the most important coefficient (coefficient 3), so the score of the Attractiveness criterion is 4 x 3 = 12.
+ Capacity is determined as average (2 points) and the coefficient is quite important (coefficient 2), then the score of Capacity criterion is 2 x 2 = 4.
+ Exploitation time is long (4 points), the most important coefficient (coefficient 3) so the score of the Exploitation time criterion is 4 x 3 = 12.
+ Sustainability is determined as sustainable (4 points), the important coefficient is the average coefficient (coefficient 1), so the score of the Sustainability criterion is 4 x 1 = 4 points
+ Location and accessibility are determined to be quite favorable (2 points), the coefficient is quite important (coefficient 2), the criterion score is 2 x 2 = 4 points.
+ Infrastructure is assessed as good (3 points), the coefficient is quite important (coefficient 2), then the score of the Infrastructure criterion is 3 x 2 = 6 points.
The total score for evaluating DLST in Minh Chau commune according to 6 evaluation criteria is determined as: 12 + 4 + 12 + 4 + 4 + 6 = 42 points
Similar assessment for Quan Lan commune, we have the following table:
Table 3.3: Assessment of the potential for natural ecotourism development in Quan Lan and Minh Chau communes
Attractiveness of self-tourismof course
Capacity
Mining time
Sustainability
Location and accessibility
Infrastructure
Result
Point
DarkMulti
Point
DarkMulti
Point
DarkMulti
Point
DarkMulti
Point
DarkMulti
Point
DarkMulti
CommuneMinh Chau
12
12
4
8
12
12
4
4
4
8
6
8
42/52
Quan CommuneLan
6
12
6
8
9
12
4
4
4
8
4
8
33/52
b. Assessment of the potential for humanistic tourism development
For Quan Lan commune:
+ The attractiveness of human tourism is determined to be very attractive (4 points) and the most important coefficient (coefficient 3), so the score of the Attractiveness criterion is 4 x 3 = 12.
+ Capacity is determined to be large (3 points) and the coefficient is quite important (coefficient 2), then the score of the Capacity criterion is 3 x 2 = 6.
+ Mining time is average (3 points), the most important coefficient (coefficient 3) so the score of the Mining time criterion is 3 x 3 = 9.
+ Sustainability is determined as sustainable (4 points), the important coefficient is the average coefficient (coefficient 1), so the score of the Sustainability criterion is 4 x 1 = 4 points.
+ Location and accessibility are determined to be quite favorable (2 points), the coefficient is quite important (coefficient 2), the criterion score is 2 x 2 = 4 points.
+ Infrastructure is rated as average (2 points), the coefficient is quite important (coefficient 2), then the score of the Infrastructure criterion is 2 x 2 = 4 points.
The total score for evaluating DLST in Quan Lan commune according to 6 evaluation criteria is determined as: 12 + 6 + 6 + 4 + 4 + 4 = 36 points.
Similar assessment with Minh Chau commune we have the following table:
Table 3.4: Assessment of the potential for developing humanistic eco-tourism in Quan Lan and Minh Chau communes
Attractiveness of human tourismliterature
Capacity
Mining time
Sustainability
Location and accessibility
Infrastructure
Result
Point
DarkMulti
Point
DarkMulti
Point
DarkMulti
Point
DarkMulti
Point
DarkMulti
Point
DarkMulti
Quan CommuneLan
12
12
6
8
9
12
4
4
4
8
4
8
39/52
Minh CommuneChau
6
12
4
8
12
12
4
4
4
8
6
8
36/52
Basically, both Minh Chau and Quan Lan localities have quite favorable conditions for developing ecotourism. However, Quan Lan commune has more advantages to develop ecotourism in a humanistic direction, because this is an area with many famous historical relics such as Quan Lan Communal House, Quan Lan Pagoda, Temple worshiping the hero Tran Khanh Du, ... along with local festivals held annually such as the wind praying ceremony (March 15), Quan Lan festival (June 10-19); due to its location near the port and long exploitation time, the beaches in Quan Lan commune (especially Quan Lan beach) are no longer hygienic and clean to ensure the needs of tourists coming to relax and swim; this is also an area with many beautiful landscapes such as Got Beo wind pass, Ong Phong head, Voi Voi cave, but the ability to access these places is still very limited (dirt hill road, lots of gravel and rocks), especially during rainy and windy times; In addition, other natural resources such as mangrove forests and sea worms have not been really exploited for tourism purposes and ecotourism development. On the contrary, Minh Chau commune has more advantages in developing ecotourism in the direction of natural tourism, this is an area with diverse ecosystems such as at Rua De Beach, Bai Tu Long National Park Conservation Center...; Minh Chau beach is highly appreciated for its natural beauty and cleanliness, ranked in the top ten most beautiful beaches in Vietnam; Minh Chau commune is also home to Tram forest with a large area and a purity of up to 90%, suitable for building bridges through the forest (a very effective type of natural ecotourism currently applied by many countries) for tourists to sightsee, as well as for the purpose of studying and researching.
Figure 3.1: Thenmala Forest Bridge (India) Source: https://www.thenmalaecotourism.com/(August 21, 2019)
3.2.2. Using SWOT matrix to evaluate Quan Lan island tourism
General assessment of current tourism activities of Quan Lan island is shown through the following SWOT matrix:
Table 3.5: SWOT matrix evaluating tourism activities on Quan Lan island
Internal agent
Strengths- There is a lot of potential for tourism development, especially natural ecotourism and humanistic ecotourism.- The unskilled labor force is relatively abundant.- resource environmentunpolluted, still
Weaknesses- Poorly developed infrastructure, especially traffic routes to tourist destinations on the island.- The team of professional staff is still weak.- Tourism products in general
quite wild, originalintact
general and DLST in particularalone is monotonous.
External agents
Opportunity- Tourism is a key industry in the socio-economic development strategy of the province and Van Don economic zone.- Quan Lan was selected as a pilot area for eco-tourism development within the framework of the green growth project between Quang Ninh province and the Japanese organization JICA.- The flow of tourists and especially ecotourism in the world tends toincreasing
Challenge- Weather and climate change abnormally.- Competition in tourism products is increasingly fierce, especially with other localities in the province such as Ha Long, Mong Cai...- Awareness of tourists, especially domestic tourists, about ecotourism and nature conservation is not high.
Through summary analysis using SWOT matrix we see that:
To exploit strengths and take advantage of opportunities, it is necessary to:
- Diversify products and service types (build more tourism routes aimed at specific needs of tourists: experiential tourism immersed in nature, spiritual cultural tourism...)
- Effective exploitation of resources and differentiated products (natural resources and human resources)
div.maincontent .p { color: black; font-family:"Times New Roman", serif; font-style: normal; font-weight: normal; text-decoration: none; font-size: 14pt; margin:0pt; } div.maincontent p { color: black; font-family:"Times New Roman", serif; font-style: normal; font-weight: normal; text-decoration: none; font-size: 14pt; margin:0pt; } div.maincontent .s1 { color: black; font-family:"Times New Roman", serif; font-style: normal; font-weight: normal; text-decoration: none; font-size: 13pt; } div.maincontent .s2 { color: black; font-family:"Times New Roman", serif; font-style: normal; font-weight: normal; text-decoration: none; font-size: 13pt; } div.maincontent .s3 { color: #0D0D0D; font-family:"Times New Roman", serif; font-style: normal; font-weight: bold; text-decoration: none; font-size: 14pt; } div.maincontent .s4 { color: black; font-family:"Times New Roman", serif; font-style: italic; font-weight: normal; text-decoration: none; font-size: 14pt; } div.maincontent .s5 { color: black; font-family:"Times New Roman", serif; font-style: italic; font-weight: bold; text-decoration: none; font-size: 14pt; } div.maincontent .s6 { color: black; font-family:"Times New Roman", serif; font-style: italic; font-weight: normal; text-decoration: none; font-size: 14pt; vertical-align: -3pt; } div.maincontent .s7 { color: black; font-family:"Times New Roman", serif; font-style: italic; font-weight: normal; text-decoration: none; font-size: 14pt; vertical-align: -2pt; } div.maincontent .s8 { color: black; font-family:"Times New Roman", serif; font-style: italic; font-weight: normal; text-decoration: none; font-size: 14pt; vertical-align: -1pt; } div.maincontent .s9 { color: black; font-family:"Times New Roman", serif; font-style: normal; font-weight: normal; text-decoration: none; font-size: 14pt; } div.maincontent .s10 { color: black; font-family:"Times New Roman", serif; font-style: normal; font-weight: bold; text-decoration: none; font-size: 14pt; } div.maincontent .s11 { color: black; font-family:"Times New Roman", serif; font-style: normal; font-weight: normal; text-decoration: none; font-size: 14pt; } div.maincontent .s12 { color: black; font-family:Symbol, serif; font-style: normal; font-weight: normal; text-decoration: none; font-size: 14pt; } div.maincontent .s13 { color: black; font-family:Wingdings; font-style: normal; font-weight: normal; text-decoration: none; font-size: 14pt; } div.maincontent .s14 { color: black; font-family:"Times New Roman", serif; font-style: normal; font-weight: normal; text-decoration: none; font-size: 9pt; vertical-align: 5pt; } div.maincontent .s15 { color: black; font-family:"Times New Roman", serif; font-style: normal; font-weight: normal; text-decoration: none; font-size: 9pt; vertical-align: 5pt; } div.maincontent .s16 { color: black; font-family:Cambria, serif; font-style: italic; font-weight: normal; text-decoration: none; font-size: 14pt; } div.maincontent .s17 { color: #080808; font-family:"Times New Roman", serif; font-style: normal; font-weight: bold; text-decoration: none; font-size: 14pt; } div.maincontent .s18 { color: #080808; font-family:"Times New Roman", serif; font-style: normal; font-weight: normal; text-decoration: none; font-size: 14pt; } div.maincontent .s19 { color: black; font-family:"Times New Roman", serif; font-style: normal; font-weight: normal; text-decoration: none; font-size: 11pt; } div.maincontent .s20 { color: black; font-family:"Times New Roman", serif; font-style: normal; font-weight: normal; text-decoration: none; font-size: 10pt; } div.maincontent .s21 { color: black; font-family:"Times New Roman", serif; font-style: normal; font-weight: bold; text-decoration: none; font-size: 11pt; } div.maincontent .s22 { color: black; font-family:"Times New Roman", serif; font-style: normal; font-weight: normal; text-decoration: none; font-size: 11pt; } div.maincontent .s23 { color: black; font-family:"Times New Roman", serif; font-style: italic; font-weight: normal; text-decoration: none; font-size: 14pt; } div.maincontent .s24 { color: #212121; font-family:"Times New Roman", serif; font-style: normal; font-weight: normal; tex
Identify Rating Levels and Rating Scales
zt2i3t4l5ee
zt2a3gstourism,quan lan,quang ninh,ecology,ecotourism,minh chau,van don,geography,geographical basis,tourism development,science
zt2a3ge
zc2o3n4t5e6n7ts
of the islanders. Therefore, this indicator will be divided into two sub-indicators:
a1. Natural tourism attractiveness a2. Cultural tourism attractiveness
b. Tourist capacity
The two island communes in Quan Lan have different capacities to receive tourists. Minh Chau Commune is home to many standard hotels and resorts, attracting high-income domestic and international tourists. Meanwhile, Quan Lan Commune has many motels mainly built and operated by local people, so the scale and quality are not high, and will be suitable for ordinary tourists such as students.
c. Time of exploitation of Quan Lan Island Commune:
Quan Lan tourism is seasonal due to weather and climate conditions and festivals only take place on certain days of the year, specifically in spring. In Quan Lan commune, the period from April to June and from September to November is considered the best time to visit Quan Lan because the cultural tourism activities are mainly associated with festivals taking place during this time.
Minh Chau island commune:
Tourism exploitation time is all year round, because this is a place with a number of tourist attractions with diverse ecosystems such as Bai Tu Long National Park Research Center, Tram forest, Turtle Laying Beach, so besides coming to the beach for tourism and vacation in the summer, Minh Chau will attract research groups to come for tourism combined with research at other times of the year.
d. Sustainability
The sustainability of ecotourism sites in Quan Lan and Minh Chau communes depends on the sensitivity of the ecosystems to climate changes.
landscape. In general, these tourist destinations have a fairly high level of sustainability, because they are natural ecosystems, planned and protected. However, if a large number of tourists gather at certain times, it can exceed the carrying capacity and affect the sustainability of the environment (polluted beaches, damaged trees, animals moving away from their habitats, etc.), then the sustainability of the above ecosystems (natural ecosystems, human ecosystems) will also be affected and become less sustainable.
e. Location and accessibility
Both island communes have ports to take tourists to visit from Van Don wharf:
- Quan Lan – Van Don traffic route:
Phuc Thinh – Viet Anh high-speed boat and Quang Minh high-speed boat, depart at 8am and 2pm from Van Don to Quan Lan, and at 7am and 1pm from Quan Lan to Van Don. There are also wooden boats departing at 7am and 1pm.
- Van Don - Minh Chau traffic route:
Chung Huong high-speed train, Minh Chau train, morning 7:30 and afternoon 13:30 from Van Don to Minh Chau, morning 6:30 and afternoon 13:00 from Minh Chau to Van Don.
f. Infrastructure
Despite receiving investment attention, the issue of infrastructure and technical facilities for tourism on Quan Lan Island is still an issue that needs to be resolved because it has a direct impact on the implementation of ecotourism activities. The minimum conditions for serving tourists such as accommodation, electricity, water, communication, especially medical services, and security work need to be given top priority. Ecotourism spots in Minh Chau commune are assessed to have better infrastructure and technical facilities for tourism because there are quite complete and synchronous conditions for serving tourists, meeting many needs of domestic and foreign tourists.
3.2.1.4. Determine assessment levels and assessment scales
Corresponding to the levels of each criterion, the index is the score of those levels in the order of 4, 3, 2, 1 decreasing according to the standard of each level: very attractive (4), attractive (3), average (2), less attractive (1).
3.2.1.5. Determining the coefficients of the criteria
For the assessment of DLST in the two communes of Quan Lan and Minh Chau islands, the students added evaluation coefficients to show the importance of the criteria and indicators as follows:
Coefficient 3 with criteria: Attractiveness, Exploitation time. These are the 2 most important criteria for attracting tourists to tourism in general and eco-tourism in particular, so they have the highest coefficient.
Coefficient 2 with criteria: Capacity, Infrastructure, Location and accessibility . Because the assessment area is an island commune of Van Don district, the above criteria are selected by the author with appropriate coefficients at the average level.
Coefficient 1 with criteria: Sustainability. Quan Lan has natural and human-made ecotourism sites, with high biodiversity and little impact from local human factors. Most of the ecotourism sites are still wild, so they are highly sustainable.
3.2.1.6. Results of DLST assessment on Quan Lan island
a. Assessment of the potential for natural tourism development
For Minh Chau commune:
+ Natural tourism attractiveness is determined to be very attractive (4 points) and the most important coefficient (coefficient 3), so the score of the Attractiveness criterion is 4 x 3 = 12.
+ Capacity is determined as average (2 points) and the coefficient is quite important (coefficient 2), then the score of Capacity criterion is 2 x 2 = 4.
+ Exploitation time is long (4 points), the most important coefficient (coefficient 3) so the score of the Exploitation time criterion is 4 x 3 = 12.
+ Sustainability is determined as sustainable (4 points), the important coefficient is the average coefficient (coefficient 1), so the score of the Sustainability criterion is 4 x 1 = 4 points
+ Location and accessibility are determined to be quite favorable (2 points), the coefficient is quite important (coefficient 2), the criterion score is 2 x 2 = 4 points.
+ Infrastructure is assessed as good (3 points), the coefficient is quite important (coefficient 2), then the score of the Infrastructure criterion is 3 x 2 = 6 points.
The total score for evaluating DLST in Minh Chau commune according to 6 evaluation criteria is determined as: 12 + 4 + 12 + 4 + 4 + 6 = 42 points
Similar assessment for Quan Lan commune, we have the following table:
Table 3.3: Assessment of the potential for natural ecotourism development in Quan Lan and Minh Chau communes
Attractiveness of self-tourismof course
Capacity
Mining time
Sustainability
Location and accessibility
Infrastructure
Result
Point
DarkMulti
Point
DarkMulti
Point
DarkMulti
Point
DarkMulti
Point
DarkMulti
Point
DarkMulti
CommuneMinh Chau
12
12
4
8
12
12
4
4
4
8
6
8
42/52
Quan CommuneLan
6
12
6
8
9
12
4
4
4
8
4
8
33/52
b. Assessment of the potential for humanistic tourism development
For Quan Lan commune:
+ The attractiveness of human tourism is determined to be very attractive (4 points) and the most important coefficient (coefficient 3), so the score of the Attractiveness criterion is 4 x 3 = 12.
+ Capacity is determined to be large (3 points) and the coefficient is quite important (coefficient 2), then the score of the Capacity criterion is 3 x 2 = 6.
+ Mining time is average (3 points), the most important coefficient (coefficient 3) so the score of the Mining time criterion is 3 x 3 = 9.
+ Sustainability is determined as sustainable (4 points), the important coefficient is the average coefficient (coefficient 1), so the score of the Sustainability criterion is 4 x 1 = 4 points.
+ Location and accessibility are determined to be quite favorable (2 points), the coefficient is quite important (coefficient 2), the criterion score is 2 x 2 = 4 points.
+ Infrastructure is rated as average (2 points), the coefficient is quite important (coefficient 2), then the score of the Infrastructure criterion is 2 x 2 = 4 points.
The total score for evaluating DLST in Quan Lan commune according to 6 evaluation criteria is determined as: 12 + 6 + 6 + 4 + 4 + 4 = 36 points.
Similar assessment with Minh Chau commune we have the following table:
Table 3.4: Assessment of the potential for developing humanistic eco-tourism in Quan Lan and Minh Chau communes
Attractiveness of human tourismliterature
Capacity
Mining time
Sustainability
Location and accessibility
Infrastructure
Result
Point
DarkMulti
Point
DarkMulti
Point
DarkMulti
Point
DarkMulti
Point
DarkMulti
Point
DarkMulti
Quan CommuneLan
12
12
6
8
9
12
4
4
4
8
4
8
39/52
Minh CommuneChau
6
12
4
8
12
12
4
4
4
8
6
8
36/52
Basically, both Minh Chau and Quan Lan localities have quite favorable conditions for developing ecotourism. However, Quan Lan commune has more advantages to develop ecotourism in a humanistic direction, because this is an area with many famous historical relics such as Quan Lan Communal House, Quan Lan Pagoda, Temple worshiping the hero Tran Khanh Du, ... along with local festivals held annually such as the wind praying ceremony (March 15), Quan Lan festival (June 10-19); due to its location near the port and long exploitation time, the beaches in Quan Lan commune (especially Quan Lan beach) are no longer hygienic and clean to ensure the needs of tourists coming to relax and swim; this is also an area with many beautiful landscapes such as Got Beo wind pass, Ong Phong head, Voi Voi cave, but the ability to access these places is still very limited (dirt hill road, lots of gravel and rocks), especially during rainy and windy times; In addition, other natural resources such as mangrove forests and sea worms have not been really exploited for tourism purposes and ecotourism development. On the contrary, Minh Chau commune has more advantages in developing ecotourism in the direction of natural tourism, this is an area with diverse ecosystems such as at Rua De Beach, Bai Tu Long National Park Conservation Center...; Minh Chau beach is highly appreciated for its natural beauty and cleanliness, ranked in the top ten most beautiful beaches in Vietnam; Minh Chau commune is also home to Tram forest with a large area and a purity of up to 90%, suitable for building bridges through the forest (a very effective type of natural ecotourism currently applied by many countries) for tourists to sightsee, as well as for the purpose of studying and researching.
Figure 3.1: Thenmala Forest Bridge (India) Source: https://www.thenmalaecotourism.com/(August 21, 2019)
3.2.2. Using SWOT matrix to evaluate Quan Lan island tourism
General assessment of current tourism activities of Quan Lan island is shown through the following SWOT matrix:
Table 3.5: SWOT matrix evaluating tourism activities on Quan Lan island
Internal agent
Strengths- There is a lot of potential for tourism development, especially natural ecotourism and humanistic ecotourism.- The unskilled labor force is relatively abundant.- resource environmentunpolluted, still
Weaknesses- Poorly developed infrastructure, especially traffic routes to tourist destinations on the island.- The team of professional staff is still weak.- Tourism products in general
quite wild, originalintact
general and DLST in particularalone is monotonous.
External agents
Opportunity- Tourism is a key industry in the socio-economic development strategy of the province and Van Don economic zone.- Quan Lan was selected as a pilot area for eco-tourism development within the framework of the green growth project between Quang Ninh province and the Japanese organization JICA.- The flow of tourists and especially ecotourism in the world tends toincreasing
Challenge- Weather and climate change abnormally.- Competition in tourism products is increasingly fierce, especially with other localities in the province such as Ha Long, Mong Cai...- Awareness of tourists, especially domestic tourists, about ecotourism and nature conservation is not high.
Through summary analysis using SWOT matrix we see that:
To exploit strengths and take advantage of opportunities, it is necessary to:
- Diversify products and service types (build more tourism routes aimed at specific needs of tourists: experiential tourism immersed in nature, spiritual cultural tourism...)
- Effective exploitation of resources and differentiated products (natural resources and human resources)
div.maincontent .p { color: black; font-family:"Times New Roman", serif; font-style: normal; font-weight: normal; text-decoration: none; font-size: 14pt; margin:0pt; } div.maincontent p { color: black; font-family:"Times New Roman", serif; font-style: normal; font-weight: normal; text-decoration: none; font-size: 14pt; margin:0pt; } div.maincontent .s1 { color: black; font-family:"Times New Roman", serif; font-style: normal; font-weight: normal; text-decoration: none; font-size: 13pt; } div.maincontent .s2 { color: black; font-family:"Times New Roman", serif; font-style: normal; font-weight: normal; text-decoration: none; font-size: 13pt; } div.maincontent .s3 { color: #0D0D0D; font-family:"Times New Roman", serif; font-style: normal; font-weight: bold; text-decoration: none; font-size: 14pt; } div.maincontent .s4 { color: black; font-family:"Times New Roman", serif; font-style: italic; font-weight: normal; text-decoration: none; font-size: 14pt; } div.maincontent .s5 { color: black; font-family:"Times New Roman", serif; font-style: italic; font-weight: bold; text-decoration: none; font-size: 14pt; } div.maincontent .s6 { color: black; font-family:"Times New Roman", serif; font-style: italic; font-weight: normal; text-decoration: none; font-size: 14pt; vertical-align: -3pt; } div.maincontent .s7 { color: black; font-family:"Times New Roman", serif; font-style: italic; font-weight: normal; text-decoration: none; font-size: 14pt; vertical-align: -2pt; } div.maincontent .s8 { color: black; font-family:"Times New Roman", serif; font-style: italic; font-weight: normal; text-decoration: none; font-size: 14pt; vertical-align: -1pt; } div.maincontent .s9 { color: black; font-family:"Times New Roman", serif; font-style: normal; font-weight: normal; text-decoration: none; font-size: 14pt; } div.maincontent .s10 { color: black; font-family:"Times New Roman", serif; font-style: normal; font-weight: bold; text-decoration: none; font-size: 14pt; } div.maincontent .s11 { color: black; font-family:"Times New Roman", serif; font-style: normal; font-weight: normal; text-decoration: none; font-size: 14pt; } div.maincontent .s12 { color: black; font-family:Symbol, serif; font-style: normal; font-weight: normal; text-decoration: none; font-size: 14pt; } div.maincontent .s13 { color: black; font-family:Wingdings; font-style: normal; font-weight: normal; text-decoration: none; font-size: 14pt; } div.maincontent .s14 { color: black; font-family:"Times New Roman", serif; font-style: normal; font-weight: normal; text-decoration: none; font-size: 9pt; vertical-align: 5pt; } div.maincontent .s15 { color: black; font-family:"Times New Roman", serif; font-style: normal; font-weight: normal; text-decoration: none; font-size: 9pt; vertical-align: 5pt; } div.maincontent .s16 { color: black; font-family:Cambria, serif; font-style: italic; font-weight: normal; text-decoration: none; font-size: 14pt; } div.maincontent .s17 { color: #080808; font-family:"Times New Roman", serif; font-style: normal; font-weight: bold; text-decoration: none; font-size: 14pt; } div.maincontent .s18 { color: #080808; font-family:"Times New Roman", serif; font-style: normal; font-weight: normal; text-decoration: none; font-size: 14pt; } div.maincontent .s19 { color: black; font-family:"Times New Roman", serif; font-style: normal; font-weight: normal; text-decoration: none; font-size: 11pt; } div.maincontent .s20 { color: black; font-family:"Times New Roman", serif; font-style: normal; font-weight: normal; text-decoration: none; font-size: 10pt; } div.maincontent .s21 { color: black; font-family:"Times New Roman", serif; font-style: normal; font-weight: bold; text-decoration: none; font-size: 11pt; } div.maincontent .s22 { color: black; font-family:"Times New Roman", serif; font-style: normal; font-weight: normal; text-decoration: none; font-size: 11pt; } div.maincontent .s23 { color: black; font-family:"Times New Roman", serif; font-style: italic; font-weight: normal; text-decoration: none; font-size: 14pt; } div.maincontent .s24 { color: #212121; font-family:"Times New Roman", serif; font-style: normal; font-weight: normal; tex -
 Discussion of Quantitative Research Results on the Impact of Control Variables on Financial Performance
 -
 Practical Research Results on Event Organization Skills of Tourism Students
 -
 Discussion of Research Results of the First Model
 -
 Research Results on the Relationship Between Exchange Rate Level and FDI Capital in Vietnam and Discussion
This result can be explained that people with a tendency to have a stable or balanced emotional personality are usually calm and psychologically stable, they will be less disturbed, anxious, and pressured by work in general as well as this specific change. When the organization changes, they will calmly consider and support the change. Eysenck (1991) in his model of personal identity believes that extroverts are often enthusiastic, proactive, and sociable while the opposite is calm and careful. With the survey results of employees (including managers and employees) at state-owned enterprises, the personality tendency that is expressed is not extroversion but on the contrary, introversion. The average value of the EX1 statement "I am often the leader in all activities" is even lower than the normal level (2.95). This also explains why in the test results of the impact of extroversion on readiness for change, there are some results obtained that TCHN has a negative impact (contrary to the initial hypothesis) on readiness for change (TCHN → SSCX, = - 0.342, p= 0.000 and TCHN → SPH, = - 0.209, p= 0.002). If considered like that, the statements assessed on the scale of personal personality are also quite consistent with the
The results of respondents' assessment of the scale on emotional stability. The mean scores of the options for the scale on emotional stability are all greater than normal (>3), which shows that respondents tend to show themselves as calm people, less prone to negative emotions, anxiety and sadness. This result is quite similar to the results of Holt et al. (2007) when the authors concluded that individuals with negative emotions also have a negative impact on readiness for change. Several other studies on psychological states with change also gave similar results. For example, Erdheim et al. (2006) and Syed et al. (2015) confirmed that extroversion and emotional instability have a negative impact on organizational commitment in different aspects. Thus, with this result, it can be confirmed that individuals with a tendency towards emotional stability will have a higher readiness for change. With extroversion, it is clear that the number of respondents did not show a clear tendency towards extroversion but tended to be balanced in the middle, even leaning towards introversion. Therefore, there is not enough evidence to conclude about the positive impact of extroversion on personal readiness for change.
Table 5.1. Descriptive statistics of the extroversion personality scale
EXP1 | EXP2 | EXP3 | EXP4 | EXP5 | ||
N | Valid | 364 | 364 | 364 | 364 | 364 |
Missing | 0 | 0 | 0 | 0 | 0 | |
Mean | 2.95 | 3.10 | 3.43 | 3.49 | 3.21 | |
Mode | 3 | 3 | 3 | 3 | 3 | |
Std. Deviation | .805 | .663 | .671 | .690 | .544 | |
Skewness | .217 | .063 | .325 | -.026 | 1,019 | |
Std. Error of Skewness | .128 | .128 | .128 | .128 | .128 | |
Kurtosis | -.617 | 1,082 | .248 | .077 | 1,890 | |
Std. Error of Kurtosis | .255 | .255 | .255 | .255 | .255 | |
Minimum | 1 | 1 | 1 | 1 | 2 | |
Maximum | 5 | 5 | 5 | 5 | 5 | |
Source: results of data analysis of the topic
For demographic variables
The results of the study indicate that gender, age and job position have little effect on perceptions of change through aspects such as fit, support, ability to change, or trade-off benefits. This is quite consistent with other studies in the world. The determination that age and gender do not affect readiness for change is also quite consistent with previous studies by (Cunningham, 2002). However, according to previous studies, job position has an impact on readiness for change, in which managers tend to support change.
higher than that of employees. However, the results of the thesis do not provide enough evidence to prove this. One possible explanation is that the surveyed enterprises have much fewer managers than employees (about 10-20% of the total number of employees) who are well-qualified and professional. These managers are also mainly at the grassroots level, and the empowerment of them is very little in the enterprises. In the research sample of the thesis, the number of managers is 61 compared to the number of employees surveyed is 303, so it is difficult to avoid the result of insufficient evidence to prove it.
Changing Organizational Context – Trust in Management
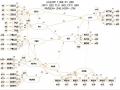
As expected, the factor of trust in management has a positive impact on individual readiness for change in all 5 aspects including emotions and perceptions of change. All hypotheses of group H3 were accepted. In which, trust in management has the strongest impact on the perception of the appropriateness of change ( = 0.31) and the perception of leadership support for change ( = 0.325). The role of managers, especially senior managers in organizations is undeniable. Good management capacity will create confidence in organizational members that this change is necessary, beneficial and will be successful. This result completely coincides with the studies of Armenakis et al. (2002), Holt et al. (2007), Vakola (2005) and some other studies.
The results of the previous qualitative interviews in the study also showed that there were some cases where individuals left their jobs immediately after the change was announced. They explained their decision by saying that they decided to find another place to work because they saw in the organization's change plan that the person responsible for leading the change was someone they did not trust in their abilities.
Changing Organizational Context - Communication Environment
The communication environment in the organization represents the level of information exchange between individuals in the organization. Information can be transmitted through formal and informal channels. The communication environment is measured through the factor of communication atmosphere in the organization. That is, measuring the informal exchange of information between colleagues, whether information about change is repeated many times, whether many people repeat it to the individual or not. The analysis results show that out of the 5 hypotheses in group H4, 4 hypotheses are supported. The hypothesis about the impact of the communication environment on the individual's feelings about change is not supported (p=0.764
>0.05). This can be explained that, the exchange of information within the organization can make individuals understand more about this change of the organization, thereby having a more correct perception and being more ready for the change. However, emotion can be a different psychological state unlike perception. This can be the feeling of the individual right after receiving the information.
information about organizational change, over time along with the progress of implementing the change, the perception of change can be improved through information exchange but the feelings about change such as "liking", excitement", "looking forward" may not change. Because this is a new factor added to the scale measuring individual readiness for change, more in-depth studies are still needed to confirm. However, in terms of perception of change, the study has had results that overlap with previous studies on readiness for change such as Hol et al. (2007), Vakola (2014), ...
Hypothesis
Content | Result | |
The Relationship Between Management Trust and Readiness for Change | ||
Hypothesis H3a | Managerial trust positively influences emotions toward organizational change | Acceptance |
Hypothesis H3b | Management trust positively influences perceptions of the appropriateness of organizational change. | Acceptance |
Hypothesis H3c | Management trust positively influences perceptions of leadership support for organizational change. | Acceptance |
Hypothesis H3d | Management beliefs positively influence individuals' perceptions of their ability to implement organizational change. | Acceptance |
Hypothesis H3e | Managerial trust negatively affects individuals' perceptions of trade-offs | Acceptance |
The Relationship Between Communication Environment and Readiness for Change | ||
Hypothesis H4a | Communication environment has a positive impact on emotions with organizational change. | Reject |
Hypothesis H4b | Communication Environment Has a Positive Impact on Perceptions of Appropriateness of Organizational Change | Acceptance |
Hypothesis H4c | Communication environment has a positive impact on perceptions of leadership support. | Acceptance |
Hypothesis H4d | The communication environment has a positive impact on an individual's ability to make change. | Acceptance |
Hypothesis H4e | The communication environment has an inverse effect on individuals' perceptions of trade-offs. | Acceptance |
Changing Organizational Context – Organizational Justice
Organizational justice is expressed through the individual's perception of fairness in performance appraisal. Performance appraisal is a management content that is carried out in every enterprise, the results of performance appraisal can be the answer to whether individuals receive what they deserve for the work they have completed or not? In organizations, performance appraisal results are the basis for employee treatment such as salary, bonus, ... Fairness in performance appraisal is measured through two aspects: fairness in the performance appraisal process (CBQT) and fairness in performance results (CBPP). Research results show that CBQT has a positive impact on readiness for change from both cognitive and emotional perspectives. The strongest impact was on the perception of the suitability of change for the organization (β=0.564) and the lowest impact was on the perception of the individual's ability to implement change (β=0.204).
Hypothesis
Content | Result | |
The Relationship Between Procedural Justice and Readiness for Change | ||
Hypothesis H5a | Procedural justice has a positive effect on emotions toward change. | Acceptance |
Hypothesis H5b | Procedural Justice Has a Positive Effect on Perceptions of Appropriateness of Change | Acceptance |
Hypothesis H5c | Procedural justice has a positive effect on perceptions of leadership support. | Acceptance |
Hypothesis H5d | Procedural justice has a positive impact on individuals' ability to implement change. | Acceptance |
Hypothesis H5e | Procedural fairness has a negative effect on individuals' perceptions of trade-offs. | Acceptance |
The Relationship Between Distributive Equity and Readiness for Change | ||
Hypothesis H6a | Distributive justice has a positive effect on emotions toward change. | Reject |
Hypothesis H6b | Distributive Equity Has a Positive Effect on Perceptions of Appropriateness of Change | Acceptance |
Hypothesis H6c | Distributive justice has a positive effect on perceptions of leadership support. | Reject |
Hypothesis H6d | Distributive justice has a positive impact on individuals' ability to make changes. | Acceptance |
Hypothesis H6e | Distributive justice has an inverse effect on individuals' perceptions of trade-offs. | Reject |
Meanwhile, fairness in job performance evaluation results only has a significant impact on two factors: suitability and ability to implement change, the estimated impact coefficients are = 0.157 and = 0.266 respectively (see Table 4.19). It is possible that because fairness in job performance evaluation results is often associated with the benefits (treatment, salary, bonus) that individuals will achieve when performing their work, the perception of fairness in results may not be consistent among individuals in the same organization compared to fairness in the process, because individuals tend to think more about their own benefits than other factors. According to the initial qualitative research results, interviewee No. 2 said: " I see that in the current way of evaluating work results, our current salary calculation level is quite low compared to the outside, so when we see the way of doing it, there is no bias towards anyone, but everyone is aware that the salary is lower than the outside, so it is not satisfactory" . And the opinion of interviewee No. 6: "I think that first of all, we should change the salary calculation method, because if the salary calculation method is the same as now, no matter what the leaders plan to change, it is difficult to support. As it is now, my salary for direct work is the same as in the office, but I work much harder" . It is clear that the use of performance evaluation results to calculate salary in some companies needs to be improved. The current situation of fairness in the SOEs in the research sample is also not in a good condition. The average value of perceived fairness in distribution (performance evaluation results) is also at a low average level (Mean = 3.49). Fairness in performance appraisal needs to be improved even though the majority of individuals still support organizational change.
This result has some disagreements with the study of Shan (2011) on the impact of organizational justice on readiness for change. Accordingly, when studying the context of restructuring the education sector in Pakistan, Shan (2011) found that organizational justice in two aspects, procedural justice and distributive justice, both have a positive impact on readiness for change. However, the research method of Shan (2011) is to use Pearson correlation and multiple regression analysis to conclude on this relationship. In addition, readiness for change in Shan's study (2011) was measured by the scale of Madsen et al. (2005) which is a unidimensional scale, focusing on the aspect of intended behavior, and cannot fully analyze the impact of organizational justice on each aspect of readiness for change like the multidimensional scale of Holt et al. (2007). Therefore, this is still a finding of the topic in affirming the positive impact of organizational justice and individual readiness for change. Especially affirming the impact of distributive justice
positively affects individuals' perceptions of the appropriateness of change (β=0.181) and individuals' ability to implement change (β=0.233).
Characteristics of the organization – field of activity and state ownership ratio
As the results of regression analysis and ANOVA mean difference analysis, organizational readiness for change is affected by the factors of the field of activity and the state ownership ratio. The field of activity of the organization has been identified by some previous studies as having an impact on individual readiness (Cunningham, 2002). However, the analysis results show that the field of activity of the organization has an impact on the perception of leadership support and the perception of the suitability for organizational change. Specifically, the perception of leadership support for change is higher in SOEs in the manufacturing sector than in the remaining group, SOEs in the service sector.
Regarding the influence of production ownership ratio, this factor affects individual readiness for organizational change through the aspects of perception of the appropriateness of change, perception of leadership support for change and perception of ability to implement change. Specifically, readiness for change expressed through perception of the appropriateness of change and ability to implement change has a higher impact in SOEs with less than 50% ownership compared to SOEs with ownership ratio of over 50%. Perception of leadership support for change is influenced by the state ownership ratio in the opposite direction, higher in SOEs that are equitized for the first time (ownership ratio of over 50%) compared to SOEs with full divestment. ( Table 4.21 ). In search of an explanation for this result, the author found that in SOEs that have been equitized and where the state still holds a controlling stake (more than 51%), the change plan often does not include changes in the enterprise's leadership. Meanwhile, in SOEs that have completely divested, the change often goes hand in hand with changes in the organizational structure, and in some cases, even changes to most of the leadership. This may be the cause of the inconsistent impact of the state ownership ratio on the perception of leadership support for change (The estimated coefficient for leadership support is -0.1, while the values corresponding to the perception of suitability and implementation capability are all positive. This is quite consistent with the assessment of experts and management agencies on transformation in SOEs. According to the Government's report to the National Assembly in 2019, in SOEs with a high state capital ownership ratio, there has been no change in the governance and business model (according to Vietnamnet). The management apparatus has hardly changed, especially senior leaders. In contrast, in SOEs that have divested all state capital, the interests of senior managers may be affected, making it difficult for these leaders to have a supportive attitude.