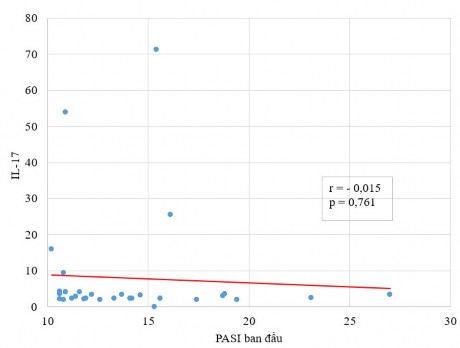
Figure 3.8: Correlation between IL-17 concentration and PASI score
Comment: There was no correlation between IL-17 concentration and PASI score.
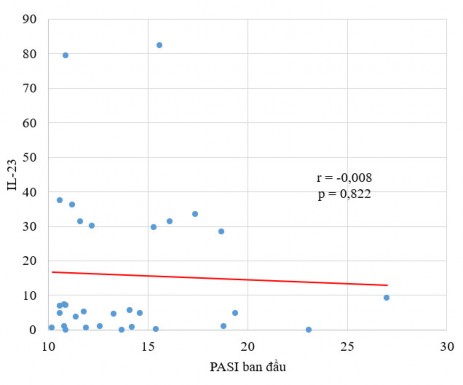
Figure 3.9: Correlation between IL-23 concentration and PASI score
Comment: There was no correlation between IL-23 concentration and PASI score.
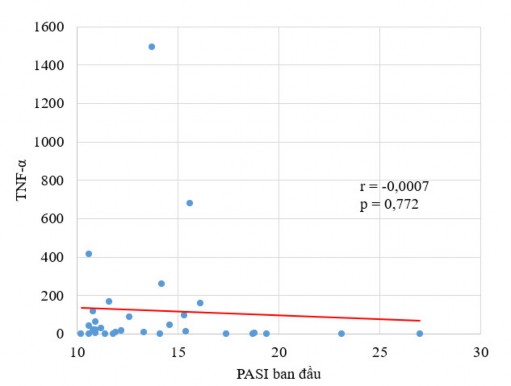
Figure 3.10: Correlation between TNF-α concentration and PASI score
Comment: There was no correlation between TNF-α concentration and PASI score.
Table 3.40. Association between pretreatment cytokine levels and disease severity (n=31)
Serum index
Medium (n = 29) ̅ ± SD | Heavy (n=2) ̅ ± SD | p* | |
IL-17 (pg/ml) | 8.37±16.01 | 3.03±0.58 | 0.94 |
IL-23 (pg/ml) | 16.57±22.27 | 4.67±6.60 | 0.44 |
TNF-α (pg/ml) | 128.13±301.43 | 0.08±0.11 | 0.11 |
Maybe you are interested!
-
 Effect of Initial Glyphosate Concentration on Processability of Electrochemical Fenton Process
 -
 Measure 4: Make Tools and Toys to Use in Children's Play Activities
 -
 Perspectives on Improving the Quality of Law Application in Resolving Land Use Rights Disputes at the People's Court
 -
 Internal control of revenue and expenditure activities at the National Children's Hospital - 2
 -
 “Cronbach's Alpha Cost Factor Scale”
* Krusal-Wallis test
Comments: The difference in IL-17, IL-23 and TNF-α concentrations between the two groups of moderate and severe psoriasis was not statistically significant (p > 0.05).
Table 3.41. Association between pretreatment cytokine concentrations and gender (n=31)
Serum index
Male (n = 21) ̅ ± SD | Female (n=10) ̅ ± SD | p* | |
IL-17 (pg/ml) | 10.07±18.41 | 3.73±4.48 | 0.13 |
IL-23 (pg/ml) | 16.05±24.33 | 15.30±16.16 | 0.72 |
TNF-α (pg/ml) | 161.05±349.51 | 36.28±54.45 | 0.63 |
* Krusal-Wallis test
Comments: The difference in IL-17, IL-23 and TNF-α concentrations between the male and female groups was not statistically significant (p > 0.05).
Table 3.42. Association between pretreatment cytokine concentrations and age of onset (n=31)
Serum index
< 40 years old (n=27) ̅ ± SD | 40 years old (n=4) ̅ ± SD | p* | |
IL-17 (pg/ml) | 7.55 ± 16.12 | 11.19 ± 11.19 | 0.56 |
IL-23 (pg/ml) | 14.81 ± 22.65 | 22.56 ± 14.68 | 0.48 |
TNF-α (pg/ml) | 129.21 ± 312.69 | 64.04 ± 78.04 | 1 |
* Krusal-Wallis test
Comments: The difference in IL-17, IL-23 and TNF-α concentrations between the two age groups of onset over 40 and under 40 was not statistically significant (p > 0.05).
Table 3.43. Association between pretreatment cytokine concentrations and age group above and below 33 years (n=31)
Serum index
< 33 years old (n=17) ̅ ± SD | 33 years old (n=14) ̅ ± SD | p* | |
IL-17 (pg/ml) | 10.0 ± 20.06 | 5.62 ± 7.04 | 0.61 |
IL-23 (pg/ml) | 14.54 ± 21.41 | 17.34 ± 22.86 | 0.58 |
TNF-α (pg/ml) | 144.78 ± 366.35 | 91.68 ± 176.78 | 0.70 |
* Krusal-Wallis test
Comment: The difference in IL-17, IL-23 and TNF-α concentrations between the two age groups over 33 and under 33 years old was not statistically significant (p > 0.05).
Table 3.44. Association between pretreatment cytokine concentrations and disease duration (n=31)
Serum index
< 5 years (n = 12) ̅ | ≥ 5 years (n=19) ̅ | p* | |
IL-17 (pg/ml) | 8.42 ± 14.81 | 7.77 ± 16.35 | 0.13 |
IL-23 (pg/ml) | 13.91 ± 23.81 | 17.0 ± 20.93 | 0.21 |
TNF-α (pg/ml) | 186.51 ± 432.41 | 79.30 ± 155.26 | 0.71 |
* Krusal-Wallis test
Comment: The difference in IL-17, IL-23 and TNF-α concentrations between the two groups with disease duration of more than and less than 5 years was not statistically significant (p > 0.05).
Table 3.45. Association between pretreatment cytokine concentrations and history of systemic drug use (n=31)
Serum index
Yes (n = 12) ̅ ± SD | No (n=19) ̅ ± SD | p* | |
IL-17 (pg/ml) | 6.93 ± 14.82 | 8.71 ± 16.31 | 0.60 |
IL-23 (pg/ml) | 26.16 ± 29.40 | 9.27 ± 11.98 | 0.15 |
TNF-α (pg/ml) | 100.48 ± 196.27 | 133.64 ± 345.08 | 0.61 |
* Krusal-Wallis test
Comments: The difference in IL-17, IL-23 and TNF-α concentrations between the two groups of psoriasis vulgaris that had used systemic drugs and had not used systemic drugs was not statistically significant (p > 0.05).
Table 3.46. Association between pretreatment cytokine levels and family history of psoriasis (n=31)
Serum index
Yes (n = 7) ̅ ± SD | No (n=24) ̅ ± SD | p* | |
IL-17 (pg/ml) | 12.32 ± 26.05 | 6.78 ± 11.4 | 0.21 |
IL-23 (pg/ml) | 6.50 ± 11.32 | 18.52 ± 23.44 | 0.16 |
TNF-α (pg/ml) | 40.58 ± 63.67 | 144.20 ± 329.21 | 0.55 |
* Krusal-Wallis test
Comments: The difference in IL-17, IL-23 and TNF-α concentrations between the two groups of psoriasis with and without family history of psoriasis was not statistically significant (p > 0.05).
Table 3.47: Correlations between cytokine indices (n=31)
IL-17 | IL-23 | TNF-α | ||
IL-17 | r | 1 | 0.156 | -0.005 |
p | 1 | 0.24 | 0.61 | |
IL-23 | r | 1 | 0.007 | |
p | 1 | 0.64 | ||
TNF-α | r | 1 | ||
p | 1 |
* Linear Regression Analysis
Comment: There was no correlation between cytokine indices with p > 0.05.
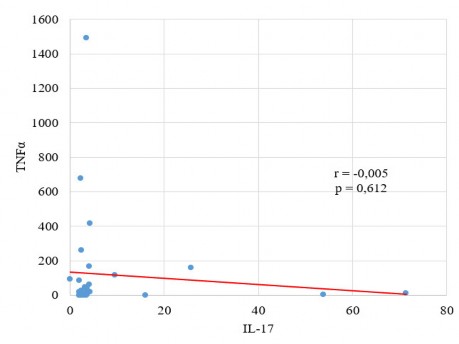
Figure 3.11: Correlation between IL-17 and TNF-α concentrations
Comment: There was no correlation between IL-17 and TNF-α concentrations with p > 0.05.
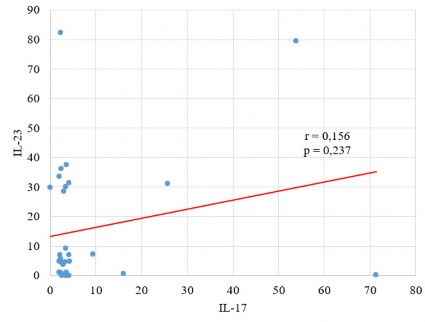
Figure 3.12: Correlation between IL-17 and IL-23 concentrations
Comment: There was no correlation between IL-17 and IL-23 concentrations with p > 0.05.
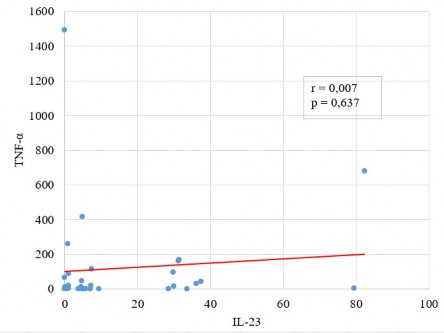
Figure 3.13: Correlation between IL-23 and TNF-α concentrations
Comment: There was no correlation between IL-23 and TNF-α concentrations with p > 0.05.
3.3.3. Changes in cytokine concentrations before treatment and when reaching PASI 75
Table 3.48. Changes in cytokine levels before treatment and when reaching PASI 75 (n=31)
Serum index
Before treatment (n=31) | When reaching PASI 75 (n=31) | p* | |||
̅ ± SD | Min-Max | ̅ ± SD | Min-Max | ||
IL-17 (pg/ml) | 8.02 ± 15.52 | 0-71.36 | 3.28 ± 4.70 | 0-27.12 | 0.0061 |
IL-23 (pg/ml) | 15.81 ± 21.75 | 0-82.38 | 8.79 ± 14.67 | 0-69.30 | 0.0405 |
TNF-α (pg/ml) | 120.80 ± 292.99 | 0-1493.93 | 41.11 ± 74.46 | 0-385.96 | 0.3418 |
* Wilcoxon test
Comments: IL-17 and IL-23 indices decreased statistically significantly in 31 patients when reaching PASI 75 compared to before treatment with p < 0.05. TNF-α concentrations decreased but were not statistically significant with p > 0.05.