H1c: Perceived usefulness has a positive impact on the attitude towards granting NNCNC credit of commercial bank credit officers.
H1d: Perceived usefulness positively affects the intention to grant NNCNC credit of commercial bank credit officers.
Hypotheses from TPB model
H2a: Attitude positively affects the intention of granting NNCNC credit of commercial bank credit officers.
Maybe you are interested!
-

 Analysis of the Impact of the Factor "Bank's Credit Policy"
 -
 Results of Exploratory Factor Analysis of Factors Related to Employee Motivation at Quang Binh Military Commercial Joint Stock Bank
 -
 Analysis and proposal of solutions to expand retail activities at Military Commercial Joint Stock Bank - 1
 -
 Perform Factor Analysis (Efa) for Independent Variables
 -
 Summary Table of Exploratory Factor Analysis Results Efa
H2b: Subjective norms positively affect the intention to grant NNCNC credit of commercial bank credit officers.
H2c: Perceived behavioral control positively affects the intention to grant NNCNC credit of commercial bank credit officers.
Hypothesis of risk
H3: Perceived risk has a negative impact on the attitude towards granting NNCNC credit of commercial bank credit officers.
3.2.2.2. Second research model
The subject of the second research model is: Behavioral intention to continue granting credit to customers who need loans for NNCNC production of credit officers at commercial banks in the research area.
The survey subjects of the second research model are: Credit officers of commercial banks in the research area who have implemented credit contracts for customers borrowing capital for NNCNC production.
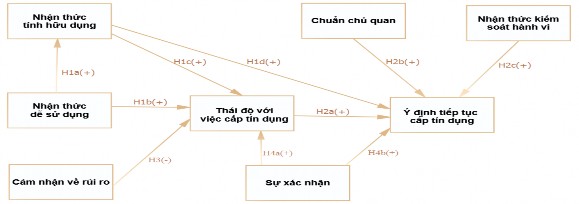
Figure 3.5 Second research model
The second research model as shown in Figure 3.5 above includes 8 theoretical concepts and 10 research hypotheses, including 9 hypotheses about positive effects and 01 hypothesis about negative effects; the concepts in the model are defined as follows:
Intention to continue granting credit to customers borrowing capital for NNCNC production, or simply called intention to grant credit : Is the intention of credit officers of commercial banks to continue granting credit to customers in need of capital for NNCNC production.
Attitude towards borrowing: Is the most general assessment of credit officers of commercial banks towards granting credit to customers in need of NNCNC loans.
Subjective norms: Represent the perception of credit officers of commercial banks about the pressures from colleagues, bank leaders or bank policies and state policies on NNCNC and credit for NNCNC production.
Perceived behavioral control: Is the perception of credit officers of commercial banks about the factors that promote or hinder them in granting credit to customers who need loans for NNCNC production; for example: empowerment from the bank, personal knowledge or experience in this credit field, etc.
Perceived usefulness: Is the subjective belief of credit officers of commercial banks about the practical benefits that providing capital for NNCNC production will bring to themselves, to the bank and to society.
Perceived ease of use: Is the subjective belief of commercial bank credit officers that the bank's credit processes and procedures for NNCNC customers are easy, simple and effective?
Risk perception: Represents the awareness of credit officers of commercial banks about the risks that may arise in the process of granting credit to customers who need to borrow capital for NNCNC production.
Confirmation: Is the result of the assessment process of credit officers of commercial banks on whether the past results of granting NNCNC credit have met their expectations or not. Or simply put, confirmation is the experience of credit officers of commercial banks with NNCNC customers, have they completed the funding for NNCNC smoothly and well or not?
The hypotheses of the research model are stated as follows: Group of hypotheses from the TAM model
H1a: Perceived ease of use positively affects perceived usefulness of NNCNC credit granting by commercial bank credit officers.
H1b: Perceived ease of use positively affects the attitude towards granting NNCNC credit of commercial bank credit officers.
H1c: Perceived usefulness has a positive impact on the attitude towards granting NNCNC credit of commercial bank credit officers.
H1d: Perceived usefulness positively affects the intention to grant NNCNC credit of commercial bank credit officers.
Hypotheses from TPB model
H2a: Attitude towards financing positively affects the intention to provide NNCNC credit of commercial bank credit officers.
H2b: Subjective norms positively affect the intention to grant NNCNC credit of commercial bank credit officers.
H2c: Perceived behavioral control positively affects the intention to grant NNCNC credit of commercial bank credit officers.
Hypothesis of risk
H3: Perceived risk has a negative impact on bank employees' attitude towards granting NNCNC credit.
Hypotheses from the ECT model
H4a: Confirmation has a positive impact on the attitude towards granting NNCNC credit of commercial bank credit officers.
H4b: Confirmation has a positive impact on the intention to grant NNCNC credit of commercial bank credit officers.
3.2.3. Research design
The research was conducted in two main steps: preliminary research and formal research.
3.2.3.1. Preliminary research
It is conducted through two methods: Qualitative and quantitative. Qualitative research is used to explore, adjust and supplement observed variables used to measure research concepts. Qualitative research is conducted through group discussions and in-depth interviews. The content of interviews and group discussions is based on the questions of the original scale.
Inheriting from the research of Lee (2009) and the research of Bahatteacherjee (2001), based on the opinions of experts, the thesis will synthesize the content and add necessary observation variables to suit the research environment. The discussion content will be recorded and synthesized as a basis for adjusting and supplementing observation variables, as well as using appropriate terms for the context in Vietnam. The subjects participating in the interviews and discussions are leaders, heads and deputy heads of corporate customer departments and individual customer departments of commercial banks in Da Lat city. After the scales were supplemented and adjusted, preliminary quantitative research was conducted by surveying 50 credit officers of commercial banks in Da Lat city. The results of this qualitative research step include 9 measurement variables and 52 observation fields shown in Appendix 3.1.
The quantitative research was conducted for two purposes: First, to test the reliability of the scale before conducting the official research, and second, to estimate the response rate of the survey subjects in order to predict the number of survey forms that can be collected if the survey is conducted at commercial banks in the research area. The detailed results of this quantitative research step are shown in Appendix 3.2.
3.2.3.2. Official research
The official research was conducted using quantitative research methods with the survey subjects being credit officers who have never and have granted NNCNC credit working at commercial banks in the research area. The research data was collected through surveying the research subjects using a questionnaire. Then, the data will be cleaned and analyzed including: Cronbach'Alpha reliability analysis, EFA exploratory factor analysis, CFA confirmatory factor analysis. The hypotheses of the two research models will be tested through the SEM linear structural model analysis step. Finally, Bootstrap testing will be performed to check the accuracy of the estimates in the model.
3.2.4. Research sample
The study used a centralized sampling method (probability), with the population being all credit officers who have never and have ever implemented NNCNC credit contracts at all commercial banks in Lam Dong province. Because there was not enough list and resources to approach the entire population, the study selected all 22 commercial banks operating with 108 branches and transaction offices in the research area to conduct sampling by sending survey questionnaires. The author directly contacted 22 commercial banks with 108 branches and transaction offices.
transaction, each commercial bank was distributed from 10 to 100 survey forms depending on the size of the credit staff of these commercial banks. In total, 411 forms were collected. After eliminating some forms that were not suitable for the survey subjects of the thesis, or forms that were missing a lot of information or forms that had too many similar answers selected, 308 forms were retained, combined with 50 forms in the survey to make the official sample for the study (n=358). With 52 observed variables of the study, the minimum sample size recommended is 52x5=260 samples (Hair et al., 1988). However, because the survey respondents were divided into two groups, which were credit officers who had never or had ever made credit contracts for NNCNC customers. Therefore, the 358 survey questionnaires were divided into 2 groups, with group 1 consisting of 175 questionnaires for employees who had never provided NNCNC credit and 183 questionnaires for employees who had provided NNCNC credit, just enough to satisfy the minimum sample size for quantitative research (n=150) proposed by Man Nguyen Dinh Tho (2011).
3.2.5. Scale
The scales of theoretical concepts are inherited from previous studies by Lee (2009) and Bhattacherjee (2001), through qualitative research with experts to supplement and adjust the content to suit the research context of credit activities at commercial banks. The study uses a Likert scale with 5 corresponding levels (1: Completely disagree - 5: Completely agree). The content of the scale adjustments and additions, the synthesis of dependent and independent variables are shown in Appendix 3.1 Preliminary research results. The content of the survey questionnaire is shown in Appendix 3.2.
3.2.6. Data analysis method
Data were processed through two common steps of linear structural equation analysis (SEM) (Hair & ctg, 2014) with two measurement models and the structural model was evaluated using AMOS 22.0 software. For the measurement model, first of all, Cronbach'Alpha test and exploratory factor analysis (EFA) were used to preliminarily evaluate the scale. Next, confirmatory factor analysis (CFA) was used to test the composite reliability, convergent validity, discriminant validity and overall fit of the scale. For the structural model, SEM technique with ML (Maximum Likehood) estimation was used to evaluate the overall fit of the research model and the stated research hypotheses.
3.2.6.1. Descriptive analysis
Descriptive analysis uses descriptive statistical analysis in SPSS. This will show the characteristics of the sample such as age, gender, income etc.
3.2.6.2. Scale reliability analysis
The reliability of a scale indicates the consistency of a measurement tool when it is used to measure the same object under the same conditions. The reliability of a scale is assessed through the Cronbach's Alpha coefficient and the correlation between the measured variable and the total of the remaining variables in the scale (Nguyen Dinh Tho, 2011). The reliability of a scale is tested through two indexes (Hair et al, 1998):
- Item-total correlation coefficient is not less than 0.3.
- Cronbach's Alpha reliability from 0.6 or higher.
If the Cronbach's Alpha coefficient is < 0.6, the author will continue to remove the observed variable with the largest "Cronbach's Alpha If Item Delete" value. Then the newly selected scale will have a Cronbach's Alpha coefficient that is the "Cronbach's Alpha If Item Delete" value corresponding to the observed variable that has been removed.
3.2.6.3. Exploratory factor analysis EFA
Factor analysis EFA is the general name for a group of procedures used primarily to reduce and summarize data. Factor analysis aims to identify factors from statements of each attribute and group these statements into new factors. Factor analysis aims to group correlated variables into new groups of variables.
EFA analysis criteria applied in this thesis:
KMO coefficient (Kaiser – Mayer – Olkin) ≥ 0.50, Bartlett test significance level ≤
0.05. The necessary condition for applying factor analysis is that the variables must be correlated with each other (the measurement variables reflect different aspects of the same common factor), Bartlett's test considers the hypothesis that the correlation between observed variables is zero in the population. If this test is statistically significant (Sig ≤ 0.05), the observed variables are correlated with each other in the population. The Kaiser-Mayer-Olkin coefficient is an index used to consider the appropriateness of factor analysis. A large KMO value (between 0.5 and 1) is one of the conditions showing that EFA analysis is appropriate (Nguyen Dinh Tho, 2011).
Kaiser Criterion: eliminate less important factors. Only retain important factors with Eigenvalue greater than 1.0 (Kaiser, 1960), Eigenvalue represents the variation explained by each factor.
Variance explained criteria: Total variance explained is not less than 50% (Gerbing & Anderson, 1988).
Factor loading is an indicator to ensure the practical significance of EFA; factor loading > 0.30 is considered to reach the minimum level; > 0.40 is considered important; > 0.50 is considered to have practical significance (Hair & ctg, 2010). This study uses EFA analysis to gradually eliminate variables with factor loading less than 0.50.
Factor analysis method for variables in the scales will be performed with Principal Axis Factoring extraction and Promax rotation which is considered suitable for factor analysis which is further used for measurement models (CFA) and linear structural models (Nguyen Dinh Tho, 2011).
3.2.6.4. Confirmatory factor analysis CFA
The scale was tested by confirmatory factor analysis (CFA) using AMOS analysis software. In testing the scale, the CFA method in analyzing the linear structural model has many advantages over traditional methods (Nguyen Dinh Tho, 2011). The reason is that CFA allows us to test the theoretical structure of the measurement scales as well as the relationship between research concepts and other concepts without being biased by measurement error (Steenkamp & van Tripjp, 1991).
To measure the model's fit to market data, this study uses the Chi-squared (CMIN), Chi-squared adjusted by degrees of freedom (CMIN/df), comparative fit index (CFI), Tucker & Lewis index (TLI) and RMSEA (Root mean square error approximation) index.
The model is considered appropriate when the Chi-square test has a p value > 5% (Nguyen Dinh Tho, 2011). However, Chi-square has a disadvantage that it depends on sample size. If a model receives TLI, CFI values ≥ 0.9 (Bentler & Bonett, 1980), CMIN/df ≤ 2, RMSEA ≤ 0.08 (Steiger, 1990), the model is considered appropriate for market data. RMSEA is an important indicator, it determines the level of suitability of the model compared to the whole. Accordingly, CFA can be used to test unidimensionality, convergent validity and discriminant validity.
Convergent validity refers to the degree of convergence of a scale used to measure a concept after many times (repetition), that is, after repetitions the measurements have a close relationship with each other (Nguyen Dinh Tho, 2011). The scale achieves convergent validity if the standardized weights are all high (>0.5) and statistically significant (p < 5%).
Discriminant validity means that two scales measuring two different concepts must be different from each other (Bagozzi 1994), meaning that the correlation coefficients of these two concepts must be different from each other.
unit. Testing the discriminant validity of concepts based on a saturated model is a model in which the research concepts are free to relate to each other. There are two methods of testing discriminant validity:
- Method of using correlation coefficient: Two concepts achieve discriminant value when the correlation coefficient between them is less than 1 and is statistically significant (p-value < 0.05).
- Method of testing the value of each pair of concepts: Two pairs of concepts achieve discriminant validity when comparing the average variance extracted (AVE) of each concept with the square of the correlation coefficient r 2 , if AVE > r 2 then the two pairs of concepts achieve discriminant validity. On the contrary, if AVE < r 2 then the two concepts do not achieve discriminant validity (Hair et al, 2010). This method has many advantages over the method using correlation coefficients because the correlation coefficient will change if other concepts are involved. Moreover, in the case of high-level concepts, this method can compare the correlation coefficient between two concepts with the correlation coefficient between components of the same concept.
3.2.6.5. Testing the research model
Structural modelling, SEM technique with ML (Maximum Likelihood) estimation is used to assess the overall fit of the research model and the stated research hypotheses. In testing theoretical models and hypotheses, the linear structural model has an advantage over traditional methods such as multiple regression because it can calculate measurement error. Moreover, this method allows us to combine latent concepts with their measurements and can consider the measurements or combinations with the theoretical model at the same time (Nguyen Dinh Tho, 2011).
Chapter 3 Conclusion
Chapter 3 presented the research process and research methods for two separate studies of the thesis, including methods such as: Sampling, scale construction, data collection and data analysis. Detailed results of the two studies will continue to be presented in Chapter 4.